
Abstract
Hurdle technology combining mild acidification (4.6 < pH < 5.0) and reduced thermal treatment could be a potential preservation technique for the production of high-quality processed canned vegetables once it has been microbiologically validated. Freshly harvested green beans were acidified in pre-prepared brine using one of three acidulants (lactic acid [LA], glucono-delta-lactone [GDL], or fermented dextrose containing organic acids), hermetically sealed in cans, and thermally processed in a pilot-scale water-immersion retort. Eight levels of acidulant concentration (0.01–19.5 g/kg) and five levels of desired lethality (0.01–2.74 min) were applied through uniform shell experimental design (Doehlert network method). The color and texture properties of blanched green beans (control samples) and thermally processed green beans with and without prior acidification were evaluated. Statistical analysis showed that acid concentration had a significant effect on color characteristics, and that lethality had a significant effect on texture indices (p < 0.001). Regression models were developed for the prediction of both color and texture properties of thermally processed acidified green beans with two independent parameters: acidulant concentration and lethality.
INTRODUCTION
Food processing companies produce about eight to ten cans per person every year in the world, amounting to over 50 billion cans of food that are manufactured and consumed yearly.[Citation1] The canning industry’s main objective is to make perishable food that remains microbiologically safe with good quality for at least two years. Many researchers, including Abou-Fadel and Miller,[Citation2] Rao et al.,[Citation3] Abbatemarco and Ramaswamy,[Citation4] Smout et al.,[Citation5] and Banga et al.[Citation6] have studied canned vegetable quality, and all have concluded that the minimum required thermal processing should be designed to ensure the desired microbial safety and to produce minimal negative effects on food quality. Those researchers also emphasized that both heating costs and product quality losses increase as the processing time is lengthened. Current developments in the thermal processing of food are aimed at the development of cost-effective and energy-saving methods, with an effort to reduce the industries carbon footprint by means of green technology. In recent years, attempts have been made to apply the old-time methods of preservation, such as acidification prior to processing, as alternative approaches to meet this demand.
Acidification can help destroy microorganism spores by modifying their heat resistance, hampering their germination, and developing or reducing the chances of recovery for those that are injured,[Citation7] and, therefore, this method could allow processors to apply less severe sterilization conditions.[Citation8] The knowledge developed in the last few years regarding the behavior of bacteria in acid media has allowed the combination of moderate acidification with low-intensity heat treatments, which results in foods that are higher in quality but provide the same level of safety.[Citation9] Azizi and Ranganna[Citation10] investigated the effect of lowering pH, by either malic acid addition or lactic fermentation, on thermal processing requirements for canned vegetables. Acidification by lactic fermentation was initiated by Leuconostoc and Lactobacillus species followed by Pediococcus and Streptococcus species, and reduced the pH to 3.8 in three days. The processing time (3.5 min at 100°C) was adequate to render the canned acidified vegetables microbiologically safe. The processing time required for cans (77.8 × 119.1 mm and 103.2 × 119.1 mm), having an initial temperature of 65°C was 15 min or less in boiling water. Those researchers found that the color of lactic fermented canned products was superior to that of canned vegetables acidified with malic acid. Both products had a texture similar to that of freshly cooked vegetables, whereas the products acidified by fermentation had minimal sour taste. Reineke et al.[Citation11] described a temperature-dependent pH-value shift in buffers and liquid food during thermal preservation. In practice, that shift means that the pH of the processed food has to be controlled throughout thermal treatment.
For thermal treatment only, some mathematical methods have also been used to design the optimum processing conditions. For example, Avila et al.[Citation12] used the Monte Carlo procedure to evaluate the non-uniformity of in lethality delivered to processed green and white beans. They studied the influence of heating rate index on the color retention and hardness of green beans, and found that the optimum processing temperatures ranged from 125 to 135°C for color and from 120 to 135°C for hardness. Taherian and Ramaswamy[Citation13] proposed indices for textural studies of root vegetables following heat treatments only and discovered different mechanisms in modelling of tissue softening. Very recently, Tola and Ramaswamy[Citation14] evaluated the rate of pH reduction in carrots under atmospheric pressure and high pressure (200–300 MPa) with a view to lowering the pH below 4.6 for the potential thermal processing of acidified foods, but no further studies concerning physical properties have been reported. It was reported that acidification under high pressure was four to five times faster than processing under conventional conditions. From a regulatory point of view, lowering the pH below 4.6 is considered sufficient to prevent any Clostridium botulinum germination during storage. However, lowering the pH below 4.6 is not always desirable and acceptable to consumers, given deterioration in appearance and taste that occurs, as in the case of green beans. In a recent review article, Derossi et al.[Citation15] presented literature concerning acidification treatments for canned vegetables with no data on the effects of acidification on the textural properties of processed vegetables. Most of the literature presented was about the safety aspect, namely the effect of pH on characterization of microorganisms, and information on sensorial properties was limited. Some researchers have indicated that it is not easy to correctly plan an acidification treatment so as to ensure a sufficient safety margin without degrading product quality, and several aspects have to be taken into account such as direct and indirect microbial effects, the correct selection of acidulants and operating conditions, and organoleptic effects on the final product. More recently, a review article by Andres-Bello et al.[Citation16] reported available up-to-date data concerning the effect of pH on the color and texture of food products and concluded that this subject is still limited and that the changes are product dependent. However, no information has been reported on the mild modification of vegetables by lowering their natural pH to an intermediate level (4.6 < pH < 5.0) for the purpose of performing milder heat treatment.
Fresh green beans are widely used in the canning industry and the severe thermal processing needed to ensure microbiological safety usually causes some losses of quality in terms of color, texture, and other properties. One possible alternative approach is to reduce the pH of fresh green beans from 6.5–7.0 to 4.6–5.0 (for an intermediately acidic food) and them perform milder heat treatment. This is an interesting pH range owing to consumer acceptance of a slightly sour taste. Currently, limited information is available on the combined effects of acidification treatment and thermal processing on the quality of green beans, and no model exists to predict the quality of thermally processed acidified vegetables with respect to the acid used and lethality achieved. Therefore, the objectives of this research were to study the combined effects of mild acidification (4.6 < pH < 5.0) and thermal treatment on the color and texture properties of green beans, and to develop appropriate regression models. The results of this study could be useful to canned vegetable producers once proof has been obtained in further microbiological studies. Under intermediately acidic conditions, the thermal death rate of microorganism of public health concern may not necessarily follow the pattern found in low-acid food matrices.
MATERIALS AND METHODS
The raw materials were fresh green beans harvested from local farms less than two days prior to the experiments, LA in 80% liquid solution, GDL in powder form (Purac Inc., Lenexa, KS, USA), and another acidulant produced from dextrose fermented with bacterial cultures, containing a mix of various organic acids, commercially known as PTX (PTX Food Corp., Louisville, KY, USA) also in powder form. The beans were washed, blanched in hot water at 85°C for 2.5 min with light agitation, and then cooled. The control sample was the beans that had been blanched but not acidified or thermally processed at a high temperature.
Acidification Procedure
To obtain the desired acid concentration according to the experimental design, the required amount of acidulant (0.01–3.5 g/kg for LA, 0.9–4.6 g/kg for GDL, and 3.7–19.5 g/kg for PTX) was measured and placed in the bottom of each can. Blanched green beans (220 g) and an adequate quantity of brine (190 g containing 1.6% NaCl) were heated to 65°C and then poured into the cans. The cans were hermetically sealed, turned over five times to homogenize their contents, and then stored for a short time in a water bath at 65°C until thermal treatment was carried out in a retort. Preliminary tests demonstrated the complete dissolution of the acidulant under those conditions, by measuring the pH of the solution at different locations and over time until a stable and uniform pH was achieved.
The final pH of the thermally treated acidified vegetables was measured using an Accumet Basic AB-15 pH meter (Fisher Scientific, Montreal, QC, Canada) that had previously been calibrated and equipped with a temperature compensation probe. The thermally processed cans were stored immediately at 4°C for 48 h to allow the pH to stabilize. Preliminary tests were performed to confirm that 48 h of stabilization after thermal processing was sufficient to attain pH equilibrium. Before the pH was measured, the entire contents of the can (brine and green beans) were ground finely using a regular household blender.
Thermal Treatment
Five cans fitted with a thermocouple at the coldest point (center of the can at 19 mm from the bottom) were filled with green beans and brine in the manner described above, and were used to record the time-temperature profile during heat treatment. Heat treatment tests were performed in a water-immersion retort (STOCK America Inc., Apex, NC, USA) in static mode. The cans were randomly distributed in the retort, except for the cans fitted with a thermocouple, which were placed in specific positions (one in the center of the autoclave, one at the back on the left side, one at the back on the right side, one in the front on the right side, and one in the front on the left side). The retort was set for 121.1°C as the processing temperature, and the holding time was controlled according to the pre-calculated desired F-value.
During thermal treatment, the temperature of the slowest-to-heat can was monitored and considered to be the process profile, and the sterilizing value of the treatment (F-value) was calculated after treatment. Thermal treatment was stopped after the slowest can had reached the desired temperature and had been held for the given time; then the cans were cooled by running cold water over them. When the temperature in the cans had reached 20°C, the cans were removed and stored at 4°C for 48 h before they were opened for further measurements of physical properties.
Lethality Calculation
Different levels of the desired lethality, the F-values in minutes, for the experiments were calculated from the following equation:[Citation17]
where t is the time in minutes, and L is the lethal rate or instant lethality, a dimensionless number. The following equation is used to calculate L:
where T is the temperature at a given time (in °C), at which the lethal rate is calculated, and z is the temperature characteristic (z-value, measured in °C) that is the reciprocal of the slope of the thermal death curve for the target microorganism or spore; 10°C is the z-value frequently used in F-value calculations performed for low acid foods. The calculated L for a given time is equivalent to the lethality at 121.1°C as the reference temperature for sterilization purposes. Lethal rates, when plotted against processing time, can be used to calculate the F-value of a thermal process. The F-value can be defined as the time required to reduce initial microbial numbers, at a specified temperature, by a particular value, normally a multiple of the decimal reduction time (D-value) for the target microorganism.
Texture
Texture measurements were performed on green beans with a TA-XT2 texturometer (Stable Micro Systems Ltd., Godalming, UK). Preliminary tests were conducted to determine the most suitable methodology for measuring the effect of the treatments on the texture of the processed vegetables by comparing two texture analysis techniques through compression testing for firmness evaluation: (1) a texture profile analysis (TPA) using a circular probe (50 mm in diameter) and a Plexiglas cylinder (slightly larger in diameter); and (2) a compression test using a mini Kramer shear cell (TA-91M, Stable Micro Systems Ltd.). The maximum force and work during the compressions were measured for the calculation of texture properties. The preliminary tests showed that the Kramer cell had greater sensitivity to treatment effects, more closely resembled the tests performed on vegetables in industrial-scale production, and it simulated the conditions to which a food is subjected during chewing. Therefore, only the results of the compression tests using the Kramer shear cell are presented in this study.
The Kramer shear press consists of a slotted box that holds the sample. The probe has blades that are lowered into the product (compression) and exert enough force to push the sample through the slots in the bottom. The blades are aligned with these slots. In this study, the miniature version with five blades was used. The box was filled with 10 g of green beans cut to fit the cell dimensions; the vegetables were placed in such a manner that they covered the entire bottom of the device, forming a single layer. The vegetables were packed down by tapping the cell five times on a solid surface. The cell was then placed on a holder, and the blades were lowered to a point a few millimetres above the surface of the vegetables. Texture was measured by moving the probe at a constant speed of 1 mm/s and by measuring the exerted force as a function of vertical displacement. Data acquisition began when the force reached or exceeded 10 N, and stopped when it reached or exceeded 500 kN. The texture profile was obtained and analyzed using the Texture Expert software (Stable Micro Systems, Ltd.).
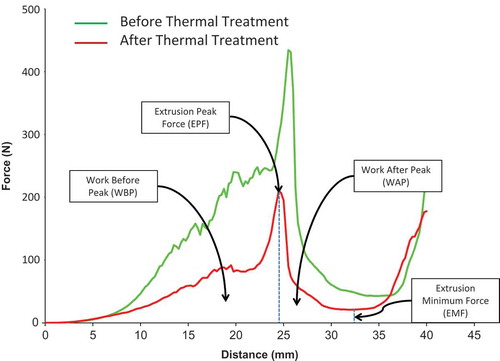
Peak force is defined as the point where maximum force is applied on the samples and they begin to break apart and extrude through the cell slots. Four parameters were directly measured and calculated from the force/displacement profile using the Texture Expert software: extrusion peak force (EPF), extrusion minimum force (EMF), work before peak (WBP), and work after peak (WAP). These values were obtained for both the treated and control samples. In order to evaluate the percentage of texture loss following the treatment, the percentage of these values were calculated with respect to the control and were reported as the relative indices. For example relative extrusion peak force (REPF) can be obtained as follows:
where EPFt is the EPF for the treated sample, and EPFc is the EPF for the control. The same approach was used to calculate the relative values of EMF, WBP, and WAP (REMF, RWBP, and RWAP, respectively).
Color
Color measurements were performed using a Minolta CM-503C colorimeter (Konica Minolta, Toronto, ON, Canada). Green bean samples of the same mass (25 g) were placed in a clean polypropylene Petri dish, which was in turn placed in the colorimeter. Prior to each series of measurements, the colorimeter was calibrated against black (standard black tile) and white (calibration cap). For each sample, ten measurements of the L, a, and b values were taken at different locations in the Petri dish. The mean of each set of the ten measurements was then calculated and used to represent the L, a, and b values for the sample. A visual basic interface was specially developed to allow the colorimeter to be controlled with a computer, and to record the measurements in an Excel file. The differences in color, relative to the blanched controls, were then calculated as the overall color difference (ΔE) using the following equation:
TABLE 1 Example of the uniform shell experimental design with two independent variables: acid concentration (C), and desired lethality (F)
Experimental Design, Statistical Analysis, and Modelling
The effects of acid concentration and heat treatment on the texture and color of thermally processed acidified green beans were evaluated through a set of experiments and analyses. In order to limit the number of required tests, the uniform shell experimental design (Doehlert[Citation18] network method) was selected. In general, with that technique only two independent factors can be studied at a time; however, several different levels of each variable can be applied. The experimental points forms an hexagon including three levels of lethality and five levels of acid concentration, and the central points were repeated three times for each hexagon (). The number of hexagons can be increased as required, in any direction (forward, backward, upward, or downward). The advantage of this design is the flexibility of extending the experimental variables to additional levels as much as required while the results of some previously performed experimental conditions could be used for the new set of experiments. Three sets of such experiments are shown in and the corresponding data are given in . To evaluate the effect of the acid and heat treatments on the texture and color of the products, an iterative design was applied: first, a set of experimental parameters was selected, forming a hexagon of the Doehlert network, and if the final pH of the products did not fall within the desired range (between 4.6 and 5.0), a new set of experimental parameters was defined with higher or lower concentrations of acidulant, in order to progressively cover the experimental space. Analysis of variance was performed using the Statgraphics XV software (Statpoint Technologies, Warrenton, VA, USA), to understand the significant effects of acid concentration, heat treatment, and their interaction on the texture and color of thermally processed acidified green beans. Multiple regression models were also developed to obtain the best model for predicting the color and texture properties of the green beans as a function of the two independent parameters (acid concentration and lethality) and their interactions.
FIGURE 1 An example of three sets in a uniform shell experimental design to study green bean properties after processing. Independent variables are acidification, with eight levels, and lethality, with five levels.
RESULTS AND DISCUSSION
Textural Characteristics
shows the typical texture behaviour of green beans determined using a mini Kramer shear cell. Extrusion forces were measured continuously as the shear plates went through the samples for a given distance. Data was collected and compared for green beans before and after thermal treatment. Green beans that had been blanched only were considered controls or the starting materials for thermal treatment. For both the controls and thermally treated samples, EPF, and EMF as well as WBP and WAP (area under the curve) were calculated. As shows, the force-distance profile or texture profile for the thermally treated samples was always below that of the controls, which had been blanched only. The values of the measured forces for the thermally treated beans were almost half of those for the control samples owing to the softening of tissues during thermal processing.
FIGURE 2 Typical texture profile analysis (TPA) using mini Kramer shear tools: extrusion force measurements data before and after thermal treatment of green beans.
Non-Acidified Green Beans (Controls)
The characteristics of the starting materials (non-acidified blanched green beans, considered the control samples), including color and texture properties, are given in . The average values of EPF and EMF for the starting materials were evaluated as 458 ± 19 and 9 ± 5 N, respectively. For those samples, areas under the texture profile which are an indication of the energy used to crush the samples, were reported as 16 ± 3 and 13 ± 2 nm for WBP and WAP, respectively.
TABLE 2 Characteristics of starting material (blanched green beans) used as control
TABLE 3 Overall characteristics of green beans after thermal treatment (lethality of 2.5 min at 121.1 °C) without acidification
TABLE 4 Overall characteristics of green beans after combined acidification and thermal treatment using a) lactic acid (LA), b) glucono-delta-lactone (GDL), or c) fermented dextrose containing organic acid (PTX)
Thermally Treated Non-Acidified Green Beans
The overall characteristics of the non-acidified green beans that underwent thermal treatment equivalent to a total lethality of 2.5 min at 121.1°C (the minimum required F-value for non-acidified processed food to be considered commercially sterilized) are given in . The relative values of EPF (REPF) and WBP (RWBP) were 8.8 ± 3.1 and 9.6 ± 3.9%, respectively. That means thermally treated samples obtained only less than 10% of the initial EPF. Almost the same result was observed for RWBP (the work performed or energy used to crush the samples before peak), that is, about a 90% reduction in work (WBP) for the thermally treated samples as compared with the WBP values for the control samples. The pH value was just 0.2 higher following the thermal treatment, and no remarkable change in color specifications was observed.
Thermally Treated Acidified Green Beans
The overall values of the texture indices and color parameters of the thermally processed green beans following the acidification process using LA, GDL, or PTX acidulant (combined acidification and thermal processing) are reported in . The average values of pH change (ΔpH = pHtreated – pHcontrol) were always negative (–0.66 to –0.97) owing to the diffusion of acidulant to the beans during the acidification process, indicating that the pH values of the treated samples were less than that of control samples.
The percentages of peak force for the combined treatment with respect to the control are presented in in three-dimensional graphs as a function of process lethality achieved (F-value) and level of acid concentration using three different acidulants. shows that the texture of the green beans acidified using LA responded more positively (was firmer compared with the texture of the controls) as the concentration of LA increased from 0.004 to 3.5 g/kg. It also appears that the firmness of the thermally processed acidified green beans was not as sensitive to changes in PTX concentration (3.7–19.5 g/kg) and GDL concentration (0.9–4.6 g/kg) within the same range of experienced lethality (up to 2.75 min). The REPF values for the combination treated green bean samples were 19.85, 16.16, and 17.5% using LA, GDL, and PTX, respectively (). It is worth mentioning that these values were almost double that of the non-acidified samples (). In another words, the acidified samples could maintain their original texture better than the non-acidified samples following the thermal treatment. However, about 80% of the texture of the processed beans was still lost owing to the cooking effect as compared with the blanched samples (controls). The same behavior was observed with the other textural indices for the acidified and non-acidified samples. For instance, the values of RWBP were 21.52, 17.27, and 18.59% for the acidified samples using LA, GDL, and PTX, respectively (). However, the RWBP value was only 9.6% for the sample that had been thermally treated without acidification ().
FIGURE 3 Texture of green beans demonstrated as peak force losses versus lethality and acid concentration following thermal and acidification treatment using three acidulants: lactic acid (LA), glucono-delta-lactone (GDL), or fermented dextrose containing organic acids (PTX).
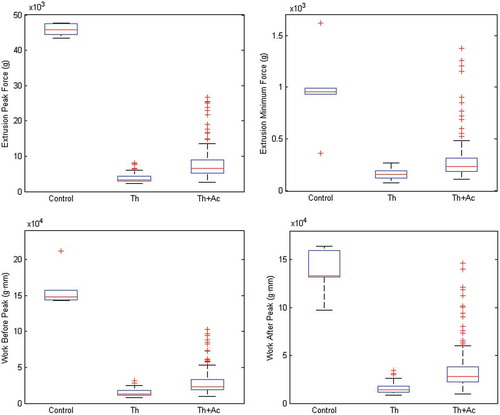
The overall relative values of the four measured texture parameters (REPF, REMF, RWBP, and RWAP) regardless of the acidulant used are shown in for comparison purposes. The values obtained for all four of the textural parameters were higher for the control samples than for the treated samples. It can be concluded that the control samples were firmer than the treated samples were; this was to be expected as the result of tissue softening tissues during thermal treatment. Variations in these values were relatively high for the thermally treated acidified samples, probably owing to the effect of the different acidulant and concentration levels. The overall values of the texture properties of the thermally treated acidified samples were slightly better than those of the non-acidified but thermally treated samples.
FIGURE 4 Overall comparison of the texture parameters of blanched green beans (Control), thermally treated green beans (Th), and green beans subjected to both thermal treatment and acidification (Th+Ac).
These results are in agreement with those of Azizi and Ranganna,[Citation10] who showed that the texture of canned acidified (pH ≤ 4.0) vegetables (cabbage, carrots, French green beans, and peas) that had been thermally treated at 97°C was superior to that of canned non-acidified vegetables; those researchers declared that the texture of acidified canned vegetables resembled more closely that of fresh products. In the present study, however, the processed products cannot be considered acidified foods as the pH was always greater than 4.6 and the processing temperature was 121.1°C. Stanley et al.[Citation19] showed that the firmness of processed vegetables, including green beans, follows a non-linear function while the pH values changes from 4 to 7; the firmness of green beans in their study increased as the pH decreased from 7 to 5, and an opposite trend was observed as the pH dropped to 4. Those researchers have concluded that increasing acid levels were associated with firmer tissues in cooked samples. It is worth mentioning that they used a blanching temperature of 65°C and also added calcium to the brine. Rodrigo et al.[Citation7] evaluated the effect of GDL, citric acid, and ascorbic acid on some quality indices (color, texture, and taste) of canned mushrooms processed at high temperatures (116°C for 54 min and 126°C for 8 min). Those researchers showed that food appeared to have a more suitable texture and color processed at a higher temperature for a shorter time, and that GDL appeared to be a more suitable acidulant than citric acid, as GDL provided equal color and texture with a less acidic taste at the same pH levels.
Color
The values of the color characteristics (ΔL, Δa, and Δb) which were based on the differences with respect to the blanched control samples, were calculated and are presented in for the thermally treated non-acidified green beans and in for the thermally treated green beans acidified using three different acidulants (LA, GDL, and PTX). Several non-linear regression models were also developed to predict the color changes in green beans as a function of acid concentration and lethality. The coefficients of the influencing parameters for all models are given in . It was observed that the color tended to be whiter as the acid concentration increased. However, this effect was more notable using GDL and PTX than using LA. It was also realized through Δa analysis that the greenish color of the beans underwent the combined acidification and thermal processing decreases (negative values of Δa) as the acid concentration increased, no matter which acid was used. Again, this parameter was more sensitive to the concentration of acid than to the thermal treatment. Analysis of Δb values showed that the combined effects of acid and heat tended to make the color of the processed beans more yellowish with LA and PTX but not with GDL.
TABLE 5 Coefficients of the significant parameters in the regression models developed for color and texture quality indices of thermally processed green beans acidified using three different acidulants
Color degradation of processed vegetables depends on the time-temperature profile and the level of acid concentration in the brine. Tijskens et al.[Citation20] investigated the loss of color during low temperature heat treatment (blanching process only without acidification) of green beans and found that the ratio of a/b increased initially but decreased later on as the treatment progressed. According to those researchers, the formation and degradation of visible color in vegetables is governed by processes related to coloring compounds such as chlorophyll and chlorophyllides. Changes in color have been associated with the change of green color to yellow owing to the conversion of chlorophyll to pheophytin and further to pyropheophytin.[Citation21]
shows a comparison of color values between the blanched green bean samples (controls), the thermally treated samples, and the samples that underwent the combined acidification and thermal treatment. As the three panels of this figure show, the error bars are generally large, owing to the nature of the variation in color measurements in biological materials. In terms of whitening, the acidification process could recover part of the brightness lost owing to the heat; however, both the thermal treatment and the combined treatments notably affected the greenness (a-values) and yellowness (b-values) of the processed beans as compared with the blanched controls.
FIGURE 5 Comparison of colour indices (L, a, and b) for blanched green beans (Control), thermally treated green beans (Thermal only), and green beans subjected to both thermal treatment and acidification (Thermal + Acid).
Statistical Analysis and Modelling
Statistical analyses of variances concerning the significant effects of acid concentration and lethality and their quadratic effect as well as the interaction effect of these two parameters are presented in . This table also includes the mean values and coefficients of the significant parameters in the regression models developed for the prediction of the color and texture indices following the multi regression procedure. The data indicated that overall, the texture indices were affected more by lethality, whereas the color characteristics were affected more by acid concentration. As shows, acid concentration had a significant effect (p < 0.05) and in some cases a highly significant effect (p < 0.001) on the ΔL, Δa, and Δb values no matter LA, GDL, or PTX was used. However, lethality and its quadratic effect always had highly significant effect (p < 0.001) on the minimum or maximum extrusion forces at peak (EMF and EPF) as the main texture indices of the processed beans.
In order to develop mathematical models to predict the color and texture of the green beans following the combined acidification and thermal treatment, regression analysis considering the significant influencing parameters was performed, as indicated in . Several regression models were developed including the linear and quadratic effect of acid concentration and lethality as well as their interaction effect. The general form of the equation is as follows:
where ϕ is either the color or texture index, C is the acid concentration in mass ratio (g/kg), F is the desired lethality in minutes, and β0 to β5 are the coefficients of the significant factors in the models. The details of the models characteristics are given in . These models are unique in their own right and can be used to predict quality changes in terms of firmness and/or color following thermal processing in gently acidified (4.6 < pH < 5.0) fresh green beans. It is worth mentioning that the presented models are applicable for the type of acid used (LA, GDL, and PTX), the ranges of given acidulant concentration and the lethality achieved in the present study. Three-dimension plots help seeing the simultaneous changes in the quality parameters as a function of acid concentration and lethality; examples are shown in for the peak force prediction. Because of the nature of agricultural product, large variations in color, and texture data were observed, and that is why the values of RCitation2 are relatively low, especially for the color indices. These values are slightly higher for the texture properties. Considering other sources of variation such as green beans variety (with a separate analysis for each variety), could possibly improve the correlation.
CONCLUSIONS
Mild acidification (4.6 < pH <5.0) along with mild thermal treatment, known as hurdle technology, could be considered a potential alternative preservation technique for future use in the processing of canned vegetables once proof has been obtained through microbiological verification. If successful, this approach can reduce the considerable amount of energy used in the canning industry and improve the quality of processed low-acid vegetables. Some sectors of the European and North American food industry have already shown interest, and are raising the application of hurdle technology with process authorities and regulatory administrations. However, it is not easy task to appropriately plan the vegetable acidification process to ensure a sufficient safety margin without degrading product quality. Several aspects have to be taken into account, such as the type and level of the acidulant used, the required lethality for safety considerations, and organoleptic and quality effects on the final product. The results provide clear evidence that lethality is the main processing factor affecting the texture of green beans and that the color of processed green beans is closely related to acid concentration. Product variability, as in the case of natural biological materials, is one of the main challenges in modelling work.
FUNDING
This project was supported by the Matching Investment Initiative program of Agriculture and Agri-Food Canada in collaboration with Bonduelle North America.
REFERENCES
- Featherstone, S. A review of development in and challenges of thermal processing over the past 200 years: A tribute to Nicolas Appert. Food Research International 2012, 47 (2), 156–160.
- Abou-Fadel, O.S.; Miller, L.T. Vitamin retention, color, and texture in thermally processed green beans and Royal Ann cherries packed in pouches and cans. Journal of Food Science 1983, 48 (3), 920–923.
- Rao, M.A.; Lee, C.V.; Cooley, H.J. Loss of color and firmness during thermal processing of canned snap beans. Journal of Food Quality 1985, 8 (1), 39–44.
- Abbatemarco, C.; Ramaswamy, H.S. End-over-end thermal processing of canned vegetables: Effect on texture and color. Food Research International 1994, 27 (4), 327–334.
- Smout, C.; Banadda, N.E.; Van Loey, A.M.; Hendricckx, M.E.G. Nonuniformity in lethality and quality in thermal process optimization: A case study on color degradation of green peas. Journal of Food Science 2003, 68 (2), 545–550.
- Banga, J.R.; Balsa-Canto, E.; Moles, C.G.; Alonso, A.A. Improving food processing using modern optimization methods. Trends in Food Science and Technology 2003, 14 (4), 131–144.
- Rodrigo, M.; Calvo, C.; Sanchez, T.; Rodrigo, C.; Martinez, A. Quality of canned mushrooms acidified with glucono-delta-lactone. International Journal of Food Science and Technology 1999, 34 (2), 161–166.
- Anantheswaran, R.C.; Sastry, S.K.; Beelman, R.B.; Okereke, A.; Konanayakam, M. Effect of processing on yield, color, and texture of canned mushrooms. Journal of Food Science 1986, 51 (5), 1197–1200.
- Palop, A.; Martines Lopez, A. pH-Assisted Thermal Processing. In Thermal Food Processing: New Technologies and Quality Issues; Sun, D.-W., Ed.; Taylor and Francis Group and CRC Press: Boca Raton, FL, 2012; 611–633.
- Azizi, A.; Ranganna, S. Thermal processing of acidified vegetables. Journal of Food Science and Technology 1993, 30 (6), 422–428.
- Reineke, K.; Mathys, A.; Knorr, D. Shift of pH-value during thermal treatments in buffer solutions and selected foods. International Journal of Food Properties 2011, 14 (4), 870–881.
- Avila, I.M.L.B.; Martins, R.C.; Ho, P.; Hendrickx, M.; Silva, C.L.M. Variability in quality of white and green beans during in-pack sterilization. Journal of Food Engineering 2006, 73 (2), 149–156.
- Taherian, A.R.; Ramaswamy, H.S. Kinetic considerations of texture softening in heat treated root vegetables. International Journal of Food Properties 2009, 12 (1), 114–128.
- Tola, Y.B.; Ramaswamy, H.S. Evaluation of high pressure treatment for rapid and uniform pH reduction in carrots. Journal of Food Engineering 2013, 116 (4), 900–909.
- Derossi, A.; Fiore, A.G.; De Pilli, T.; Severini, C. A review on acidifying treatments for vegetable canned food. Critical Review in Food Science and Nutrition 2011, 51 (10), 955–964.
- Andres-Bello, A.; Barreto-Palacios, V.; Garcia-Segovia, P.; Mir-Bel, J.; Martinez-Monzo, J. Effect of pH on color and texture of food products. Food Engineering Reviews 2013, 5 (3), 158–170.
- Stumbo, C.R. Thermobacteriology in Food Processing, 2nd Ed; Academic Press: New York, 1973.
- Doehlert, D.H. Uniform shell designs. Applied Statistics 1970, 19 (3), 231–239.
- Stanley, D.W.; Bourne, M.C.; Stone, A.P.; Wismer, W.V. Low temperature blanching effects on chemistry, firmness, and structure of canned green beans and carrots. Journal of Food Science 1995, 60 (2), 327–333.
- Tijskens, L.M.M.; Schijvens, E.P.H.M.; Biekmann, E.S.A. Modelling the change in color of broccoli and green beans during blanching. Innovative Food Science and Emerging Technologies 2001, 2 (4), 303–313.
- Ahmed, J.; Shivhare, U.S. Thermal Processing of Vegetables. In Thermal Food Processing: New Technologies and Quality Issues; Sun, D.-W., Ed.; Taylor and Francis Group and CRC Press: Boca Raton, FL, 2012; 383–412.