
Abstract
Fish bone is a good source of gelatin. In this study, gelatins were prepared from tilapia bone after the bone was pretreated with alkali protease, desalted immediately by 0.6 mol L−1 HCl, and hydrolyzed by papain or limed by Ca(OH)2. Gelatins extracted from papain-treated tilapia bone exhibited space structures similar to those of alkali-treated tilapia bone. Despite this similarity, many differences were observed between these gelatin samples. Compared with alkali-treated gelatin, papain-treated gelatins showed higher values for imino residue content, molecular weight proportion, bloom strength, and viscosity. The bloom strengths of the second and third papain-treated gelatins were 163 and 94 bloom, respectively, which were lower than the bloom strength of the first papain-treated gelatin (189 bloom). The viscosities of the three papain-treated gelatin samples were 4.18, 2.81, and 0.51 mPa.s−1. The first papain-treated gelatin achieved the highest gelling (16 °C) and melting points (23.9 °C). The yields of the first (5.40%) and second (6.71%) papain-treated gelatins were higher than those of the alkali-treated gelatins (3.33 and 5.76%, respectively). However, the yield of the third papain-treated gelatin (2.27%) was lower than that of the third alkali-treated gelatin (5.42%). More importantly, papain hydrolysis can prevent destruction by Ca(OH)2 in the bone structure and effectively reduce the denaturation temperature of tilapia bone collagen. Moreover, papain hydrolysis can dramatically reduce the time required for liming (0.8% of traditional liming process spent). Papain hydrolysis is a clean production method that can replace traditional liming.
INTRODUCTION
Gelatin is widely used in various industries, such as food products, material science, pharmaceuticals, and photography. In particular, gelatin is used in food and pharmaceutical products for its unique chemical and physical properties.[Citation1] Gelatin is typically extracted from porcine or bovine bones and skins. Fish gelatin has been recently extracted from black tilapia (Oreochromis mossambicus), red tilapia (Oreochromis nilotica),[Citation1] cod (Gadus morhua),[Citation2] bigeye snapper (Priacanthus tayenus),[Citation3] and grass carp fish (Ctenopharyngodon idella).[Citation4] Religious requirements and outbreaks of sanitation problems, such as bovine spongiform encephalopathy,[Citation5] have contributed to the recent increase in the demand for fish gelatin. Tilapia has a potential for application in farming because it can provide more and cheaper protein. Tilapia has recently ranked as the second most important group of farm-raised fish worldwide. China has since become the largest tilapia producer in the world. In 2010, tilapia production in China constituted about 55% of three million tons of tilapia produced worldwide. In China, tilapia meat is sliced for export to North America and Europe. Although the waste generated from the process was used initially, large numbers of fish heads and bone frames are disposed annually. The fish bones could be used as a source of gelatin.
During bone gelatin extraction, raw bones are usually pretreated with alkali to produce adequate swelling and cleavage of non-covalent intra- and inter-molecular bonds. Collagen extracted with warm water easily transforms to gelatin. These processes may require several weeks to complete and can pollute the environment. Therefore, more suitable alternatives to alkali are needed. Compared with traditional liming, proteases can more rapidly break the covalent cross-links in the telopeptide regions without pollution. Pepsin, alcalase, and flavorzyme have been used in liming several fish gelatin extractions.[Citation6,Citation7] To identify a more effective liming method, tilapia bone was treated with protease and Ca(OH)2 in this study. Gelatins were then extracted, and the physicochemical and functional properties of these gelatins were compared.
MATERIALS AND METHODS
Materials and Pretreatment
Tilapia bone frames from filleting were provided by Guangxi Nanning Baiyang Food Co., Ltd. (Guangxi Zhuang Autonomous Region) and stored at –20°C. The bone frames were allowed to thaw at room temperature prior to use. Meat in tilapia bone frames was removed by hydrolyzation with the use of alkali protease (Genencor Bio-Products Co., Ltd., Wuxi, China) in water at pH 10.0. Approximately 1000 g of tilapia bone frames was incubated with 20,000 U of alkali protease at 45°C for 5 h in a 1500 mL reaction volume and agitated at 120 rpm.
Desalination
After filtration, the bones were washed by tap water and dried at room temperature. The dried bones were treated with 0.6 mol L−1 HCl for 7.5 h at 20°C and 70 rpm. The bone-to-acid solution ratio was about 1:5 (w/v), and the acid solution was replaced at 1.5 h intervals.
Enzyme Treatment
After the removal of the acid solution, the bones were washed with distilled water until a pH of 5.3 was reached. The bones were subsequently treated with papain (Sinopharm Chemical Reagent Co., Ltd) at 46°C, for 72 min, with 3:1 mL g−1 (the proportion of liquid to solid) and 2500 μg−1 of tilapia bones. Enzymatic hydrolysis process had been optimized with the gel strengh as the index in pre-experiment to aviod excess hydrolysis.
The remaining desalinated bones were washed with 0.1 mol L−1 NaOH until the pH range of 10 to 11 was reached. The bones were subsequently treated with 9 g/L of Ca(OH)2 for 144 h and then agitated at 130 rpm. Some uncrushed opercular of tilapia were desalinated using the previously mentioned methods to compare the surface and microstructure.
Scanning Electron Microscopy (SEM)
The papain-treated (PT), alkali-treated (AT), and untreated tilapia operculars were air-dried at room temperature. Then all samples were coated with gold using a sputter coater (BAL-TEC, SCD 005; Witten, Germany) prior to observation. SEM micrographs for each specimen were obtained using a SEM (QUANTA-200, FEI).
Differential Scanning Calorimetry (DSC)
The thermal stability of the bone samples were determined via DSC using Perkin-Elmer Pyris 1 DSC instrument. Samples were hermetically encapsulated in aluminum pans and heated from room temperature to 200°C with a heating rate of 20°C min−1.
Extraction of the Gelatin
The PT tilapia bone gelatin samples were extracted in three sequential steps. The first bone gelatin was extracted at a bone-to-water ratio of 1:7 (w/v) at 60°C for 2 h in a solution with a pH of 4.0. The second and the third gelatin samples were extracted at a bone-to-water ratio of 1:5 (w/v) at 80°C with a pH of 5.5 for 3.5 h and at 90°C with a pH of 5.0 for 2 h, respectively. The extracted solution was centrifuged at 4000 rpm min−1 for 10 min and then filtered through four layers of gauze. The filtrate was subsequently concentrated with a rotary evaporator at 50°C, and the remainder of the concentrated solution was freeze-dried. The AT bone gelatin samples were extracted at the same ratio of 1:4 (w/v). The first, second, and third gelatin samples were under the following conditions: 75°C, pH 4.0, 4 h; 82°C, pH 5.5, 2 h; and 90°C, pH 5.0, 3 h, respectively.
Calculation of the Gelatin Yield
Yield (%) was calculated by following equation:
Where m is weight of dry gelatin (g), W is weight of bone used (g).
Determination of the Isoionic Point (pI)
The pI was determined by measuring the transparency of 20 g L−1 of gelatin solution at varying pH at 660 nm by using a UV-2100 spectrophotometer (UNICO Instruments Co., Ltd., Shanghai, China). The pH at which the solution achieved the lowest transparency was regarded as the pI value of the gelatin.[Citation4]
Determination of Bloom Strength
The gel strength was determined by using a 66.7 g L−1 gel, prepared by mixing the dry bone gelatin and chilled distilled water in a 150 mL bloom jar. The mixture was kept at 10°C for 60 min and then transferred to a water bath maintained at 45°C for 30 min.[Citation8] The bone gelatin solution was matured at 10°C for 17 h in a refrigerator. The gel strength tests were then conducted using a TA-XT2i texture analyzer (Stable Microsystems, UK) with a 5 kN load cell, equipped with a 0.5 cm diameter probe. Gel strength is the maximum force (g) required for the probe to press the gel by 4 mm at a rate of 0.5 mm s−1.[Citation9]
Determination of Viscosity
The viscosities of the gelatin samples were determined at 60°C by using Ubbelohde micro-viscometer containing 66.7 g L−1 gelatin water solution. The viscosity of the gelatin solutions in centipoises (cP) was calculated by using the instrument constant through the following equation:
Viscoelastic Properties
Dynamic studies were performed on AR1000 rheometer (TA Instruments-Waters LLC, New Castle, Delaware, USA) using cone-plate geometry (cone angle 2°). Dry gelatin samples and chilled distilled water were mixed for 60 min and then placed into a water bath held at 45°C. The tilapia bone gelatin solutions (66.7 g L−1 gel) were prepared by stirring the mixture for about 20 min. The viscosity measurement of gelatin solutions were performed at a scan rate of 1°C min−1, frequency of 1 Hz, oscillating applied stress of 3.0 Pa, and gap of 0.15 mm.[Citation5] During testing, the gelatin solutions were first cooled from 35 to 6°C, maintained at 6°C for 10 min, and then heated from 6 to 35°C. The phase angle (degree) was represented as a function of temperature.
Fourier Transform Infrared Spectroscopy (FTIR)
The gelatin samples were analyzed by using attenuated total reflectance FTIR. The spectra were obtained by using a Nicolet Nexus FTIR spectrometer (Thermo Electron Corporation, United States) with an absorption mode at 4 cm−1 intervals and scanning frequency of 16 times at the wave number region of 600 to 4000 cm−1.[Citation11]
Determination of Amino Acid Composition
The tilapia bone gelatin samples were hydrolyzed in 6 mol L−1 HCl at 110°C for 22 h, and the hydrolysates were analyzed by using an amino acid analyzer (HP1100, Agilent).
Sodium Dodecyl Sulfatepolyacrylamide Gel Electrophoresis (SDS-PAGE)
SDS-PAGE was performed as described by Laemmli[Citation12] by using 80 g L−1 of resolving gel and 50 g L−1 of stacking gel. The experimental samples (10 μL), standard sample (Channel catfish head bone gelatin which was prepared according to Liu, Han, and Guo[Citation13]), and molecular weight marker proteins (5 μL; Shanghai yuanye Bio-Technology Co., Ltd, China) were applied and subjected to electrophoresis. After electrophoresis, the gel was stained with Coomassie Brilliant Blue R-250.
RESULTS AND DISCUSSION
Appearance and Microstructure of PT and AT
The appearance of tilapia bones treated with papain and Ca(OH)2 were recorded by a Canon G12 camera. As shown in , PTs were smooth and translucent in contrast to AT, which were white and opaque. represented SEM micrographs of the surface morphology and microstructure of tilapia treated with papain and Ca(OH)2. The desalinated opercular showed a polyporous section (. ) and a considerably rough surface with huge cracks and holes (. ). By contrast, the liming opercular had a scaly, broken surface (. ) and a bumpy section with several tiny pores (. ). These results might be attributed to the volume expansion of the bone, in which collagen swelled in alkaline solution. In contrast to intact opercular bone, the opercular treated with papain showed relative smooth surface (. ) and section (. C2). Greater damage was observed in Ca(OH)2-treated opercular bones than in papain-hydrolyzed opercular bones. Papain hydrolysis was not destroyed by Ca(OH)2 in the bone structure, such that collagen was less degraded.
FIGURE 1 The appearance of dried tilapia bones treated with papain and Ca(OH)2. Bones in the row above were tilapia bones treated with papain; Bones in the row below were tilapia bones treated with Ca(OH)2.
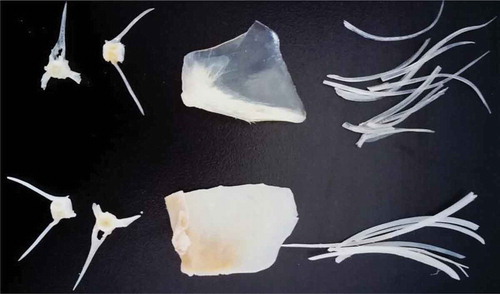
FIGURE 2 SEM micrographs of the surface morphology and microstructure of tilapia opercular which treated with papain and Ca(OH)2. (A1) surface of desalinated opercular; (A2) section of desalinated opercular; (B1) surface of desalinated opercular treated with Ca(OH)2; (B2) section of desalinated opercular treated with Ca(OH)2; (C1) surface of desalinated opercular treated with papain; (C2) section of desalinated opercular treated with papain.
DSC Measurement of PT and AT
The thermal stability of PT and AT was determined by the DSC. As shown in , DSC curves showed denaturation transitions peaks (B: an endothermic peak) and small endothermic peaks (A: water evaporation peak). The DSC peak B at about 180°C was the result of thermal denaturation of collagen, which is the main component of bone protein matrix.[Citation14] The denaturation temperature of samples was attributed to a helix-to-coil transition of collagen.[Citation15] The low denaturation temperature facilitated the extraction of gelatin. PT has lower denaturation temperature (152°C) than those of intact (176°C) and AT (174°C) samples. Gelatin, therefore, can be extracted from PT at lower temperature with higher yield.
FIGURE 3 DSC thermograms of tilapia bones treated with papain and Ca(OH)2.
Characteristics of Gelatin
Molecular Weight Distribution
The gelatin samples extracted from the tilapia bone were analyzed by SDS-PAGE. showed that first and second PT, and first AT gelatins existed as trimers consisting of two distinct α chains (α1 and α2), which were similar to the typical triple-helix structure of channel catfish head gelatin with two distinct α chains. However, obvious decreases in α-band intensities were observed in the electrophoresis patterns of the third PT, second AT, and particularly third AT gelatins.
FIGURE 4 The SDS-PAGE patterns of PT and AT gelatin. Lane 1: first PT gelatin; Lane 2: second PT gelatin; Lane 3: third PT gelatin; Lane 4: standard protein; Lane 5: first AT gelatin; Lane 6: second AT gelatin; Lane 7: third AT gelatin; Lane 8: first channel catfish head bone gelatin. Molecular weights from top to bottom in the standard protein are 97,400, 66,200, 43,000, 31,000, and 20,000Da, respectively.
FTIR
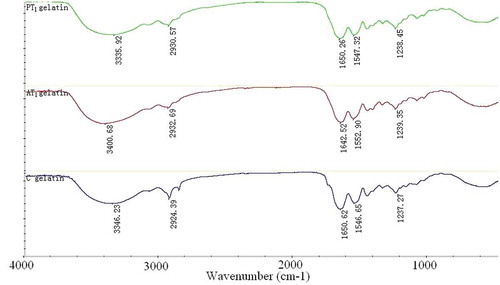
FTIR was applied to analyze the difference between the first PT and AT gelatins. Results for PT gelatin samples were similar to those of AT (). The amide A band position was found near 3330 cm−1, which was attributed to the hydrogen-bonded hydroxyl groups.[Citation16,Citation17] Amide B band was found near 2930 cm−1, where the amide B band of collagen often appeared. The spectrum of the gelatin dispersions also demonstrated the characteristic pattern reflecting the amide I band at 1650 cm−1, amide II band at 1550 cm−1, and amide III band at 1237 cm−1. The amide I band was associated with the coil structure characteristic of gelatin[Citation18,Citation19] and the amide III band demonstrated the existence of a helical structure.[Citation20] Therefore, the FTIR investigations indicated the existence of helical arrangements of the first AT and PT gelatins.
FIGURE 5 Fourier transform infrared spectrum of AT1 (first AT gelatin), PT1 (first PT gelatin), and porcine skin gelatin.
Amino Acid Composition
presented the amino compositions of the PT and AT gelatins. Methionine, histidine, and tyrosine contents were low in all gelatin samples. Glycine was the most abundant amino acid in the gelatin samples of tilapia bone, as well as those in the gelatin of Dover sole (Solea vulgaris), cod (Gadus morhua), hake (Merluccius merluccius, L.), and squid (Dosidicus gigas).[Citation21] Proline contents in PT gelatins were lower than those of AT gelatins. This difference could be related to the variation in the bone pretreatment methods. A similar result was found in the study by Zied et al.[Citation22] Repeated structure of Gly-Pro-Y in gelatin was observed.[Citation23] The gelatin structure was stable when hydroxyproline is located in the Y position.[Citation24] As shown in , the amount of hydroxyproline in the first PT gelatin was 68 residues per 1000 which was the highest among the PT and AT gelatin samples but significantly lower than porcine skin gelatin. Thus, the degree of cross-linking was higher in the first PT gelatin than in the second PT gelatin but lower in porcine skin gelatin. The thermal stability of collagens and their derivatives, including gelatin, were also affected by the amount of hydroxyproline.[Citation25]
TABLE 1 Mean amino acid compositions for PT and AT (residues/1000)
Gel Strength
The PT gelatin samples showed higher gel strength than the AT gelatin samples (). Moreover, the three PT gelatins exhibited different gel strengths. The highest gel strength (189 bloom) was achieved by the first gelatin sample. The gel strength of the second gelatin was 163 bloom, which was higher than the third gelatin sample (94 bloom). The gel strengths of the AT gelatin samples were 140, 116, and 46 bloom. The difference in gel strength can be attributed to the different hydroxyproline contents and molecular weight distributions of the gelatin types.[Citation26] Higher hydroxyproline content, higher molecular weight proportions, and fewer degraded peptides were observed in the first gelatin. These factors can stabilize the gelatin and demonstrate higher gel strength. However, the corresponding interpretation method cannot sufficiently explain the phenomenon in gelatin extracted from the same material and by the same liming process. In this study, the total amount of imino residues of each AT gelatin was higher than that of each corresponding PT gelatin. This result was contrary to the trend in gel strength. Meanwhile, Shi et al.[Citation27] found a strong positive correlation between gel strength and the content of α-chains in gelatin. Gelatin, which contains more α-chains, would exhibit high gel strength. According to the result of SDS-PAGE, first and second PT, and first AT gelatin samples were found to contain more α component than the third PT and the second and third AT gelatin samples, thus verifying the results of gel strength.
FIGURE 6 Gel strengths of gelatins extracted from tilapia bone.
Gelatin Yield
Gelatin samples were extracted from PT and AT. As shown in , the second gelatin among the three PT gelatin samples obtained the highest yield. The yields of the three gelatin samples were 5.40, 6.71, and 2.27%. By contrast, the yield of the first AT gelatin sample (3.33%) was lower than those of the second (5.76%) and the third (5.42%) AT gelatin samples. Despite the slightly higher total yield of the AT gelatin samples (14.51%) than PT gelatin samples (14.38%), higher quality gelatin was produced by the PT process. In addition, papain treatment dramatically cuts down the time required for liming process. Papain treatment took 72 min, only 0.8% of traditional liming processing time (144 h).
FIGURE 7 Yields of gelatins extracted from tilapia bone.
PI Values
As shown in , the pI values of the AT gelatin samples (4.7, 4.7, and 4.5) were acidic. Alkali pretreated gelatin is a Type B gelatin with an isoelectric point of about five.[Citation28] The pI values decreased because the deamidation of asparagine and glutamine occurs during prolonged exposure of collagenous material to alkali.[Citation4] By contrast, the pI values of the three PT gelatin samples were almost neutral (6.8, 6.5, and 6.6), perhaps because of low degree of hydrolysis of collagen.
FIGURE 8 The pI values of the AT (A) and PT (B) gelatin.
Determination of Viscosity
As shown in , the PT gelatin samples exhibit higher viscosity than the corresponding AT gelatin samples. The PT gelatin viscosities were 4.18 (first), 2.81 (second), and 0.51 mPa.s−1 (third). The viscosity of the first AT gelatin (2.81 mPa.s−1) was the same as the second PT gelatin. The second and the third AT gelatin samples exhibited lower viscosity of 1.54 and 0.39 mPa.s−1, respectively.
FIGURE 9 Viscosities of gelatins extracted from tilapia bone.
Viscoelastic Properties of the PT Gelatin Samples
The viscoelastic properties of gelatin solutions (66.7 g L−1) were measured using cooling and heating programs. showed the modulus of elasticity (G’), modulus of viscosity (G”), and phase angle (rad) during both cooling (from 35 to 6°C) and heating (from 6 to 35°C). showed that all gelatin samples reflected dramatic increases in G’ when the temperature was decreased to 17°C during the cooling program. The porcine skin achieved the highest G’ at 6°C; meanwhile, the G’ of the second PT gelatin exceeded that of the first PT gelatin. The G” of all gelatin samples were increased sharply within a short period during the cooling process ( ). The G” of the second PT gelatin reached a high value and approached that of the porcine skin gelatin at 6°C. The G’ and G” of the first and the second PT gelatin samples increased after maturation at 6°C for 10 min ( and ), and the G” of the second PT gelatin exceeded that of the porcine skin gelatin ( ). The gelling and melting points can be evaluated from the sharp decrease and increase in phase angle[Citation5] (). The first, second, and third PT gelatin samples had gelling points of 16.0, 15.4, and 13.6°C, respectively, as well as melting points of 23.9, 22.3, and 20.7°C, respectively. The gelling and melting points of the PT gelatin were significantly lower than those of porcine gelatin. The degree of cross-linking was positively correlated with both gelling and melting points[Citation21] and was higher in the first PT gelatin sample than second and third PT gelatin samples but weaker than porcine skin gelatin. The results were consistent with amino acid composition analysis.
FIGURE 10 Evolution of viscoelastic properties during cooling from 35 to 6°C (1) and heating from 6 to 35°C (2) of 66.7 g L−1 gelatin solutions. (A) the elastic modulus (G’, Pa); (B) the viscosity modulus (G”, Pa); (C) the phase angle (rad).
CONCLUSION
Gelatin samples were prepared from tilapia bone using different liming methods, and the resulting gelatin samples were partially characterized. The results showed that Ca(OH)2 solution in traditional liming can be replaced by papain. Liming process using papain dramatically shortens the time which required only 72 min comparing to 144 h for traditional liming process time. Moreover, the denaturation temperature of collagen from PT tilapia bone decreased obviously compared to AT tilapia bone and intact sample. Gelatin samples extracted from PT tilapia bone exhibited structures similar to those from AT tilapia bone. However, many advantages of the PT tilapia bone gelatin samples, such as higher yield of the first gelatin, values for imino residue content, molecular weight proportion, bloom strength, and viscosity, were observed. Papain hydrolysis is in fact a clean production method that can replace traditional liming. In addition, the gelatin from tilapia bone can serve as a beneficial supplement to mammalian gelatin.
ACKNOWLEDGEMENTS
The authors gratefully acknowledge Dr Yaoqi Tian (The State Key Laboratory of Food Science and Technology [SKLF], Jiangnan University) for helping in the DSC experiments.
FUNDING
This study was supported by Fundamental Research Funds for the Central Universities with the research grant no. of JUSRP21010 and the Priority Academic Program Development of Jiangsu Higher Education Institutions (PAPD).
Additional information
Funding
Related Research Data
REFERENCES
- Jamilah, B.; Harvinder, K.G. Properties of gelatins from skins of fish-black tilapia (Oreochromis mossambicus) and red tilapia (Oreochromis nilotica). Food Chemistry 2002, 77, 81–84.
- Arnesen, J.A.; Gildberg, A. Extraction of muscle proteins and gelatine from cod head. Process Biochemistry 2006, 41, 697–700.
- Nalinanon, S.; Benjakul, S.; Visessanguan, W.; Kishimura, H. Improvement of gelatin extraction from bigeye snapper skin using pepsin-aided process in combination with protease inhibitor. Food Hydrocolloids 2008, 22, 615–622.
- Zhang, F.X.; Xu, S.Y.; Wang, Z. Pre-treatment optimization and properties of gelatin from freshwater fish scales. Food and Bioproducts Processing 2011, 89,185–193.
- Ferna´ndez-Dı´az, M.D.; Montero, P.; Go´mez-Guille´n, M.C. Effect of freezing fish skins on molecular and rheological properties of extracted gelatin. Food Hydrocolloids 2003, 17, 281–286.
- Jongjareonrak, A.; Benjakul, S.; Visessanguan, W.; Tanaka, M. Isolation and characterization of collagen from bigeye snapper (Priacanthus macracanthus) skin. Journal of the Science of Food and Agriculture 2005, 85, 1203–1210.
- Khiari, Z.; Rico, D.; Martin-Diana, A.B.; Barry-Ryan, C. Comparison between gelatines extracted from mackerel and blue whiting bones after different pre-treatments. Food Chemistry 2013, 139, 347–354.
- Muyonga, J.H.; Cole, C.G.B; Duodu, K.G. Extraction and physicochemical characterisation of Nile perch (Lates niloticus) skin and bone gelatin. Food Hydrocolloids 2004, 18, 581–592.
- BSI (British Standards Institution). Methods for sampling and testing gelatin (physical and chemical methods). London, United Kingdom: BSI 1975.
- Abrusci, C.; Marquina, D.; Santos, A.; Del Amo, A.; Corrales, T.; Catalina, F. A chemiluminescence study on degradation of gelatine biodegradation by bacteria and fungi isolated from cinematographic films. Journal of Photochemistry and Photobiology A: Chemistry 2007, 185, 188–197.
- Guerrero, P.; Stefani, P.M.; Ruseckaite, R.A.; Caba, K. Functional properties of films based on soy protein isolate and gelatin processed by compression molding. Journal of Food Engineering 2011, 105, 65–72.
- Laemmli, U.K. Cleavage of structural proteins during the assembly of the head of bacteriophage T4. Nature (London) 1970, 227, 680–685.
- Liu, H.Y.; Han, J.; Guo, S.D. Characteristics of the gelatin extracted from channel catfish (Ictalurus Punctatus) head bones. LWT-Food Science and Technology 2009, 2 (42), 540–544.
- Kubisz, L.; Mielcarek, S. Differential scanning calorimetry and temperature dependence of electric conductivity in studies on denaturation process of bone collagen. Journal of Non-Crystalline Solids 2005, 351 (33), 2935–2939.
- Sionkowska, A. Modification of collagen films by ultraviolet irradiation. Polymer Degradation and Stability 2000, 68, 147–151.
- Muyonga, J.H.; Cole, C.G.B.; Duodu, K.G. Fourier transform infrared (FTIR) spectroscopic study of acid soluble collagen and gelatin from skins and bones of young and adult Nile perch (Lates niloticus). Food Chemistry 2004, 86, 325–332.
- Liu, H.Y.; Jiao, Z.H.; Guo, S.D. Effect of epigallocatechin gallate on the properties of gelatin. International Journal of Food Properties 2014, 17 (10), 2119–2130.
- Yakimets, I.; Wellner, N.; Smith, A.C.;Wilson, R.H.; Farhat, I.; Mitchell, J. Mechanical properties with respect to water content of gelatin films in glassy state. Polymer 2005, 46, 12577–12585.
- Ademola, M.; Irwandi, J.; Hamzah, M.S.; Hassan, A.A. Effects of pretreatment on properties of gelatin from perch (Lates Niloticus) skin. International Journal of Food Properties 2014, 17 (6), 1224–1236.
- Surewicz, W.K.; Mantsch, H.H. New insight into protein secondary structure from resolution enhanced infrared spectra. Biochimica et Biophysica Acta (BBA)-Protein Structure and Molecular Enzymology 1988, 952, 115–130.
- Gómez-Guillén, M.C.; Turnay, J.; Fernández-Díaz, M.D.; Ulmo, N.; Lizarbe, M.A.; Montero, P. Structural and physical properties of gelatin extracted from different marine species: A comparative study. Food Hydrocolloids 2002, 16, 25–34.
- Zied, K.; Daniel, R.; Ana, B.M.D.; Catherine, B.R. Comparison between gelatines extracted from mackerel and blue whiting bones after different pre-treatments. Food Chemistry 2013, 139, 347–354.
- Ledward, D.A. Gelation of Gelatin. In Functional Properties of Food Macromolecules; Mitchell, J.R., Ledward, D.A., Eds.; Elsevier Applied Science Publishers: London, 1986; 77–201.
- Cho, S.M.; Kwak, K.S.; Park, D.C.; Gu, Y.S.; Ji, C.I.; Jang, D.H.; Lee,Y.B.; Kim, S.B. Processing optimization and functional properties of gelatin from shark (Isurus oxyrinchus) cartilage. Food Hydrocolloids 2004, 18, 573–579.
- Wasswa, J.; Tang, J.; Gu, X. Utilization of fish processing by-products in the gelatin industry. Food Reviews International 2007, 23, 159–174.
- Irwandi, J.; Faridayanti, S.; Mohamed, E.S.M.; Hamzah, M.S.; Torla, H.H.; Che Man, Y.B. Extraction and characterization of gelatin from different marine fish species in Malaysia. International Food Research Journal 2009, 16, 381–389.
- Shi, J.; Chen, L.; Wang, Y.; Peng, B. A study of the gel strength change of photogelatin in dependence on their content of a components. The Science and Technology of Gelatin 2002, 22 (1), 7–11.
- Eastoe, J.E.; Leach, A.A. Chemical Constitution of Gelatin. In The Science and Technology of Gelatin; Ward, A.G., Courts, A., Eds.; Academic Press: London, 1977; 77–85.