
Abstract
Volatiles of milk were characterized by solid-phase microextraction coupled with comprehensive two-dimensional gas chromatography and time-of-flight mass spectrometry. Comprehensive two-dimensional gas chromatography with time-of-flight mass spectrometry two-dimensional gas chromatography with time-of-flight mass spectrometry not only separated the 52 compounds that co-elute in conventional gas chromatography-mass spectrometry, but also identified 107 compounds that were first reported in milk. These volatiles included aliphatic hydrocarbons (69), aromatic hydrocarbons (42), ketones (28), esters (16), aldehydes (14), alcohols (14), acids (14), nitrogenous compounds (9), ethers (8), and sulfo compounds (3). Five dominant volatiles were hexanoic acid (193.57 ng/mL milk), methoxy-phenyl-oxime (114.83 ng/mL milk), octanoic acid (109.38 ng/mL milk), 4,5-dimethyl-1-hexene (101.48 ng/mL milk), and 2-Pentanone (99.74 ng/mL milk). This proposes an improvement methodology for determining the volatiles of dairy products.
INTRODUCTION
Milk flavor is one of the most important factors that determine the consumer acceptability and its shelf life. Fresh milk flavor is delicate and subtle and can be overshadowed by off-flavor, which reduce the sensory quality and economic value of dairy products.[Citation1,Citation2] The production of volatiles in milk is influenced by several factors: cow species, daily diets, environment, age, biological factors, processing, and storage conditions.[Citation3–Citation9] Some distinctive volatiles have been used to identify the freshness, deterioration, and predict shelf life of milk.[Citation10,Citation11] Therefore, the qualitative and quantitative measurements of such volatiles have attracted much interest in recent years.
A common analytical technique identifying volatiles in milk is gas chromatography-mass spectrometry (GC-MS) analysis. Twenty-four volatile organic compounds related to flavor were detected during milk fermentation by Lactobacillus pentosus using headspace solid-phase microextraction (HS-SPME)/GC-MS.[Citation9] A previous study showed that 37 volatiles including aldehydes, ketones, fatty acids, esters, alcohols, and aromatic compounds were identified in the headspace of milk samples by GC-MS.[Citation7] A total of 59 volatile components were determined by GC-MS in skim milk and non-standardized milk pasteurized at 80, 100, and 120°C.[Citation12] Chouliara et al. employed SPME-GC-MS to analyze non-sonicated pasteurized milk and 17 compounds were semi-quantified.[Citation6] Solano-Lopez et al. applied GC-MS to identify 16, 22, and 26 compounds in ultrapasteurized-polyethylene terephthalate (PET)-bottled milk samples stored for 1, 30, and 60 days, respectively.[Citation3] Perkins et al. detected 17 stale flavor volatiles in ultrahigh-temperature (UHT)-processed milk using SPME-GS-MS.[Citation13] Nineteen volatile organic compounds were isolated and identified using HS-SPME-GC-mass spectrometry/flame ionization detection (MS/FID) in milk tainted with off-flavor.[Citation14] Contarini et al. observed 11 volatile compounds in both whole and partially skimmed UHT milk using GC-MS.[Citation15]
However, GC-MS may not be sufficient to separate all the volatile components, because it could result in co-elutions of several components. Two-dimensional gas chromatography with time-of-flight mass spectrometric detection (GC×GC-TOFMS) is a suitable alternative for qualitative and quantitative analysis of complex matrices, such as food and beverage volatiles, due to its increased peak capacity, sensitivity, and selectivity.[Citation16–Citation19] Structurally organized distributions of different classes of compounds are another advantage of GC×GC-TOFMS, which assists the identification of unknown compounds.[Citation18] Orthogonal 2D separation of lavender essential oil led to a 25-fold increase in sensitivity and a 3-fold increase in the number of resolved components compared with GC-MS analysis.[Citation16]
The detailed profiling of volatiles from milk is informative, not only to classify and assess dairy products, but also to predict the shelf life of dairy products on the basis of sensory profiles (aroma, off-flavor, and taste).[Citation20] However, to the best of the authors’ knowledge, the volatiles of milk and other dairy products have not yet been studied using GC×GC-TOFMS. Thus, the aim of this work was to develop a methodology based on HS-SPME coupled with GC×GC-TOFMS to obtain a qualitative and quantitative characterization of the total volatile components of milk. One-dimensional GC-MS detection was also used as a comparative method.
MATERIALS AND METHODS
Materials
Fresh raw milk (3.4% fat), collected from the Jinshan dairy farm (Shanghai, China), was centrifuged to at 4000 g for 30 min to remove the fat and leucocytes. After centrifugation, the skim milk (less than 0.1% fat) was microfiltrated through ceramic membranes (Tami, France; nominal pore size:1.4 μm; total membrane surface area:13.3 m2; flow rate: 5t·h–1; inlet pressure: 2.5 bar) at 50°C. The separated cream stream (35% fat) of the fresh milk was heated at 120°C for 4 s and then mixed with the permeate of microfiltration to the fat-adjusted whole milk (3.4% fat). Then the mixture was homogenized (150/50 bar) at 65°C and pasteurized at 72°C for 15 s, and cooled to 4°C and then filled to give a stable product for volatiles analysis. All of the volatile standards used for identification and other reagents were of GC-analytical grade and were obtained from Sigma-Aldrich. All other chemicals were purchased from Sinopharm Chemical Reagent Co., Ltd, China.
Solid Phase Microextraction
Milk volatiles were collected by SPME technique in an auto sampler (GC Sampler 80, Agilent, Santa Clara, CA, USA), following the previous method[Citation7] with some modifications. A milk sample of 10 mL, 2 μL of the internal standard solution (0.1 mg.mL−1 2,4,6-trimethylpyridine in methyl alcohol) and 3.7 g of sodium chloride were placed in an annealed 20-mL brown glass vial with screw cap. The SPME fiber used was 50/30 μm DVB/CAR on PDMS (Supelco, Bellefonte, PA, USA). The mixtures were incubated at 50°C for 20 min with 500 rpm vibration and the SPME fiber was exposed to the headspace above the milk sample for 30 min at 50°C with 250 rpm vibration to allow adsorption of volatiles. After extraction the volatile compounds were desorbed from the fiber coating by inserting the fiber into the GC injector for analysis.
GC-MS Analysis
Headspace of the volatile compounds was analyzed using a 7890A gas chromatograph coupled with a 5975C mass spectrometer (Agilent Technologies, Palo Alto, CA, USA). A DB-5MS column (30 m × 0.25 mm i.d., 0.25 µm df) from Agilent was used to separate the compounds. The injector port was heated to 260°C and injections (1 μL) were performed in splitless mode. Helium (purity >99.999%) was used as the carrier gas at a constant flow of 1 mL min–1. The column temperature was held at 40°C for 5 min, increased to 220°C at 5°C min–1, and then to 250°C at 20°C min–1 and held for 7.5 min until the end of the program. The temperatures of the ion source and interface were maintained at 230 and 280°C, respectively. Electron impact ionization mass spectra were recorded with an ionization energy of 70 eV and an EM voltage of 1847 V. Mass spectra were scanned from 20 to 350 amu in total ion chromatogram (TIC) mode to identify the compounds based on the Saturn spectra reported on the National Institute of Standards and Technology (NIST) 2011 Mass Spectral Library (MainLib: 212,961 spectra and Replib: 30,932 spectra). Main, molecular, and qualifier ions were selected for each compound identified. Relative retention times of detected compounds were also determined by injecting 20 μL of 0.1 mg.mL–1 n-alkane standard solutions (ASTM D2887-01 Calibration Mix, Restek, Pennsylvania, USA) with a split ratio of 1:200. Signals were processed using Agilent MSD Productivity ChemStation Enhanced Data Analysis software (Agilent, Santa Clara, CA, USA).
GC×GC-TOFMS Analysis
The GC×GC-TOFMS system used was a gas chromatograph 6890N Agilent (Agilent Technologies) with a LECO Pegasus 4D TOFMS system (St. Joseph, MI, USA). The first dimensional chromatographic separation column was a DB-5MS (30 m × 0.25 mm i.d., 0.25 µm df). The second dimension column was DB-17HT (2 m × 0.1 mm i.d., 0.15 μM df). Highly purified helium (99.999%) was selected as the carrier gas, with a flow rate of 1.0 mL min–1. Samples were incubated at 50°C for 20 min and the fiber was exposed to the vial head space during 30 min at 50°C. The adsorbed volatiles were desorbed in the GC×GC injector port in splitless mode at 260°C for 1 min. All samples (1 µL) were introduced into the GC×GC inlet system by an auto sampler using splitless mode injection at 260°C. The primary oven temperature program was initially set at 40°C for 5 min, increased to 220°C at a rate of 5°C.min–1, further increased to 250°C at a rate of 20°C min–1 and maintained for 7.5 min. The secondary oven temperature was 5°C higher than the primary one. The modulator temperature was 15°C higher than the second oven temperature, and the modulation period was 4 s. The TOFMS was operated in the electronic impact ionization mode at 70 eV at an acquisition rate of 100 spectra s–1 and a mass range of m/z 20–350 amu in TIC mode. The ion source temperature was 220°C, the interface temperature was 270°C, and the detector was operated at 1700 V. Mass spectral library matching was carried out by using an NIST Mass Spectral Library (MainLib: 212,961 spectra and Replib: 30,932 spectra).
Data Acquisition and Quantification
In this study, the data were processed by ChromaTOF software (version 4.4, Leco, St. Joseph, MI, USA). Matching its deconvoluted mass spectra with the NIST Mass Spectral Library (MainLib: 212,961 spectra and Replib: 30,932 spectra) identified each individual peak. Only peaks with a mass spectral match factor (similarity) higher than 800 were regarded as correctly identified and retained for further grouping and analysis. Similarity ranging from 850 to 969 and the quality of the mass spectrum of each compound were manually inspected. The linear retention indices (RIs) in the GC-MS and first dimension of GC×GC-TOFMS were calculated by interpolation of the retention times of a C7-C40 n-alkanes series under the same chromatographic conditions, by the ChromaTOF software system. The calculated RIs were compared with those in the NIST Mass Search 2.0 and other references.[Citation10,Citation21–Citation25]
RESULTS AND DISCUSSION
SPME-GC-MS Analysis
The volatile profile of milk obtained by SPME-GC-MS is shown in and . In total, 52 identified compounds were organized in following chemical groups: aliphatic hydrocarbons, alcohols, aldehydes, ketones, acids, esters, aromatic hydrocarbons, nitrogenous compounds, ethers, and sulfo compounds. Both the acids (11) and aromatic hydrocarbons (11) were the predominant groups among the identified components. The top four acid compounds were octanoic acid (66.94 ng/mL milk), hexanoic acid (47.67 ng/mL milk), n-Decanoic acid (42.56 ng/mL milk), and butanoic acid (11.17 ng/mL milk), and the top four aromatic hydrocarbons were toluene (10.54 ng/mL milk), phenol (9.34 ng/mL milk), ethylbenzene (5.15 ng/mL milk), and styrene (2.82 ng/mL milk; ).
TABLE 1 Milk volatile compounds identified using GC×GC-TOF MS and GC-MS
TABLE 2 Number and quantitative results of volatile compounds in squid samples by GC-MS and GC×GC-TOF MS analysis
Acids are derived from lipolysis, degradation of lactose and amino acids, which are responsible for perceptible rancid flavor in milk.[Citation8,Citation20,Citation26,Citation27] In the milk, carboxylic acids are not only crucial aroma themselves, but also are important precursors of other compounds, including methyl ketones, alcohols, aldehydes, and esters.[Citation28] Acetic acid, butanoic acid, hexanoic acid, and octanoic acid were also found in 2% butterfat milk.[Citation29] In addition, decenoic acid, tetradecanoic acid, hexadecanoic acid, oleic acid, and lauric acid were reported mainly the acid compounds in pulsed electric field treated milk.[Citation7] Similarly, aromatic hydrocarbons have also been widely identified in milk.[Citation11,Citation13,Citation15] For example benzene, toluene, ethylbenzene, and indene have been found by Wang et al. in reconstituted milk and reduced-fat cheese.[Citation8] Bendall suggested that phenol compounds impart woody, smoky, and burnt aromas to milk and have been considered as the agents responsible for the smell of cow urine.[Citation10] Some of the aromatic compounds are derived from the Strecker reaction, e.g., α-oxidation of phenyl acetaldehyde is responsible for benzaldehyde production that imparts aromatic notes of bitter almond to dairy products.[Citation20]
Following the predominant groups are ketones, aliphatic hydrocarbons, and esters, in number of compounds. Among the ten identified ketone components, the top four compounds were acetone (87.44 ng/mL milk), 2-Butanone (32.55 ng/mL milk), 2-Heptanone (22.19 ng/mL milk), and 2-Pentanone (4.33 ng/mL milk; ). The aliphatic hydrocarbons and esters comprised five compounds each. The former included decane, undecane, dodecane, tridecane, and tetradecane; and the latter comprised ethyl acetate, butanoic acid methyl ester, acetic acid butyl ester, propanoic acid butyl ester, and butanoic acid butyl ester. Methyl ketones are the main ketone group of volatile compounds in milk.[Citation3,Citation11,Citation15] It can be supposed that acetone and butanone originated from bovine metabolism.[Citation11] Both 2-pentanone and 2-heptanone are partly thermally-induced compounds formed upon thermal decarboxylation of β-ketoacids or β-oxidation of fatty acids, followed by decarboxylation.[Citation3,Citation20]
Aliphatic hydrocarbons have a weak odor, are generally considered to have less impact on the overall milk flavor because of their high aroma thresholds.[Citation20] The important contributions of the ester compounds to food aroma are undisputed: esters with low carbon atoms are highly volatile at ambient temperatures and the perception thresholds are ten times lower than their alcohol precursors.[Citation20] In the present study, ethyl acetate, due to its high amount, probably contribute acesent/sour flavor to the milk, which originates from the action of lactic acid bacteria.
In addition, four alcohols (1-Butanol, 2-ethoxy-Ethanol, 2-ethyl-1-Hexanol, and 1-Octanol), three aldehydes (hexanal, octanal, and nonanal), two sulfo compounds and one nitrogenous compound (methoxy-phenyl-Oxime) were detected. Alcohols, which are responsible for the strong and exciting flavors in dairy product, could be formed by reduction from the aldehydes,[Citation20] amino acid metabolism or fermentation of lactose.[Citation8] Most volatile alcohols have little impact on food flavors because of their high odor threshold, unless they are unsaturated or present at high concentrations.[Citation20] Acetaldehydes have been reported in heated milk as a product of light induced oxidation in milk or PET degradation.[Citation15,Citation32] Hexanal, a grass aroma, is the main aldehyde detected in our GC-MS analysis, which is a typical volatile from oxidized linoleic acid,[Citation11] while octanal and nonanal were present in smaller proportions. These three aldehydes known to contribute off-flavors to milk were also found in stale flavor volatiles from the headspace of UHT milk.[Citation13,Citation29] There is little information on methoxy-phenyl-oxime, but the compound has also been found in in ultrapasteurized milk packaged in polyethylene terephthalate containers and in reconstituted milk and reduced-fat cheese.[Citation3,Citation8] Aldehydes could provide significant aromas, either pleasant or rancid, to foodstuffs, and their odor threshold values are usually lower than those of alcohols.[Citation25] Thus, even trace amounts of aldehydes might override the flavor effect of some other substances.[Citation20] Sulfur containing molecules are responsible for the “cooked” off-flavor developed during high temperature pasteurization.[Citation7,Citation12] In this study, only dimethyl sulfone and dimethyl sulfoxide were detected by GC-MS in microfiltered pasteurized milk and their contents were 1.57 and 0.81 ng/mL milk, respectively. This may attribute to the mass spectrometric detectors or the SPME technique being insufficiently sensitive to detect other sulfur compounds with the low concentrations.[Citation2,Citation7] In the future work, the extraction parameters and detectors would be optimized to improve the sensitivity.
also shows that the contents of eight volatile compounds in milk in decreasing order were acids > ketones > nitrogenous compounds > aromatic hydrocarbons > esters > aldehydes > alcohols > aliphatic hydrocarbons > sulfo compounds. Among the 52 identified volatile components, the dominant five volatiles were acetone (87.44 ng/mL milk), octanoic acid (66.94 ng/mL milk), methoxy-phenyl-oxime (51.58 ng/mL milk), hexanoic acid (47.67 ng/mL milk), and n-Decanoic acid (42.56 ng/mL milk).
As reported previously, when using GC-MS methods, many fewer (11 to 80) volatile compounds in different milk products could be identified ().[Citation3,Citation6,Citation7,Citation9,Citation11–Citation15,Citation33] The differences observed might reflect the different volatile extraction methodologies and milk processing methods used, chemical compositions in the milk, biological factors, and/or geographical origin of the cows.
SPME-GC×GC-TOFMS Analysis
Group-type classification
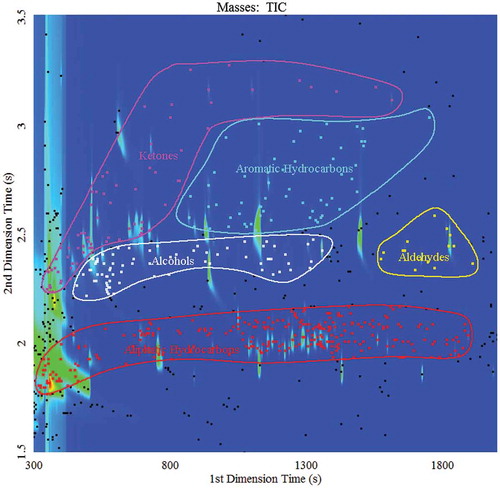
A 3D partial plot of milk sample is presented in , which indicated that the volatile compounds in the milk were very complicated. In the TIC, the analytes in the contour plots could be divided into five main classes (): aliphatic hydrocarbons, alcohols, aromatic compounds, ketones, and aldehydes. Some other volatiles, e.g., esters and nitrogenous compounds, could also be detected, but they overlapped each other or their levels were low, and are thus, not emphasized in the figures.
FIGURE 1 3D partial surface plot of milk sample.
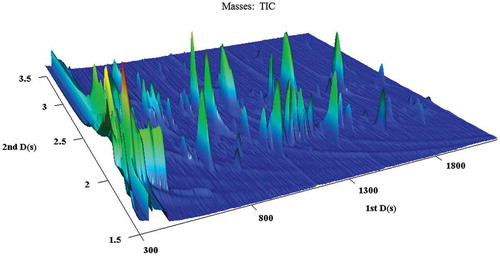
FIGURE 2 Structurally ordered color plot of main compound classes of flavor volatiles of milk.
Identification
The analysis of the milk samples requires that each peak is identified based on its ordered retention time and MS confirmation. The total peak areas caused by solvent elution and column bleeding were removed using the features of ChromaToF, and the peak areas of analytes were converted into the new relative area, which represented 100%. The TIC was used to set up the minimum relative peak area and similarity criterion to isolate the most abundant analytes. The first class, with relative peak area greater than 1%, comprised the top 21 compounds (). The second (47) and third class (84) were compounds with relative peak areas of more than 0.5 and 0.2%, respectively (). According to their chemical structures, all compounds could be divided into nine groups: aliphatic hydrocarbons, aromatic hydrocarbons, esters, ketones, alcohols, nitrogenous compounds, aldehydes, ethers, and acids. The total relative percentages of peak areas and the numbers of compounds in each group are shown in . Among the groups, aliphatic compounds presented the highest number, followed by aromatic hydrocarbons, ketones, esters, aldehydes/alcohols/acids, nitrogenous compounds, ethers, and sulfo compounds. Whereas, the top five groups with the highest relative area percentages were aliphatic compounds, ketones, acids, aromatic hydrocarbons, and alcohols.
TABLE 3 Number of peaks based on minimum peak areas
Milk volatiles profile
shows that a total of 219 volatile compounds were identified by GC×GC-TOFMS, which were detected in the first dimension range of 320–2604 s and in a second dimension range of 0.1–3.8 s, and the respective RIs were calculated according to the ChromaTOF software system. An intensive literature search was conducted to obtain the RI values for the compounds detected in the present study (, RIRef). The most intensive peaks, called base peaks, were used to calculate the RIs. Compared with the RIs reported in the literature (), a maximum difference of 30–40 was found for the absolute RI (|RIcal-RIRef|) in this study, and this variation can be considered reasonable.[Citation17] Compound types, numbers and contents correspond to those presented in and . The analysis by GC×GC-TOFMS allowed the authors to identify about four times more compounds than were detected by GC-MS. In particular, eight ethers identified by GC×GC-TOFMS were not detected by GC-MS in milk. In addition, the analysis by GC×GC-TOFMS allowed an additional detection of: aliphatic hydrocarbons (64), aromatic hydrocarbons (31), ketones (18), esters (11), aldehydes (11), alcohols (10), nitrogenous compounds (8), sulfo compounds (3), and acids (3), compared with GC-MS. Moreover, the contents of nine volatile compounds in milk in decreasing order were aliphatic hydrocarbons > ketones > acids > aromatic hydrocarbons > alcohols > nitrogenous compounds > aldehydes >esters > ethers > sulfo compounds. As shown in , the concentrations of volatiles detected using GC×GC-TOFMS were about 4.93-fold higher than those determined by GC-MS. Among the 214 identified volatile components, the dominant five volatiles were hexanoic acid (193.57 ng/mL milk), methoxy-phenyl-oxime (114.83 ng/mL milk), octanoic acid (109.38 ng/mL milk), 4,5-dimethyl-1-hexene (101.48 ng/mL milk), and 2-Pentanone (99.74 ng/mL milk).
Compared with the GC system, the greater capacity of GC×GC to identify larger number and amounts of compounds lies in its second dimension column, as well as the spectral deconvolution function for the co-eluted compounds in both the first and second dimension. As shown in , the three compounds that overlapped in the first dimension time at 1176 s were separated by the second dimension column, and identified as decane, 1,1,3,3,5-Pentamethylcyclohexane, (S)-2-Octanol, respectively (). Their second dimension retention times were 2.010, 2.100, and 2.320 s, respectively, showing a great difference. Thus, they could be effectively separated. However, only decane was detected by GC-MS, indicating that these three compounds co-eluted in GC-MS analysis, which led to inaccurate quantitative analysis of aliphatic hydrocarbons and alcohols. showed that three chromatographic peaks overlapped in the first and second dimension time. The spectral deconvolution based on mass spectra differences isolated the peaks and identified them as 2,2,4,6,6-pentamethyl-heptane, 4-ethyl-2-Octene and1-Decyne (). This indicated that GC×GC-TOFMS has much higher potential to isolate and identify compounds than the GC-MS detection method.
FIGURE 3 An example of a more powerful separation ability of 2D GC compared to 1D GC (A) Separation of three compounds by the second dimension column at 1176 s (1tR) found in volatiles of milk: (1) Decane, 2.010 s (2tR); (2) 1,1,3,3,5-Pentamethylcyclohexane, 2.100 s (2tR); (3) 2-Octanol, (S)-, 2.320 s (2tR); (B) Deconvoluted mass spectra of compounds in (A). The three compounds were separated by the second dimensional column, and would have co-eluted on the first dimensional column.
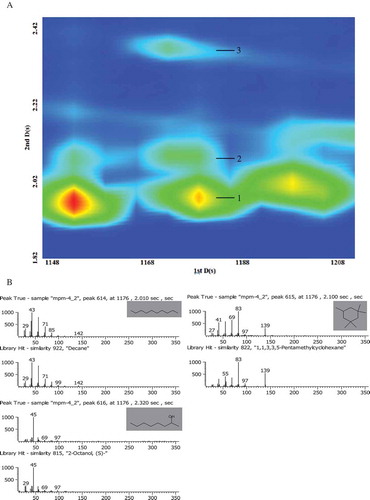
FIGURE 4 (A) Modulated peaks of three compounds found in flavor volatiles of milk: (1) red line, Heptane, 2,2,4,6,6-pentamethyl-, m/z 57; (2) green line, 2-Octene, 4-ethyl-, m/z 55; (3) blue line, 1-Decyne, m/z 67. (B) Deconvoluted mass spectra of compounds in (A).
According to the data available in the literature,[Citation1,Citation3–Citation15,Citation21,Citation25,Citation26,Citation33–Citation35] among the 219 volatiles detected by GC×GC-TOFMS, 107 are reported for the first time in milk: aliphatic hydrocarbons (15), aromatic hydrocarbons (30), esters (19), ketones (9), alcohols (14), nitrogenous compounds (12), aldehydes (2), acids (3), and furans (3). These compounds have already been detected in other food, and some of them have been reported to have sensory properties and characteristic aromas. For example, 4,5-dimethyl-1-Hexene was detected as a major compound, comprising approximately 16.4% of the total aliphatic hydrocarbons, which has fruits or with fragrances.[Citation20] 1,5-Hexadien-3-ol, (Z)-2-decenal (slightly fatty, floral, green) and 2-pentylfuran (are beany, grassy, and licorice-like tastes) are also well-known and common aroma compound).[Citation36] In addition, isobutyl acetate was detected in trace amounts in milk and its aroma descriptor related to the characteristic flavor of pear.[Citation20]
CONCLUSION
The qualitative analysis of milk volatiles using GC×GC-TOFMS was reported for the first time. The present results showed that GC×GC-TOFMS improved the resolution and separation efficiency of highly complex analytes like milk. It not only separated the 52 compounds that coelute in conventional GC-MS, but also allowed the identification of compounds that were not previously detected. The milk samples were found to contain 219 volatiles by GC×GC-TOFMS, including aromatic hydrocarbons, aliphatic hydrocarbons, esters, aldehydes, alcohols, nitrogenous compounds, ketones, acids, ethers, and sulfo compounds. One hundred seven of these compounds were reported for the first time in milk compared with previously published results from GC-MS. Both the number and concentration of compounds identified using GC×GC-TOFMS were higher than those detected by GC-MS analysis for milk volatiles. Overall, SPME-GC×GC-TOFMS was able to extract, separate, and identify the volatile compounds from the milk sample; but it still lacks information on the key aroma compounds. Thus, how to separate and identify the key aroma compounds will be addressed in the future.
FUNDING
This research was supported by grants from the Open Project Program of State Key Laboratory of Dairy Biotechnology, Bright Dairy and Food Co. Ltd. (SKLDB2013-02), the Shanghai Minhang District Commission of Science and Technology(2013MH088), the National Science and Technology Pillar Program during the 12th Five-year Plan Period (No. 2013BAD18B02), and the Agricultural Science and Technology Achievements Transformation Fund (2012GB2CO00141).
ACKNOWLEDGMENTS
A special thanks to SJTU-Instrumental Analysis Center for expert assistance with the GC-MS and GC×GC-TOFMS experiments.
Additional information
Funding
REFERENCES
- Aghlara, A.; Mustafa, S.; Manap, Y.A.; Mohamad, R. Characterization of headspace volatile flavor compounds formed during kefir production: Application of solid phase microextraction. International Journal of Food Properties 2009, 12, 808–818.
- Pereda, J.; Jaramillo, D.P.; Quevedo, J.M.; Ferragut, V.; Guamis, B.; Trujillo, A.J. Characterization of volatile compounds in ultra-high-pressure homogenized milk. International Dairy Journal 2008, 18, 826–834.
- Solano-Lopez, C.E.; Ji, T.; Alvarez, V.B. Volatile compounds and chemical changes in ultrapasteurized milk packaged in polyethylene terephthalate containers. Journal of Food Science 2005, 70, C407–C412.
- Karatapanis, A.E.; Badeka, A.V.; Riganakos, K.A.; Savvaidis, I.N.; Kontominas, M.G. Changes in flavour volatiles of whole pasteurized milk as affected by packaging material and storage time. International Dairy Journal 2006, 16, 750–761.
- Havemose, M.; Justesen, P.; Bredie, W.; Nielsen, J.H. Measurement of volatile oxidation products from milk using solvent-assisted flavour evaporation and solid phase microextraction. International Dairy Journal 2007, 17, 746–752.
- Chouliara, E.; Georgogianni, K.; Kanellopoulou, N.; Kontominas, M. Effect of ultrasonication on microbiological, chemical, and sensory properties of raw, thermized, and pasteurized milk. International Dairy Journal 2010, 20, 307–313.
- Zhang, S.; Yang, R.; Zhao, W.; Hua, X.; Zhang, W.; Zhang, Z. Influence of pulsed electric field treatments on the volatile compounds of milk in comparison with pasteurized processing. Journal of Food Science 2011, 76, C127–C132.
- Wang, W.; Zhang, L.; Li, Y. Production of volatile compounds in reconstituted milk reduced-fat cheese and the physicochemical properties as affected by exopolysaccharide-producing strain. Molecules 2012, 17, 14393–14408.
- Pan, D.; Wu, Z.; Peng, T.; Zeng, X.; Li, H. Volatile organic compounds profile during milk fermentation by Lactobacillus pentosus and correlations between volatiles flavor and carbohydrate metabolism. Journal of Dairy Science 2014, 97, 624–631.
- Bendall, J.G. Aroma compounds of fresh milk from New Zealand cows fed different diets. Journal of Agricutural and Food Chemistry 2001, 49, 4825–4832.
- Valero, E.; Villamiel, M.; Miralles, B.; Sanz, J.; Martınez-Castro, I. Changes in flavour and volatile components during storage of whole and skimmed UHT milk. Food Chemistry 2001, 2, 51–58.
- Hougaard, A.B.; Vestergaard, J.S.; Varming, C.; Bredie, W.L.; Ipsen, R.H. Composition of volatile compounds in bovine milk heat treated by instant infusion pasteurisation and their correlation to sensory analysis. International Journal of Dairy Technology 2011, 64, 34–44.
- Perkins, M.L.; D’Arcy, B.R.; Lisle, A.T.; Deeth, H.C. Solid phase microextraction of stale flavour volatiles from the headspace of UHT milk. Journal of Science and Food Agriculture 2005, 85, 2421–2428.
- Mounchili, A.; Wichtel, J.; Bosset, J.; Dohoo, I.R.; Imhof, M.; Altieri, D.; Mallia, S.; Stryhn, H. HS-SPME gas chromatographic characterization of volatile compounds in milk tainted with off-flavour. International Dairy Journal 2005, 15, 1203–1215.
- Contarini, G.; Povolo, M.; Leardi, R.; Toppino, P.M. Influence of heat treatment on the volatile compounds of milk. Journal of Agricutural and Food Chemistry 1997, 45, 3171–3177.
- Shellie, R.; Marriott, P.; Morrison, P. Concepts and preliminary observations on the triple-dimensional analysis of complex volatile samples by using GC×GC-TOFMS. Analytical Chemistry 2001, 73, 1336–1344.
- Rocha, S.M.; Coelho, E.; Zrostlikova, J.; Delgadillo, I.; Coimbra, M.A. Comprehensive two-dimensional gas chromatography with time-of-flight mass spectrometry of monoterpenoids as a powerful tool for grape origin traceability. Journal of Chromatography A 2007, 1161, 292–299.
- Parastar, H.; Radovic, J.R.; Bayona, J.M.; Tauler, R. Solving chromatographic challenges in comprehensive two-dimensional gas chromatography-time-of-flight mass spectrometry using multivariate curve resolution-alternating least squares. Analytical Bioanalytical Chemistry 2013, 405, 6235–6249.
- Göğüş, F.; Lewis, A.C.; Özel, M.Z. Analysis of black mulberry volatiles using GCxGC-TOF/MS. International Journal of Food Properties 2011, 14, 29–36.
- Song, H.L. Food Flavor Chemistry; Chemical Industry Press: Beijing, 2008, 76–87.
- Karagül-Yüceer, Y.; Cadwallader, K.R.; Drake, M. Volatile flavor components of stored nonfat dry milk. Journal of Agricutural and Food Chemistry 2002, 50, 305–312.
- Čajka, T.Ð.; HajÐlovµ, J.; Cochran, J.; Holadovµ, K.; Klimµnkovµ, E. Solid phase microextraction-comprehensive two-dimensional gas chromatography-time-of-flight mass spectrometry for the analysis of honey volatiles. Journal of Seperation Science 2007, 30, 534–546.
- Riener, J.; Noci, F.; Cronin, D.A.; Morgan, D.J.; Lyng, J.G. Characterisation of volatile compounds generated in milk by high intensity ultrasound. International Dairy Journal 2009, 19, 269–272.
- Dong, L.; Piao, Y.; Zhang, X.; Zhao, C.; Hou, Y.; Shi, Z. Analysis of volatile compounds from a malting process using headspace solid-phase micro-extraction and GC-MS. Food Research International 2013, 51, 783–789.
- Ma, Y.L.; Cao, Y.P.; Yang, Z.N.; Wang, B. Comparison of volatile compound in different cheese samples by SPME-GC-MS. Journal of Food Science 2013, 34, 103–107 ( in Chinese).
- Vagenas, G.; Roussis, I.G. Fat-derived volatiles of various products of cows’, ewes’, and goats’ milk. International Journal of Food Properties 2012, 15, 665–682.
- Zareba, D.; Ziarno, M.; Obiedzinski, M. Volatile profile of non-fermented milk and milk fermented by Bifidobacterium animalis subsp. lactis. International Journal of Food Properties 2012, 15, 1010–1021.
- Delgado, F.J.; González-Crespo, J.; Cava, R.; García-Parra, J.; Ramírez, R. Characterisation by SPME-GC-MS of the volatile profile of a Spanish soft cheese PDO Torta del Casar during ripening. Food Chemistry 2010, 118, 182–189.
- Marsili, R. SPME-MS-MVA as an electronic nose for the study of off-flavors in milk. Journal of Agricutural and Food Chemistry 1999, 47, 648–654.
- Yang, D.S.; Lee, K.S.; Jeong, O.Y.; Kim, K.J.; Kays, S.J. Characterization of volatile aroma compounds in cooked black rice. Journal of Agricultural and Food Chemistry 2007, 56, 235–240.
- Honkanen, E.; Karvonen, P.; Virtanen, A.I. Studies on the transfer of some flavor compounds to milk. Acta Chemica Scandinvica 1964, 18, 612–618.
- Van Aardt, M.; Duncan, S.; Marcy, J.; Long, T.; Hackney, C. Effectiveness of poly (ethylene terephthalate) and high-density polyethylene in protection of milk flavor. Journal of Dairy Science 2001, 84, 1341–1347.
- Nicolotti, L.; Cordero, C.; Cagliero, C.; Liberto, E.; Sgorbini, B.; Rubiolo, P.; Bicchi, C. Quantitative fingerprinting by headspace-two-dimensional comprehensive gas chromatography-mass spectrometry of solid matrices: Some challenging aspects of the exhaustive assessment of food volatiles. Analytica Chimica Acta 2013, 798, 115–125.
- Soukoulis, C.; Aprea, E.; Biasioli, F.; Cappellin, L.; Schuhfried, E.; Märk, T.D.; Gasperi, F. Proton transfer reaction time-of-flight mass spectrometry monitoring of the evolution of volatile compounds during lactic acid fermentation of milk. Rapid Communication in Mass Spectrometry 2010, 24, 2127–2134.
- Wang, B.; Xu, S.; Sun, D.W. Application of the electronic nose to the identification of different milk flavorings. Food Research International 2010, 43, 255–262.
- Wei, C.; Xi, W.; Nie, X.; Liu, W.; Wang, Q.; Yang, B.; Cao, D. Aroma characterization of flaxseed oils using headspace solid-phase microextraction and gas chromatography-olfactometry. European Journal of Lipid Science and Technology 2013, 115, 1032–1042.