
Abstract
Starch granule development and physicochemical properties of starches in waxy wheat and non-waxy wheat were investigated in this article. Starch granules in waxy wheat endosperm showed an early developmental process. Compared with non-waxy wheat starch granules (round-shaped), waxy wheat starch granules (ellipse-shaped) were larger and contained more B-type granules. According to the granule size, starch granules were divided into two groups in waxy wheat, but were divided into three groups in non-waxy wheat. Compared with non-waxy wheat starch, waxy wheat starch had higher swelling power, gelatinization temperatures (To, Tp, Tc), and relative degree of crystallinity. They showed similar ordered structures on external regions of starch granules. Additionally, waxy wheat starch had a higher proportion of double-helical components and a lower proportion of single-helical components than non-waxy wheat starch. Based on the previous results, it was concluded: (1) waxy wheat and non-waxy wheat not only differed in starch granule development, but also in physicochemical properties of starches; (2) waxy wheat had more potential value for producing traditional products than non-waxy wheat.
INTRODUCTION
Wheat starch, which accounts for approximately 70% of grain weight, consists of two glucose polymers: amylose and amylopectin. Starch amylose is synthesized by the enzyme granule-bound starch synthase (GBSS). There are two types of GBSS (GBSSI and GBSSII) expressed in a tissue-specific manner.[Citation1] In common wheat (Triticum aestivum L.), there are three structural genes encoding GBSS isoforms. When only one or two GBSS genes are functional, they are called partially waxy. When the three GBSS genes are non-functional, they are called waxy (triple null); plants with triple null GBSS genotypes contain almost no amylose.[Citation2]
The physicochemical properties of waxy wheat (WW) have been studied in several countries.[Citation3] Breeders around the world have made their own crosses and developed their own WW varieties. Several reports have focused on the qualities, properties, and potential applications of waxy wheat starch (WWS) in bread and noodle production. Additionally, differences in starch pastes and thermal properties between WW and non-waxy wheat (NW) have been studied.[Citation2] Compared to wild-type wheat starch, WWS has lower pasting temperature and setback viscosity, and higher peak viscosity, breakdown, and swelling power,[Citation4] which is a desirable functional property for textural quality of white salted noodles. Moreover, the waxy gene affects matter accumulation in wheat grains. A crossbred WW has reduced starch lipid content;[Citation5] one of two near-isogenic WW lines has increased arabinoxylan content in wheat caryopses.[Citation6]
There are two main starch granules in wheat endosperm: A-type and B-type. A- and B-type granules possess different structures and physicochemical properties.[Citation7] The development of starch granules affects overall starch behavior. However, there is little information on the development of starch granules in WW endosperm. The knowledge in starch physicochemical properties, such as ordered structure in external region of granules and relative proportions of double helices and single helices between WW and NW is still insufficient. To further understand the differences in structural development and physicochemical properties between WWS and non-waxy wheat starch (NWS), it is crucial to assess the microscopic and biochemical characteristics.
In this study, Yang 05G68 (WW cultivar) and Yangmai 15 (NW cultivar) were used to evaluate the starch granule development and physicochemical properties of starches using the methods of structural observation and differential scanning calorimetry (DSC), X-ray diffraction (XRD), Fourier transform infrared (FTIR), and cross polarization/magic angle spinning nuclear magnetic resonance (CP/MAS NMR) analyses.
MATERIALS
WW line Yang 05G68, lacking the Wx-A1, Wx-B1, and Wx-D1 proteins, provided by Professor Derong Gao, Yangzhou Academy of Agricultural Sciences, while the NW genotype Yangmai 15, wx gene loci were all functional. Both wheat cultivars were grown in the experimental field of Yangzhou University (Key Laboratory of Crop Genetics and Physiology) in Jiangsu from October 2012 to May 2013. To determine the exact date of flowering, individual florets were marked and the plants were tagged.
METHODS
Microstructural Observation of Caryopses
Fresh caryopses at different days after flowering (DAF) were cut transversely from the center generating 2-mm slices, which were immediately immersed in a fixative containing 2.5% glutaraldehyde in phosphate buffer (0.2 mol L–1; pH 7.2) at 4°C for 3 h. The samples were subsequently rinsed with phosphate buffer (0.2 mol L–1; pH 7.2), sequentially dehydrated in an ethanol series of 20, 40, 60, 80, 90, 95, and 100%, replaced by propylene oxide, embedded with low glutinosity resin, and polymerized at 70°C for 12 h. Finally, samples were cut into 1-μm slices using an ultramicrotome (Leica Ultracut R, Germany), stained with toluidine blue (0.5%) for 5 min, and observed under a light microscope (Leica DMLS, Germany) equipped with a digital camera (Olympus E520, Japan).
Starch Isolation and Determination of Amylose and Amylopectin Contents
Mature wheat caryopses were selected and endosperm starch was isolated according to the method of He et al.[Citation8] with slight modifications. Briefly, caryopses were soaked in 0.05 mol L–1 NaOH solution for 24 h and completely ground. The ground sample was filtered through four gauze layers and through 100-, 200-, 300-, and 400-mesh wire screens. The sample was centrifuged at 4000 × g for 5 min, re-suspended in 0.05 mol L–1 NaOH solution, and re-centrifuged at 4000 × g for 5 min to remove protein. This step was repeated four or five times until the supernatant was clear, indicating that there was no protein. Starch was washed three times with water and twice with ethanol. Finally, samples were dried at room temperature (25°C) and stored at –20°C. Amylose and amylopectin contents were determined by the dual-wavelength assay.[Citation9]
Morphology Observation and Size Distribution Determination
Starch granules (2 mg) were dispersed in 2 mL distilled water. An aliquot of the starch dispersion was placed on a microscope slide. The starch dispersion was observed and photographed at 400× under optical microscope (Leica DMLS, Germany) equipped with a digital camera (Olympus E520, Japan). Five photographs of each starch sample were selected; the size and distribution of the starch granules were determined using Image-Pro Plus software (Version 6.0, Media Cybernetics, USA).
Swelling Power Determination
The swelling power of the starch granules was determined according to the method reported by Cozzolino et al.[Citation10] Starch (2.5 g) was hydrated in 30 mL distilled water for 30 min and centrifuged at 3000 × g for 10 min. The resulting supernatant was dried at 105°C to constant weight. The swelling power was calculated from the equations reported by Li and Yeh.[Citation11]
Thermal Properties and X-ray Pattern
The thermal properties of the starch granules were determined by DSC (200-F3, Netzsch, Germany) according to the method of Wei et al.[Citation12] Starch granules were placed in a culture dish inside a sealed beaker, containing saturated NaCl solution that maintained a constant relative humidity of 75% for 7 d at 25°C before determination. Starch XRD patterns were obtained with an X-ray power diffractometer (D8, Germany). The relative degree of crystallinity was calculated with Image-Pro Plus and Adobe Photoshop CS5 software according to the method reported by Nara and Komiya.[Citation13]
FTIR Spectroscopy Analyses
Starch samples (40% moisture) were subjected to FTIR spectroscopy. The FTIR instrument (Varian 7000, USA) was coupled to an attenuated total reflectance (ATR). ATR-FTIR spectra of the samples were recorded. Spectra were corrected to the baseline at 1200–800 cm–1 prior to deconvolution. The assumed line shape was Lorentzian with a half-width of 19 cm–1 and a resolution enhancement factor of 1.9.[Citation14] Infrared (IR) absorbance values at 1045, 1022, and 995 cm–1 were calculated from the deconvoluted spectra by recording the height of the absorbance bands from the baseline to the peak point.
Solid-State 13C CP/MAS NMR Analyses
Solid-state 13C CP/MAS NMR analyses of starch were performed in a spectrometer (Advance III 400 MHz, Germany). Amorphous starch was prepared from rice kernel starch according to the method described by Atichokudomchai et al.[Citation15] Starch samples were centrifuged at 7.5 kHz in a 7 mm ZrO2 rotor. The C1 region of the ordered sub-spectrum was peak-fitted using PeakFit software (Version 4.12, USA) to distinguish four individual peaks at approximately 99.5, 100.4, 101.6, and 102.9 ppm according to the method reported by Sivam et al.[Citation16] The relative proportions of amorphous, V-type single-helical, and double-helical components of starch granules were calculated following the method reported by Tan et al.[Citation17]
Statistical Analyses
Analysis of variance (ANOVA) and Tukey’s test were performed using SPSS software (version 19.0, International Business Machines Corporation, USA). Statistical significance was set at p < 0.05. Origin 8.0 and Adobe Photoshop CS5 were used to draw figures.
RESULTS AND DISCUSSION
Development of Starch Granules in Endosperm Transfer Cells (ETCs) and Central Endosperm Cells (CECs)
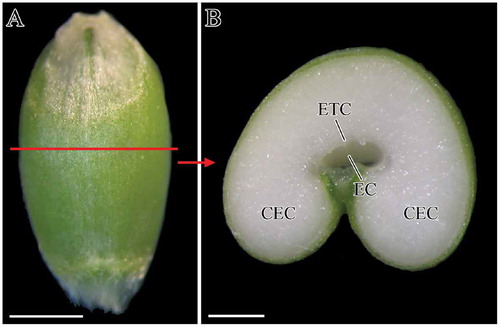
Wheat endosperm accumulates starch and protein molecules in amyloplasts and protein bodies, respectively. In different regions of wheat endosperm, there are different amounts and sizes of starch granules, with different developmental properties.[Citation18] Therefore, in this study, the development of starch granules in ETCs and CECs was assessed and the positions of ETCs and CECs were shown in . In transverse section of wheat caryopsis, starch granules were mainly accumulated in two regions, namely, ETCs which were positioned facing the endosperm cavity and CECs which occupied most of the endosperm ().
FIGURE 1 Caryopsis profile and transverse section of caryopsis: (a) caryopsis profile of non-waxy wheat, 22 DAF; (b) image of caryopsis transverse section, 22DAF. CEC: central endosperm cell; EC: endosperm cavity; ETC: endosperm transfer cell. Scale bars: 2 cm (a) and 1 cm (b).
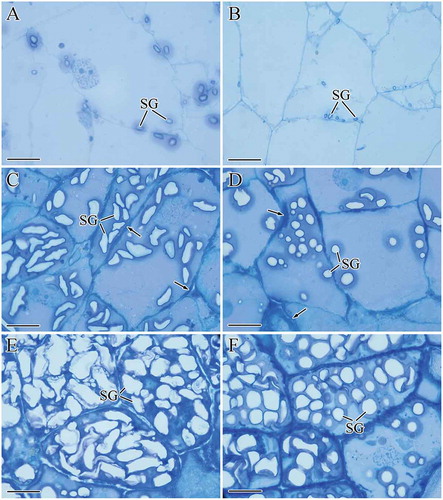
shows the development of starch granules in ETCs. At 8 DAF, there were more WW starch granules than NW starch granules. Furthermore, WW starch granules were larger in size ( and ). At 15 DAF, WW starch granules were elliptical in shape and larger than NW starch granules, which were round in shape. Additionally, there were fewer NW starch granules ( and ) than WW starch granules. At 27 DAF, ETCs in both wheat cultivars accumulated a large amount of starch granules; however, the size and quantity of WW starch granules were larger than those of NW ( and ).
FIGURE 2 Development of starch granules in endosperm transfer cells (ETCs): (a) WW, 8 DAF; (b) NW, 8 DAF; (c) WW, 15 DAF; (d) NW, 15 DAF; (e) WW, 27 DAF; (f) NW, 27 DAF. SG: starch granule. Black arrows in (c) and (d) show thickened cell walls. Scale bars: 20 μm (a–f).
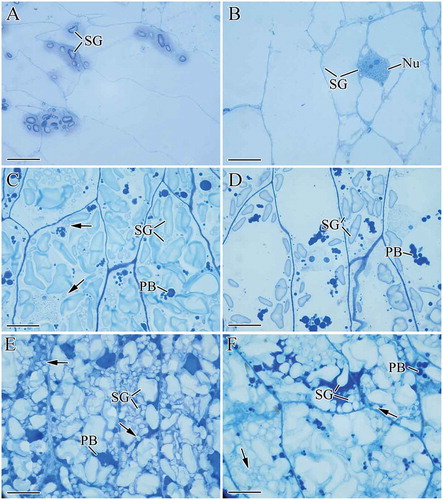
shows the development of starch granules in CECs. At 8 DAF, several starch granules accumulated in the CECs of WW, while few were observed in NW ( and ). At 15 DAF, the number of starch granules in both wheat cultivars increased; however, WW had more starch granules. Meanwhile, B-type granules (<10 μm) appeared in WW while no B-type starch granules were observed in NW ( and ). At 27 DAF, the endosperm cells of both wheat cultivars were highly enriched with starch granules and protein bodies. Compared with NW, more B-type starch granules were present in the CECs of WW ( and ).
FIGURE 3 Development of starch granules in central endosperm cells (CECs): (a) WW, 8 DAF; (b) NW, 8 DAF; (c) WW, 15 DAF; (d) NW, 15 DAF; (e) WW, 27 DAF; (f) NW, 27 DAF. Nu: nucleus; PB: protein body; SG: starch granule. Black arrows in (c) showed the B-type starch granules (<10 μm). Scale bars: 20 μm (a–f).
The results revealed that WW and NW not only differed in the number and shape of starch granules in ETCs, but also the number of B-type starch granules in CECs during wheat endosperm development.
Morphology and Granule Size Distribution
There are significant differences in the functional properties and chemical composition between A- and B-type starch granules in wheat, e.g., amylose content, lipid content, and gelatinization characteristics. Compared with B-type granules, A-type granules have lower gelatinization temperatures, higher transition enthalpy, and higher amylose content.[Citation19]
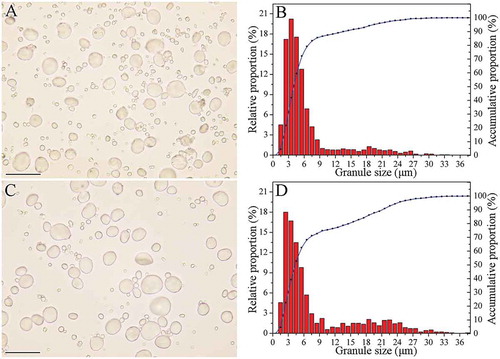
The morphology and granule size distributions of the two wheat cultivars are shown in . Both cultivars contained the large A-type granules and the small B-type granules ( and ). The granule size of WWS was 1.11–33.88 μm; granule size of NWS was 1.11–37.36 μm ( and ). WW starch granules consist of two main populations of granules: one peak at 1–10 μm and another peak at 16–24 μm (). NW starch granules consisted of three main populations of granules at 1–8, 8–10, and 10–28 μm, respectively (). Compared with NW, WW contained a larger proportion of B-type granules (86.62% versus 74.88%). A-type granules, which account for 70–80% of starch total weight, contribute to <10% starch. Therefore, the results of the present study were consistent with the findings of Zhang et al.,[Citation20] who reported that WW contains a smaller weight percentage of large A-type granules than NW.
FIGURE 4 Morphology and size distribution of starch granule: (a, b) WW; (c, d) NW. Scale bars: 50 μm (a and c).
Amylose Content, Swelling Power, and Thermal Properties
The swelling power tests measure the ability of starch granules to absorb water during gelatinization.[Citation21] Amylopectin contributes to swelling power by absorbing water, while amylose tends to retard this process. A negative correlation between amylose content and swelling power has been reported.[Citation22] WW, which contains 0.95% amylose, had higher swelling power than NW, which contains 16.3% amylose (). Therefore, during starch gelatinization, the lower amylose content in WW resulted in higher swelling power (). Starch gelatinization involves uncoiling and melting of external amylopectin chains that are packed together as double helices in clusters, contributing to irreversible changes in granular properties (e.g., crystalline melting temperature, starch solubilization, and loss of birefringence).[Citation20]
TABLE 1 Amylose and amylopectin contents, swelling power, and thermal properties of starches
Starch gelatinization is affected by several factors including amylose content, granule size and morphology, and ultrastructure of starch granules.[Citation23,Citation24] The thermal parameters of the two starch cultivars are shown in . The gelatinization transition temperatures [onset temperature (To), peak temperature (Tp), conclusion temperature (Tc)], gelatinization transition temperature range (Tc – To), and gelatinization enthalpy (ΔH) were significantly higher in WWS than in NWS. High gelatinization temperatures and ΔH for WWS are attributed to higher relative crystallinities. Starch ΔH of gelatinization is mainly affected by disruption of starch double helices rather than the long-range order.[Citation25] The results revealed that, compared with NWS, WWS with high amylopectin content requires more energy to melt and uncoil the double helices during gelatinization.
XRD Analyses
Native starch has a relative degree of crystallinity of 20–45%. According to XRD patterns, the crystalline structure of starch can be divided into A-, B-, C-, and V- types.[Citation26] These crystalline types differed in water content and packing density of single and double helices. A-type is predominant in cereal crops; B-type is present in tuber plants and high-amylose crops; C-type, which consists of mixtures of A and B types, is present in legume crop seeds and rhizome of Dioscoreaceae plant; and V-type, which is rare, consists of amylose, fatty acids, emulgator, butanol, and iodine. The relative degree of crystallinity of starch is affected by the amylose content, branching and length of amylopectin outer chains, and molecular mass.[Citation27]
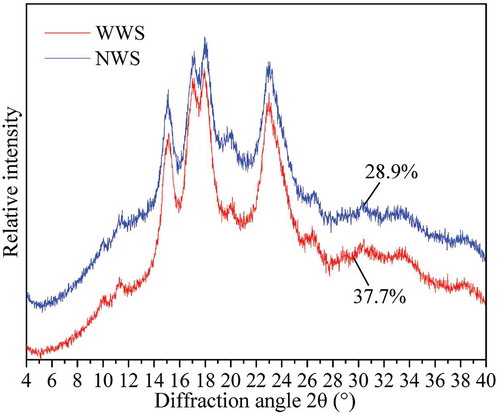
shows the XRD patterns of the two wheat cultivars. Both cultivars had typical A-type patterns with peaks at approximately 2θ of 15, 17, 18, and 23°. Differences of two patterns were found at 2θ of 17 and 18°, where WWS exhibited a higher intensity. The relative degree of crystallinity of WWS was 37.7%, which was considerably higher than that of NWS (28.9%). Short-chain portion of amylopectin form double helices, which further contribute to the crystalline structure in some areas of the starch granules by intermolecular interaction forces. It has been reported that amylose content is inversely related to the relative degree of crystallinity.[Citation28] The higher degree of crystallinity of WWS was attributed to the higher amylopectin content.
FIGURE 5 XRD patterns of starches. The numbers in the figure represented the relative degree of crystallinity (%), each data was the mean of three replicates.
FTIR Spectra
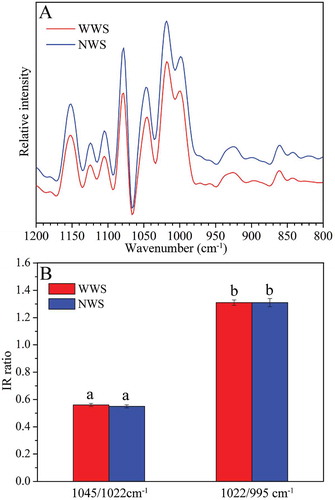
FTIR was used to study the short-range ordered structure of starch granules. There are two modes for analyzing the ordered structure of starch granules: One consists of the ATR mode, which analyzes the structure of the external regions of granules, and the other consists of the transmittance mode, which analyzes the whole structure within the granules.[Citation29] Starch FTIR spectra exhibited eight absorption peaks at 1200–800 cm–1. A study reported that the IR spectra of starch samples in this region is described by three main modes with maximum absorbance values at 1047, 1022, and 995 cm–1; it has been reported that the bands at 1047 and 1022 cm–1 are associated with the ordered and amorphous structures of starch, respectively. Absorbance at 995 cm–1 can be attributed to the bending and vibration of C-OH bonds. The changes in intensity of these bands are strongly associated with changes in the macromolecular order.[Citation30] The 1045/1022 cm–1 and 1022/995 cm–1 ratios are used to assess the degree of order in starches; a high 1045/1022 cm–1 ratio is indicative of a high ordered structure.[Citation14]
ATR-FTIR spectra and IR ratio of the two wheat cultivars are shown in . No significant differences were observed in ATR-FTIR spectra, 1045/1022 cm–1, and 1022/995 cm–1 between the two wheat cultivars ( and ). This result revealed that the structure of external region of the starch granules between WWS and NWS is identical.
FIGURE 6 Deconvoluted ATR-FTIR spectra and IR ratio of starch granules: (a) ATR-FTIR spectra; (b) ATR-FTIR IR ratio of absorbance. No significant differences (p < 0.05) between WWS and NWS are indicated by same lowercase letters.
CP/MAS 13C NMR Spectra
CP/MAS 13C NMR spectroscopy is widely used to study the structure of starch samples and structural changes of starch-based samples.[Citation31] The CP/MAS 13C NMR spectra of starch at 120–50 ppm had four main resonances peaks (103, 82, 73, and 62 ppm), which was attributed to the resonance of C1 (94–105 ppm), C4 (82–83 ppm), C6 (58–65 ppm), and C2, C3 and C5 (67–78 ppm) of the galacturonic acids of the α-(1→4) glucans in starch.[Citation32] NMR is very sensitive to polymorphism variation of starch; different crystalline polymorphic forms of starch have different NMR spectra features at 120–50 ppm.[Citation33] The NMR spectra of native starch revealed that it consists of amorphous and crystalline components.[Citation17] A third component reported for starch is the V-type single helical component present with a complexing agent in the helical channel.[Citation34] NMR spectra can be decomposed into amorphous and ordered phases by subtraction of the sub-spectrum for the amorphous component.[Citation17] The peak at 102.9 ppm in the sub-spectra coincided with the V-type single-helical components; the peaks at 99.6, 100.5, and 101.5 ppm were double-helical components.[Citation32]
The NMR spectra of the two wheat cultivars are shown in . The spectra had four main resonance peaks at 120–50 ppm; the most significant differences were in the C1 region (). The peak at 102.9 ppm was attributed to the amorphous component in native starch; the stronger the peak was, the more amorphous the component was. Compared with NWS, the peak at 102.9 ppm was weaker in WWS (). This result revealed that the amorphous component in WWS was less predominant than that in NWS. shows the relative proportion of the three conformations in the two wheat cultivars. WWS had a higher proportion of double helical component, a lower proportion of single helical component, and a smaller amorphous component than NWS. The higher proportion of double helical component in WWS was attributed to the high amylopectin content (73%, ). The higher proportion of single helices in NWS was due to the high amylose content. These findings were in accordance with the results obtained from XRD, which indicated that wheat with higher amylopectin content enhanced the ordered structure.
FIGURE 7 13C CP-MAS NMR spectra of starches: (a) NMR spectra from the region chemical shift 120 to 50 ppm; (b) NMR spectra from the region chemical shift 105 to 95 ppm. AS: amorphous starch.
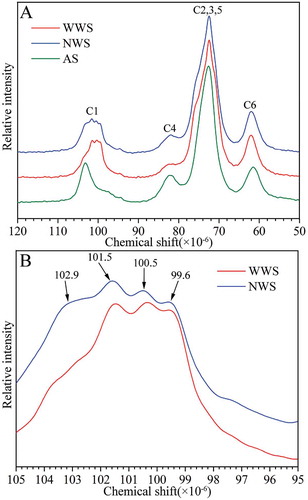
TABLE 2 Relative proportion of single helical, double helical, and amorphous components of starches
CONCLUSION
Structural development of endosperm starch granules and physicochemical properties of starches in WW and NW were investigated in this study. WW starch granules showed an early developmental process, which resulted in a larger proportion of small B-type granules in endosperm both in developmental and mature caryopsis. During caryopsis development, starch granules in ETCs of WW were elliptical in shape and larger than NW starch granules, which were round in shape. Additionally, CECs of WW accumulated more B-type starch granules. Size distribution analysis showed that there were two populations of granule size in WW and three populations in NW. WWS and NWS exhibited similar XRD patterns and ATR-FTIR spectra, which indicated no significant differences in ordered structures on external region of starch granules. Comparison with NWS, WWS had higher swelling power, relative degree of crystallinity, gelatinization temperatures (To, Tp, Tc), and proportion of double-helical component, and lower proportion of single-helical component.
FUNDING
This work was supported by the National Natural Science Foundation of China (Nos. 31171482, 31270228, 31071341) and a project funded by the Priority Academic Program Development of Jiangsu Higher Education Institutions (PAPD).
Additional information
Funding
Related Research Data
REFERENCES
- Nakamura, T.; Vrinten, P.; Hayakawa, K.; Ikeda, J. Characterization of a granule-bound starch synthase isoform found in the pericarp of wheat. Plant Physiology 1998, 118, 451–459.
- Ma, H.B.; Zhang, X.; Wang, C.G.; Gao, D.R.; Zhang, B.Q.; Lv, G.F.; Wu, R.L.; Cheng, X.M.; Wang, X.; Cheng, S.H.; Bie, T.D. Effect of wx genes on amylose content, physicochemical properties of wheat starch, and the suitability of waxy genotype for producing Chinese crisp sticks. Journal of Cereal Science 2013, 58, 140–147.
- Saito, M.; Vrinten, P.; Nakamura, T. DNA markers for identifying waxy mutations and improving noodle quality in wheat. JARQ 2010, 44, 109–115.
- Abdel-Aal, E.S.M.; Hucl, P.; Chibbar, R.N.; Han, H.L.; Demeke, T. Physicochemical and structural characteristics of flours and starches from waxy and nonwaxy wheats. Cereal Chemistry 2002, 79, 458–464.
- Yasui, T.; Matsuki, J.; Sasaki, T.; Yamamori, M. Amylose and lipid contents, amylopectin structure, and gelatinization properties of waxy wheat (Triticum aestivum) starch. Journal of Cereal Science 1996, 24, 131–137.
- Takata, K.; Yanaka, M.; Fujita, Y.; Ishikawa, N. Evaluation of the grain and flour quality in near-isogenic wheat lines with waxy and double-null Wx proteins. Breeding Science 2007, 57, 79–83.
- Kim, H.S.; Huber, K.C. Physicochemical properties and amylopectin fine structures of A-and B-type granules of waxy and normal soft wheat starch. Journal of Cereal Science 2010, 51, 256–264.
- He, J.F.; Goyal, R.; Laroche, A.; Zhao, M.L.; Lu, Z.X. Water stress during grain development affects starch synthesis, composition and physicochemical properties in triticale. Journal of Cereal Science 2012, 56, 552–560.
- Zhu, T.; Jackson, D.S.; Wehling, R.L.; Geera, B. Comparison of amylose determination methods and the development of a dual wavelength iodine binding technique. Cereal Chemistry 2007, 85, 51–58.
- Cozzolino, D.; Roumeliotis, S.; Eglinton, J. Relationships between swelling power, water solubility, and near-infrared spectra in whole grain barley: A feasibility study. Food and Bioprocess Technology 2013, 6, 2732–2738.
- Li, J.Y.; Yeh, A.I. Relationships between thermal, rheological characteristics, and swelling power for various starches. Journal of Food Engineering 2001, 50, 141–148.
- Wei, C.X.; Qin, F.L.; Zhou, W.D.; Xu, B.; Chen, C.; Chen, Y.F.; Wang, Y.P.; Gu, M. H.; Liu, Q.Q. Comparison of the crystalline properties and structural changes of starches from high-amylose transgenic rice and its wild type during heating. Food Chemistry 2011, 128, 645–652.
- Nara, S.; Komiya, T. Studies on the relationship between water-saturated state and crystallinity by the diffraction method for moistened potato starch. Starch 1983, 35, 407–410.
- Sevenou, O.; Hill, S.E.; Farhat, I.A.; Mitchell, J.R. Organisation of the external region of the starch granule as determined by infrared spectroscopy. International Journal of Biological Macromolecules 2002, 31, 79–85.
- Atichokudomchai, N.; Varavinit, S.; Chinachoti, P. A study of ordered structure in acid-modified tapioca starch by 13C CP/MAS solid-state NMR. Carbohydrate Polymers 2004, 58, 383–389.
- Sivam, A.S.; Waterhouse, G.I.N.; Zujovic, Z.D.; Perera, C.O.; Sun-Waterhouse, D. Structure and dynamics of wheat starch in breads fortified with polyphenols and pectin: An ESEM and Solid-State CP/MAS 13C NMR spectroscopic study. Food and Bioprocess Technology 2013, 6, 110–123.
- Tan, I.; Flanagan, B.M.; Halley, P.J.; Whittaker, A.K.; Gidley, M.J. A method for estimating the nature and relative proportions of amorphous, single, and double-helical components in starch granules by 13C CP/MAS NMR. Biomacromolecules 2007, 8, 885–891.
- Xiong, F.; Yu, X.R.; Zhang, C.; Zhou, L.; Wang, Z. Effect of nitrogen on cellular material filling in ventral and dorsal region of endosperm of high quality wheat. Journal of Triticeae Crops 2013, 33, 957–964.
- Hung, P.V.; Morita, M. Physicochemical properties of hydroxypropylated and cross-linked starches from A-type and B-type wheat starch granules. Carbohydrate Polymers 2005, 59, 239–246.
- Zhang, H.X.; Zhang, W.; Xu, C.Z.; Zhou, X. Morphological features and physicochemical properties of waxy wheat starch. International Journal of Biological Macromolecules 2013, 62, 304–309.
- Sodhi, N.S.; Chang, Y.-H.; Midha, S.; Kohyama, K. Molecular structure and physicochemical properties of acid-methanol-treated chickpea starch. International Journal of Food Properties 2013, 16, 125–138.
- Hermansson, A.M.; Svegmark, K. Developments in the understanding of starch functionality. Trends in Food Science & Technology 1996, 7, 345–353.
- Cooke, D.; Gidley, M.J. Loss of crystalline and molecular order during starch gelatinization: Origin of the enthalpic transition. Carbohydrate Research 1992, 227, 103–112.
- Wu, Y.; Lin, Q.L.; Cui, T.; Xiao, H.X. Structural and physical properties of starches isolated from six varieties of millet grown in China. International Journal of Food Properties. 2014, 17, 2344–2360.
- Miao, M.; Zhang, T.; Mu, W.M.; Jiang, B. Structural characterizations of waxy maize starch residue following in vitro pancreatin and amyloglucosidase synergistic hydrolysis. Food Hydrocolloids 2011, 25, 214–220.
- Cai, J.W.; Cai, C.H.; Man, J.M.; Xu, B.; Wei, C.X. Physicochemical properties of ginkgo kernal starch. International Journal of Food Properties 2015, 2, 380–391.
- Van Soesta, J.J.G.; Vliegenthart, J.F.G. Crystallinity in starch plastics: Consequences for material properties. Trends in Biotechnology 1997, 15, 208–213.
- Cheetham, N.W.H.; Tao, L. Variation in crystalline type with amylose content in maize starch granules: An X-ray powder diffraction study. Carbohydrate Polymers 1998, 36, 277–284.
- Man, J.M.; Yang, Y.; Zhang, C.Q.; Zhou, X.H.; Dong, Y.; Zhang, F.M.; Liu, Q.Q.; Wei, C.X. Structural changes of high-amylose rice starch residues following in vitro and in vivo digestion. Journal of Agricultural and Food Chemistry 2012, 60, 9332–9341.
- Shingel, K.I. Determination of structural peculiarities of dexran, pullulan, and gamma-irradiated pullulan by Fourier-transform IR spectroscopy. Carbohydrate Research 2002, 337, 1445–1451.
- Blaszczak, W.; Valverde, S.; Fornal, J. Effect of high pressure on the structure of potato starch. Carbohydrate Polymers 2005, 59, 377–383.
- Fan, D.M.; Ma, W.R.; Wang, L.Y.; Huang, J.L.; Zhang, F.M.; Zhao, J.X.; Zhang, H.; Chen, W. Determining the effects of microwave heating on the ordered structures of rice starch by NMR. Carbohydrate Polymers 2013, 92, 1395–1401.
- Thérien-Aubin, H.; Zhu, X.X. NMR spectroscopy and imaging studies of pharmaceutical tablets made of starch. Carbohydrate Polymers 2009, 75, 369–379.
- Snape, C.E.; Morrison, W.R.; Maroto-Valer, M.M.; Karkalas, J.; Pethrick, R.A. Solid state 13C NMR investigation of lipid ligands in V-amylose inclusion complexes. Carbohydrate Polymers 1998, 36, 225–237.