
Abstract
In this work, a range of model cookies enriched with different quantities of medicinal herbs, applied in two forms (pulverized mixture and extract), were studied to compare and describe relationships between physicochemical and sensory data. Multivariate statistical methods were applied to estimate relationships in the analyzed data. Analysis of variance showed that the majority of analyzed parameters were highly significant in discriminating among the samples (p < 0.05), which supported the usefulness of their application in characterizing the quality profile of enriched cookies. Principal component analysis on physicochemical data revealed that cookies at the same enrichment level showed more similarities. Principal component analysis on sensory data exhibited a larger separation between the samples with increasing enrichment levels, especially in the case of pulverized herbal mixture. According to partial least squares regression, two significant partial least squares components explained 92.7% and predicted 78.0% variation in the data. The most important parameters in discriminating between the cookies enriched with medicinal herbs were lightness, red tonality, and hardness. The selected physicochemical parameters could be used in future studies to evaluate variously enriched cookies by establishing models and investigating the predictability of sensory quality.
INTRODUCTION
Natural herbs have received much attention as sources of biologically active substances including antioxidants, antimutagens, and anticarcinogens.[Citation1,Citation2] In the previous study,[Citation3] a selection was made of non-toxic medicinal herbs with proven pharmacological action in order to compose the “Vitalplant” mixture tailored to provide metabolism stimulation and body weight regulation. Ethanolic extracts of this mixture were also shown to be a rich source of plant phenolics[Citation4] and to possess antioxidant[Citation3] and antimicrobial activity.[Citation5] With respect to the obtained results, “Vitalplant” mixture could be considered not only as a functional, but also as a sensory quality ingredient for cookie products.
Development of novel foods by adding functional components to carrier food provides new market opportunities for manufacturers.[Citation6] A suitable carrier foodstuff is certainly short dough cookie primarily due to its versatility, convenience, long shelf life, and especially its attractive sensory attributes.[Citation7,Citation8] At the same time, addition of functional components can contribute to a significant deterioration of sensory quality, thereby reducing consumer acceptability.[Citation9] Thus, a considerable proportion of product failure can be attributed to a mismatch between sensory properties and consumer needs or expectations.[Citation10] In respect of the above facts, descriptive sensory analysis remains an important method in the evaluation of different foods before conducting consumer tests.[Citation11] When integrated within the product development process, sensory testing allows cost-effective delivery of acceptable products to consumers and thus, reduces the risk of failure.[Citation12]
However, the costs involved in establishing and maintaining a sensory panel often drive many food scientists to use instrumental data rather than sensory evaluation for product characterization. Instrumental methods for the measurement of cookie quality have many practical advantages over sensory panels, so continual attempts to develop instrumental methods which can substitute sensory analyses are more than welcome. There are two ways to evaluate the quality as one of the critical parts of the development of cookies products, i.e., direct and indirect measurement. The most common method used in scientific research is a compression deformation test to measure the peak force as indicator of hardness, and fracturability which is expressed as a distance (mm) at the point of break. The latter can also be called predicting measurement, which is based on the assumption of the relationship between quality parameters and the tested characteristics. For these reasons, the need for quality control instruments and the desire to predict consumer acceptability are among the main elements guiding the research on sensory and instrumental relationship.[Citation13] An understanding of the relationships between existing instrument measurements and sensory panel results may provide information as to which chemical and physical methods or their combination will best predict relevant sensory descriptors.[Citation13,Citation14] It can also be called predicting measurement, which is based on the assumption of the relationship between overall quality and measured characteristics. Understanding this relationship is very important not only for the prediction of sensory quality from physicochemical characteristics, but also for the product quality control. In general, the relationship between instrumental and sensory data is limited to a particular product, and in the case of enriched cookies this certainly requires additional research, especially bearing in mind that there are no reports in the literature on instrumental versus sensory correlations for this type of product. Multivariate statistical methods build upon simple correlation by providing information about more complex relations that are known to exist between different data sets. Partial least squares-regression (PLSR) due to its simplicity is the most commonly applied form in almost all scientific researches. This is a method for relating two data matrices, X and Y, by a linear multivariate model, but it goes beyond traditional regression in that it models also the structure of X and Y. PLSR derives its usefulness from its ability to analyze data with many noisy, collinear, and even incomplete variables in both data blocks. This statistical tool has the desirable property that the precision of the model parameters improves with the increasing number of relevant variables and observations.[Citation15–Citation18]
Given the importance of cookies enriched with medicinal herbs and considering the absence of any scientific study setting out their main features, this study focused on identifying the differentiating characteristics of several formulated cookie samples, in particular related to the physicochemical and sensory characteristics. Furthermore, it was also intended to describe the relationships between physicochemical and sensory data for a range of model processed enriched cookies.
MATERIALS AND METHODS
Materials
The commercial herbal mixture “Vitalplant” (Frangulae cortex 35 g/100 g of mixture, Petroselini fructus 25 g/100 g, Menthae pip. folium 20 g/100 g, and Carvi fructus 20 g/100 g) was produced by the Institute for Medicinal Plants Research “Dr Josif Pančić” (Belgrade, Serbia). The mixture was in the form of powder with granulation of up to 3 mm. As explained elsewhere,[Citation3] crude herbal extracts were obtained by maceration with ethanol/water mixture (80:20, v/v), with the ratio of raw materials to ethanol solution of 1:10. Commercially available refined wheat flour, vegetable fat, powdered sugar, salt, and baking powder were purchased at the local market.
Cookie Preparation and Baking Method
Cookie dough was prepared from the above mentioned ingredients. Herbal mixture “Vitalplant,” either in the pulverized or extract form, was added to the basic formulation in amounts of 2, 4, and 6 g/100 g flour basis, respectively. Dough mixing, processing, and baking were performed on laboratory-scale equipment. The basic cookie dough formulation—control sample (sample C) contained 100 g of refined wheat flour, 40 g of vegetable fat, 30 g of powdered sugar, 1 g of salt, and 1 g of baking powder. Before dough preparation, herbal extract was suspended in approximately 5 g of water. The amount of added water was varied from 4.1 to 5.2 g/100 g flour basis to obtain cohesive dough suitable for the production of mold-cut cookies. All ingredients were mixed together in one stage for 15 min in a Diosna (Dierks & Söhne, Maschinenfabrik, Osnabrück, Germany) mixer. The formed dough was packed in polyethylene bags and left to rest 0.5 h at an ambient temperature (22–24ºC). Following the rest time, the dough was sheeted to a final thickness, approximately 5 mm on a pastry break (Stoliatrice mignon CIM, s. r. l., Mestrino [Pd], Italy), and cut out using a rectangular cutter. Dough pieces were baked for 12 min in a deck oven (MIWE, Michael Wenz, D-Arnstein) at 170°C. After cooling, the cookies were placed in polyethylene bags and stored at ambient temperature until further investigation.
Physicochemical Analysis
Water activity was determined using a TESTO 650 device (Germany), and drying at 105°C (AOAC 2000, method 925.10)[Citation18] was carried out for moisture determination. Total nitrogen was determined by Kjeldahl method (AOAC, 2000, method 950.36) and protein was calculated as total N × 6.25 (g/100 g cookie). Fat and starch determination was conducted according to AOAC (2000) methods 935.38 and 996.11. Reducing sugars were determined by Schoorl method (AOAC, 2000, method 80–68). All tests were performed in triplicate and the results were averaged.
Color parameters were measured using a chromameter Minolta, CR-400 (Minolta Co., Ltd., Osaka, Japan) on the top surface of the cookies. Due to the typical lean particle dispersion, color measurements were taken in five areas of cookie (at the center and corners) with a minimum of ten readings per sample and the results were averaged. L*: lightness, a*: red/green and b*: yellow/blue values were determined by the CIELab system.
Textural analysis was conducted using a TA.XTPlus Texture Analyzer (Stable Micro Systems Ltd., Surrey, England, UK), equipped with a 3-point bending rig (HDP/3PB), and a 5 kg load cell. Texture analyzer settings were: mode-measure force in compression; pre-test speed: 1.0 mm/s; test speed: 3.0 mm/s; post-test speed: 10.0 mm/s; distance: 5.0 mm; trigger force: 50 g. Cookie hardness (maximal force at the point of break) and fracturability (distance at break) were determined. Ten measurements per each sample were performed.
Sensory Evaluation
The panel participating in this study was recruited from the stuff of the Institute of Food Technology (Novi Sad, Serbia) with more than ten years of experience in sensory evaluation. This panel contained seven expert sensory assessors (four females and three males, 38–54 years old). A selected expert assessor is able to demonstrate sensory sensitivity and to make consistent and repeatable sensory evaluations of various products. Moreover, an expert assessor has additional experience as specialist in the product, process and/or marketing, and is able to perform sensory analysis of product and evaluate or predict effects of variations relating to ingredients, product formulation, processing, storage, shelf life, etc., in accordance to ISO 2012.[Citation20] In the present study, these experts have sensory experience from performing quality control work with different types of bakery and confectionery products.
The scoring procedure was identical to that applied for assessment of cookies and similar confectionery products in the previous studies.[Citation21] The selected and representative properties were evaluated using a 5-points method and each mark was precisely defined.[Citation22,Citation23] It was appropriate to use score card with 5 points, because the quality levels were precisely defined and differences between scores were not too great, but they were high enough, so that the assessors could distinguish them. Despite the selection of representative properties, it was clear that each selected property does not contribute equally to overall sensory quality. In order to obtain the overall quality, prior to sensory evaluation, the importance coefficients (IC) for each sensory property were standardized and fixed by the experts.[Citation24] The IC were balanced in such a way that their sum equals to 5.0.[Citation25] The obtained marks were multiplied by the following IC: IC = 0.8 for appearance (shape, uniformity, and surface); IC = 1.2 for structure, break, and firmness; IC = 1.0 for chewiness and other textural properties; IC = 0.8 for odor; and IC = 1.2 for taste. By applying the IC a quantitative expression of the total product quality was obtained as the “weighted” mean value of the scores for each evaluated property. Overall quality was determined depending on scores thus obtained: unacceptable (<2.5), good (2.5–3.5), very good (3.5–4.5), and excellent (>4.5). The facilities for sensory analysis fulfilled requirements of ISO 8589.[Citation26] Because this study was not concerned with reproducibility of the experts, but rather their concept of quality, replications were conducted. Drinking water was provided for palate cleansing between each sample. The samples were served in a randomized order according to the XLSTAT software (Addinsoft, New York, NY, USA),[Citation27] and coded with random three-digit numbers.
Statistical Analysis
The significant differences for each parameter between samples were determined with analysis of variance (ANOVA) and the means were compared using Fisher’s test (p < 0.05). Principal component analysis (PCA) was used as a tool for screening, extracting, and compressing sensory and physicochemical data. It is a useful mathematical procedure that transforms a set of possible correlated response variables into a new set of non-correlated variables called principal components. PLSR analysis was used to analyse the relationships between sensory and instrumental data matrices. PLS extracts a few linear combinations (PLS factors) of the instrumental data that predict as much of the systematic variations in the sensory data as possible. All statistical analyses were performed using XLSTAT version 2012.2.02 (Addinsoft, New York, NY, USA)[Citation27] at 5% level of significance.
RESULTS AND DISCUSSION
Physicochemical Analysis
Proximate analysis of cookies made with the addition of medicinal herbs at various levels of enrichments is presented in . ANOVA showed that the majority of measured instrumental parameters were significant in discriminating among the samples (p < 0.05), which supported the usefulness of applying the selected parameters to characterize the quality of the enriched cookies. It is known that cookies are characterized by low moisture content and high level of fat and sugar,[Citation28–Citation30] which can also be noticed from the obtained results (). Moisture contents of the cookies were generally low; values were below 5 g/100 g. The addition of herbal mixture in the form of powder probably caused the samples P_2, P_4, and P_6 to have substantially higher moisture content. In these samples the amount of water needed to achieve a proper dough consistency was higher by 2 g/100 g flour in comparison to extract-contained cookies and this amount of water was kept constant for all cookies enriched with the pulverized herbal blend. This is probably due to the ability of fine herbal particles to absorb water. Finer particles usually exhibit higher water absorption in comparison to coarser particles just because of the surface area factor. However, addition of 6 g/100 g flour of pulverized blend caused a significant reduction in the moisture content (3.67 g/100 g cookies) within the P samples. According to Al-Dmoor,[Citation31] increasing the amount of ingredient able to absorb larger amount of water in cookies can lead to a reduction of the moisture content of the product. After all, the samples made with a pulverized herbal blend were all significantly higher in water content than the control and extract-contained samples. In addition, a significantly higher protein content in the cookies enriched with pulverized herbs might have also contributed to the increased moisture absorption and consequent higher moisture content.[Citation32] On the other hand, the addition of herbal extract did not require changes in the amount of water for dough mixing in all samples. Thus, they were significantly lower (2.28–2.34 g/100 g cookies) in moisture content than the others, including the control (2.51 g/100 g cookies).
TABLE 1 Physicochemical characteristics of enriched cookies
There was a wide variability in the fat content (23.18–26.17 g/100 g cookies) within the cookies. Cookies made with a pulverized herbal blend were lower in fat content, which could be partly attributed to higher moisture content. On the other hand, the water content of the extract-enriched cookies was rather uniform and low, whereas the fat content was increased by increasing doses of added herbal extract.[Citation33] In the cookies made with pulverized herbs, the starch content was decreased due to incorporation of herbal blend in the existing structure of product and the dilution effect. In contrast, the starch content in the extract-enriched samples was uniform, regardless of the entered extract amount. In these samples, there was a free liquid to evaporate (ethanol) and the flour dilution effect was restricted. Sugar content was significantly (p < 0.05) increased in the samples E_4 and E_6, which is probably due to lower moisture content.
According to Sahin and Sumnu[Citation34] most of the biochemical and microbiological reactions are controlled by the water activity (Aw) of the system, which is, therefore, a useful parameter to predict food stability and shelf life. In general, the variations of this parameter represented significant (p < 0.05) differences among samples, classifying them into two groups only with regard to the nature of the herbal supplement, but not in relation to the observed amounts in the formulations. As expected, the samples made with pulverized herbal blend showed higher Aw values in comparison to the extract-enriched and the control samples, which is in agreement with their moisture contents.
Color is very important parameter in evaluation of the properness of cookie baking that not only reflects the suitability of ingredients used for the preparation but also provides information about the formulation and quality of the product.[Citation34] According to Chevallier and co-workers,[Citation35] color of the cookie top surface is under the influence of non-enzymatic browning during the baking process, caused by the reaction between reducing sugars and amino acids, as well as by starch dextrinization and sugar caramelization. Regarding color, the specific additional components with which color was associated in the cookies contributed to the significant differentiation of the enriched cookies to each other and relative to the control sample. The obtained L* values showed significantly (p < 0.05) lighter color (higher L* value) of the control sample (C) and that lightness was decreased significantly (p < 0.05) with the increase in the level of enrichments. On the other hand, the incorporation of different amounts of herbal mixture contributed to an increase in the positive a* (red tonality) and positive b* (yellow tonality) values (). These results were in accordance with previous investigations of other authors,[Citation36–Citation38] who found that the incorporation of different levels of enrichment may lead to a darker top surface and different color characteristics of products.
It is also known that cookies evince a lightly compacted granular structure, where air is entrapped in a number of granules and not uniformly distributed. Addition of sugar, flour, and fat mostly influences the texture changes, but many other ingredients even in small amounts can cause these changes.[Citation39] The obtained results in this study inferred that texture was related to chemical composition of the samples and showed that there were significant differences between the samples in regard to hardness and fracturability (). Cauvain and Young[Citation30] found that during the baking process when the moisture migrates from the wet core to the drier surface it turns the product drier, and the following expansion and contraction cause breakage originating microscopic lines of weakness, influencing its resistance. In accordance with these facts, it could be noticed that the addition of 6% extract, the sample E_6 was significantly softer (p < 0.05) in comparison with the other investigated samples. Considering the obtained results for the moisture and fat content, it can be concluded that their amounts reflected the mechanical properties of cookies. These components were probably considered responsible for the significant differences between the samples with regard to the mechanical characteristics.
Fracturability is certainly one of the most important mechanical characteristics of cookies which is measured as a distance (mm) at the point of break and indicating the resistance of cookies to bend. Smaller distance value denotes higher fracturability. As far as the fracturability of the samples is concerned, statistically significant differences (p < 0.05) between the investigated cookies existed (). The cookies with the addition of pulverized herbal mixture had significantly (p < 0.05) higher values of distances (i.e., lower fracturability) in comparison to the extract-enriched cookies. Cookies with higher sugar content have a cohesive and brittle structure according to Piteira.[Citation40] The obtained results were in agreement with the previously mentioned observation.
Sensory Evaluation
Since the experts were highly familiar with this type of product, they evaluated the samples according to their general concept of the cookie quality, based on their appearance, texture, and aroma (). These properties clearly drove quality for the experts that were determined depending on the scores: unacceptable (<2.5), good (2.5–3.5), very good (3.5–4.5), and excellent (>4.5). Sensory evaluation of the representative properties of cookies, performed by the point-based method, showed that the best scores (>4.5 excellent quality) were obtained for the samples E_6, E_4, and P_4 (). All scores, except for odor and taste indicated very good quality of all perceived cookies. The results in show that the visual aspect of appearance (AP) was evaluated in a similar way, comprehensive with different levels of quality.
TABLE 2 Sensory evaluation of cookies
Although it was possible to easily differentiate between the samples by color caused by different types of addition, the overall appearance perceived by expert panel led to clear differences only between the control sample (C) and the samples with the extract addition at higher concentration level (samples E_4 and E_6). In general, the scores for all sensory properties were higher for the extract enriched cookies than those for the cookies enriched with pulverized herbs. Furthermore, data analysis revealed a statistically significant (p < 0.05) difference between the scores for texture and aroma. It was earlier pointed out that the textural properties of cookies are mainly associated to the moisture and fat content.[Citation41] Based on the panel’s observation, sample P_4 was the hardest within the samples made with herbs in pulverized form. With respect to chewiness, sample P_6 was qualified as the worst (score 3.91).
According to Pereira and co-workers,[Citation41] evaluation of the aroma intensity (odor and taste) involves the perception which is related to ingredients which constitute the sample and their proportion in the cookie formulation being also more or less related to other effects or combined with other effects, such as toasted, vegetable fat, cereal aromas. By observation of , the samples with greater levels of both enrichments were evaluated with significantly (p < 0.05) higher scores for odor and taste compared to the lowest level of enrichment and the control sample. It could be concluded that these properties contributed greatly to the overall assessment of the perceived quality by the panel.
Sensory evaluation showed that the “Vitalplant” mixture in the form of pulvis and extract may be used in cookie formulations as a functional ingredient without producing a substantial negative impact on the overall quality. In some cases, experts’ quality ratings coincide with consumers’ expectations, while in others, consumer preferences are driven in different directions. The majority of researchers agree[Citation42–Citation46] that quality is a multidimensional concept and recognize the importance of the product sensory properties as experienced by both experts and consumers. Although sensory evaluation performed by experts has indicated very good sensory quality of the enriched cookies, the next step in the research should be consumer testing.
PCA of Physicochemical Characteristics and Sensory Descriptors
In PCA procedure, principal components are built to identify and combine variables that are not truly independent and also to maximize the variance of experimental data that can be explained with the grouped variables.[Citation13,Citation47,Citation48] For interpreting the results, PCA was applied and showed a pictorial relationship of the cookies based on their physicochemical and sensory data. In this way, PCA made easy the interpretation of multivariate analysis and in this study was used to identify the physicochemical parameters and sensory descriptors that discriminated best among cookies. The number of PCs was determined on the basis of the relevant information they provided. Conclusions obtained from visual inspection of the PCA plots can be checked by inspecting the numerical data in and 2.
The first PCA was performed on the physicochemical parameters analyzed in the cookies (). The first two principle components, F1 and F2, accounted for 84.04% of total variance (63.54 and 20.50%, respectively). The first component (F1) was characterized by major positive levels of Aw, FR, M, H, and P, and negative levels of chemical components (F, SU, and ST), and color parameters a* and b*. For the second principal component (F2), the variables L* showed high positive, while color parameters a* and b* showed high negative values.
FIGURE 1 (a) PCA plot of physicochemical variables and (b) cookie samples (abbreviation cues are in ).
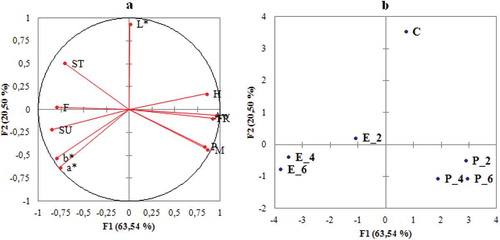
Most of the cookies samples were situated in two zones of the plot (). The first group of the cookies made with pulverized herbs was located in the positive zone of F1 and characterized by moisture and protein content as well as water activity and textural properties (H and FR). The second group of the extract-enriched cookies, E_4 and E_6, was located in the negative zone of F1. This group was mostly correlated with color variables a* and b*. In addition, it can be noticed that the sample E_2 displayed at the center of the plot and that was globally little correlated with the explanatory variables. Sample C was located on the positive side of F2 and correlated with L* variable. Therefore, the L* color scale could be enough to characterize and to separate the control sample compared to the enriched samples.
The data of five sensory descriptors were also analyzed using the PCA (). The first two principal components, F1 and F2, accounted for 94.46% of total variance (48.58 and 41.89 % respectively). The first component (F1) was positively correlated with all sensory descriptors, but mostly with appearance and aroma descriptors. For the second principal component (F2), the descriptors CW and CS showed high and positive correlations, while odor (O) and taste (T) contributed to the negative side of the same principal component (F2).
FIGURE 2 (a) PCA plot of sensory descriptors and (b) cookie samples (abbreviation cues are in ).
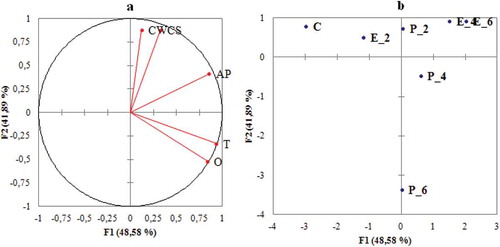
The plot of also shows how the different cookies samples were separated. The samples E_4 and E_6 were separated on the positive side of both PCs, and correlated with CW and CS descriptors. Samples C and E_6 were separated on the negative side of F1. The samples E_4 and P_2 were located on the positive while the samples P_4 and P_6 were located on the negative side of F2. With increasing enrichment, especially in the case of a pulverized herbal blend, an expressive positioning of samples with regard to the second component can be noted. PCA performed on the physicochemical data suggested that cookies produced with the same enrichments were more similar. On the other hand, PCA performed on the sensory data showed that with increasing enrichment levels, especially with the pulverized mixture, there was a larger separation between the samples.
Regression Analysis Between Physicochemical Characteristics and Sensory Descriptors Using PLSR
The PLS technique[Citation49,Citation50] was used to examine the physicochemical and sensory data collected during the trials to study the effect of herbal mixture additions on cookie quality. For better revelation of the relationship between sensory and physicochemical variables, prior to PLS analysis, data were standardized to get all data in approximately the same scaling. The purpose of PLS was to establish which physicochemical measurements are mainly related to the total product quality obtained as the ‘weighted’ mean value (WMV).
The Q2 parameter, which measures the global goodness-of-fit and predictive quality of models, was cumulated and it indicated how many components generated by the PLS regression summarized well both the Xs and Ys. PCA applied to the entire data set (X and Y) and XLSTAT-PLS gave automatically selected five components. With numerous and correlated X-variables there was a substantial risk for “over-fitting” and getting a well-fitting model with little or no predictive power. The number of degrees of freedom was also low (df = 1) and it could be facing an over-fitting problem. For that reason, a strict test of the predictive significance of each PLS component was necessary and cross-validation was a practical and reliable tool to test this predictive significance.[Citation18,Citation49] Consequently, cross-validation was used to determine the number of components to include in the analysis, and this was done in turn for each observation. A prediction error could then be calculated. The number of PLS components used in the analysis of all the data was based on that number of PLS components with the smallest prediction error sum of squares. It can be noticed that the cumulated Q2 corresponding to this model reached its maximum value with two components, and it was likely that the model with only two components would be better. The two obtained significant components explained R2 = 92.7% and predicted Q2 = 78.0% of the data variation. A biplot of the products and their characteristics was obtained with XLSTAT program and the relation of physicochemical and WMV values testified the existence of a relationship between them. shows the relationship between WMV and physicochemical data using PLSR when predictive variables are inter-correlated.[Citation51]
FIGURE 3 Scores and loadings plot obtained by the PLS model of the cookies (abbreviation cues are in and 2).
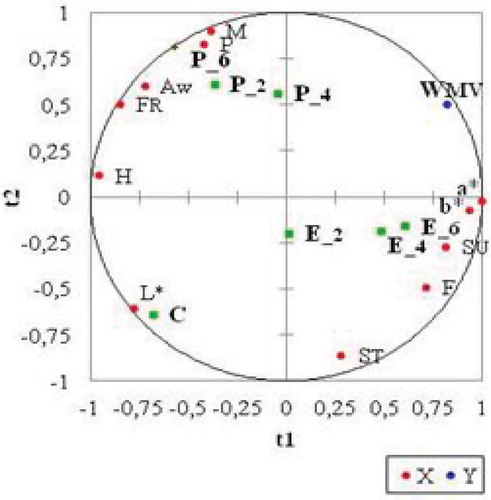
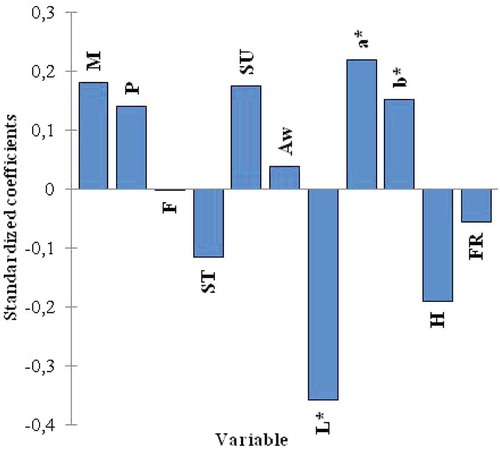
FIGURE 4 Estimated regression coefficient for predicting weighted mean value (WMV; abbreviation cues are in ).
From it can be noticed that WMV was satisfactorily predicted by color parameters a* and b*. In addition, WMV was associated to the samples E_4 and E_6. According to the loading weight, this samples were mainly predicted by color parameters a* and b*, and sugar (SU) and fat (F) content. Compounds that mostly did not contribute to the building of this term were lightness (L*), moisture content (M), and textural properties (H and FR). The L* variable was mainly associated with the control sample. Furthermore, in this model the samples P_2 and P_6 were highly dependent on moisture and protein content, as well as water activity (Aw), the effect being more intense in the presence of plant mixture enrichments.
In addition, Fig. 4 displays the estimated PLS regression coefficients for the scaled explanatory variables. These coefficients are used to predict the sensory variable from the explanatory variables and can be thought of as the directions in the explanatory variable space that result in the largest increase in the sensory variable.[Citation50,Citation52]
Two PLS components have been fitted and the following chart corresponded to the standardized coefficients of the new model. In the variation of WMV, L* lightness, a* tonality, and hardness were the most important factors followed by moisture and sugar content, as well as b* tonality. The figure also shows that fat variable was little useful for predicting WVM. As expected, it can be noticed that L* and H variables were negatively related to WMV, while FR and ST had little effect. Of all positive variables, a* variable had the greatest effect on WMV.
CONCLUSIONS
The present work allowed drawing some general conclusions that enabled the comparison of seven different cookies analyzed. The use of medicinal herb composite in the production of cookies with improved physicochemical and sensory properties without adversely affecting most quality characteristics is possible. This work aimed to improve our understanding of the instrumentally determined characteristics and sensory attributes of cookies enriched with medicinal herbs, in order to find relationships between the two analyses. Instrumental methods showed to be excellent tools to evaluate physicochemical characteristics of the enriched cookies. The selected physicochemical methods could be used in future studies to evaluate more differently enriched cookies, to create models and to investigate the predictability of sensory quality. PCA performed on the physicochemical data suggested that the cookies produced at the same enrichment levels were more similar. PCA was also performed on the sensory data and showed that with increasing levels of enrichment, especially that of the pulverized blend, there was a larger separation between the samples. PLS regression results showed that the cumulated Q2 corresponding to the model prediction reached its maximum value with two components. Two PLS components have been fitted and the generated chart corresponded to the standardized coefficients of the new model. In the variation of WMV, L* lightness, a* tonality, and hardness were the most important factors followed by moisture and sugar content, as well as b* tonality. Medicinal herbs, in the powder and extract forms, can be considered not only as functional, but also as sensory quality ingredients for cookie products. The findings of this study could be applied by practitioners in confectionery industry to develop and optimize a formulation of enriched cookies to better meet functional consumer requirements and expectations. In addition, further research, investigating how each of the physicochemical characteristics discussed in this study influences consumer acceptance of cookies, would give an insight into which attributes require more attention when selecting a test to predict sensory quality of cookies enriched with medicinal herbs.
FUNDING
This work is a part of the Project (TR31029) supported by the Ministry of Education, Science and Technological Development, Republic of Serbia and the Project (114-451-4382) supported by the Provincial Secretariat for Science and Technological Development, Autonomous Province of Vojvodina, Republic of Serbia.
Additional information
Funding
Related Research Data
REFERENCES
- Dillard, C.J.; German, J.B. Phytochemicals: Nutraceuticals and Human Health. Journal of the Science of Food and Agriculture 2000, 80, 1744–1756.
- Sharma, V.J.; Patel, P.M. Evaluation of Antibacterial Activity of Methanolic Extract Of Plant Rivea Ornata. International Journal of Pharmaceutics 2013, 4, 233–234.
- Mišan, A.; Mimica-Dukić, N.; Mandić, A.; Sakač, M.; Milovanović, I; Sedej, I. Development of a Rapid Resolution HPLC Method for the Separation and Determination of 17 Phenolic Compounds in Crude Plant Extracts. Central European Journal of Chemistry 2011, 9, 133–142.
- Mišan, A.; Mimica-Dukić, N.; Sakač, M.; Mandić, A.; Sedej, I.; Šimurina, O.; Tumbas, V. Antioxidant Activity of Medicinal Plant Extracts in Cookies. Journal of Food Science 2011, 76, 1239–1244.
- Šarić, L.J.; Čabarkapa, I.; Beljkaš, B.; Mišan, A.; Sakač, M.; Plavšić, D. Antimicrobial Activity of Plant Extracts from Serbia. Food Processing, Quality and Safety 2009, 36, 1–6.
- Krutulyte, R.; Costa, A.I.; Grunert Klaus, G. A Cross-Cultural Study of Cereal Food Quality Perception. Journal of Food Products Marketing 2011, 15, 304–323.
- Verbeke, W.J.; Scholderer, J.; Lähteenmäki, L. Consumer Appeal of Nutrition and Health Claims in Three Existing Product Concepts. Appetite 2009, 52, 684–692.
- Laguna, L.; Sanz, T.; Sahi, S.; Fiszman, S.M. Role of Fibre Morphology in Some Quality Features of Fibre-Enriched Biscuits. Journal of Food Properties 2014, 17, 163–178.
- Glanz, K.; Basil, M.; Maibach, E.; Goldberg, J.; Snyder, D. Why Americans Eat What They Do: Taste, Nutrition, Cost, Convenience, and Weight Control Concerns as Influences on Food Consumption. Journal of American Dietetic Association 1998, 98, 1118–1126.10.
- Kemp, S.E.; Hollowood, T.; Hort, J. Sensory Evaluation—A Practical Handbook; John Wiley & Sons, Ltd. Oxford, UK, 2009.
- Stone, H.H.; Sidel, J. Quantitative Descriptive Analysis: Developments, Applications, and the Future. Food Technology 1998, 52, 48–52.
- Lawless, H.T.; Heymann, H. Sensory Evaluation of Food: Principles and Practices; Springer: New York, NY, 1998.
- Pereira, R.B.; Bennett, R.J.; Luckman, M.S. Instrumental and Sensory Evaluation of Textural Attributes in Cheese Analogs: A Correlation Study. Journal of Sensory Studies 2005, 20, 434–453.
- Nguyen, T.H.D.; Wang, X.C. Volatile, Taste Components and Sensory Characteristics of Commercial Brand Oyster Sauces: Comparisons and Relationships. International Journal of Food Properties 2012, 15, 518–535.
- Toscas, P.J.; Shawb, F.D.; Beilken, S.L. Meat Partial Least Squares (PLS) Regression for the Analysis of Instrument Measurements and Sensory Meat Quality Data. Meat Science 1999, 52, 173–178.
- Bastien, A.P.; Vinzib, V.E.; Tenenhaus, C.M. PLS Generalised Linear Regression. Computational Statistics & Data Analysis 2005, 48, 17–46.
- Tenenhaus, M.; Pagès, J.; Ambroisine, L.; Guinot, C. PLS Methodology to Study Relationships Between Hedonic Judgements and Product Characteristics. Food Quality and Preference 2005, 16, 315–325.
- Wold, S.; Sjöstroöm, M.; Eriksson, L. PLS-Regression: A Basic Tool of Chemometrics. Chemometrics and Intelligent Laboratory Systems 2001, 58, 109–130.
- AOAC International. Official Methods of Analysis of AOAC International 17th ed.; Association of Official Analytical Chemists: Arlington, Virginia, 2000.
- ISO 8586. Sensory analysis—General Guidelines for The Selection, Training and Monitoring of Selected Assessors and Expert Sensory Assessors; International Organization for Standardization: Geneva, Switzerland, 2012.
- Sedej, I.; Sakač, M.; Mandić, A.; Mišan, A.; Pestorić, M.; Šimurina, O.; Čanadanović-Brunet, J. Quality Assessment of Gluten-Free Crackers Based on Buckwheat Flour. LWT–Food Science and Technology 2011, 44, 694–699.
- Pajin, B. Technological Quality of Sunflower for Its use in Confectionery Products. M.Sc. Thesis, Faculty of Technology, University of Novi Sad, Novi Sad, Serbia, 2000. ( in Serbian)
- Sikora, M.; Kowalski, S.; Krystyjan, M.; Krawontka, J.; Sady, M. Optimization of Cornstarch/Xanthan Gum Content for Thickening of Cocoa Syrups. Journal of Food Quality 2007, 30, 682–702.
- Popov-Raljić, J.; Laličić-Petronijević, P. Sensory Properties and Color Measurements of Dietary Chocolates with Different Compositions During Storage for up to 360 Days. Sensors 2009, 9, 1996–2016.
- Pajin, B. Practicum in Technology of Confectionery Products; Faculty of Technology: Novi Sad, Serbia, 2009.
- ISO 8589. Sensory Analysis—General Guidance for the Design of Test Rooms; International Organization for Standardization: Geneva, Switzerland, 2007.
- XLSTAT version 2012.2.02 Addinsoft, New York, NY. Retrieved from http://www.xlstat.com/
- Manley, D. Biscuit, Cookie, and Cracker Manufacturing: Manual 1- Ingredients; Woodhead Publishing Limited: Cambridge-England, 1998.
- Manley, D. Technology of Biscuits, Crackers, and Cookies, 3rd Ed; Woodhead Publishing Limited and CRC Press LLC: Cambridge-England, 2000.
- Cauvain, S.; Young, L. Productos de Panaderia: Ciencia, Tecnologia y Pratica; Editorial Acribia, S. A.: Zaragoza-Espana, 2006.
- Al-Dmoor, H.M. Cake Four: Functionality and Quality. European Scientific Journal 2013, 9, 166–180.
- Zucco, F.; Borsuk, J.; Arntfield, S.D. Physical and Nutritional Evaluation of Wheat Cookies Supplemented with Pulse Flours of Different Particle Sizes. LWT–Food Science and Technology 2011, 44, 2070–2076.
- Innocenzi, P.; Malfatti, L.; Costacurta, S.; Kidchob, T. Evaporation of Ethanol and Ethanol-Water Mixtures Studied by Time-Resolved Infrared Spectroscopy. Journal of Physical Chemistry 2008, 112, 6512–6516.
- Sahin, S.; Sumnu, S.G. Physical Properties of Foods; Springer: New York, NY, 2006.
- Chevallier, S.; Colonna, P.A.; Della Valle, G.; Lourdin, D. Contribution of Major Ingredients During Baking of Biscuit Dough Systems. Journal of Cereal Science 2000, 3, 241–252.
- McWaters, K.H.; Ouedraogo, J.B.; Resurreccion, V.A.; Hung, Y.C.; Phillips, R.D. Physical and Sensory Characteristics of Sugar Cookies Containing a Mixture of Fonio (Digitaria exilis) and Cowpea (Vigina unguiculata) Flours. International Journal of Food Science and Technology 2003, 38, 403–410.
- Singh, M.; Mohamed, A. Influence of Gluten-Soy Protein Blends on the Quality of Reduced Carbohydrates Cookies. LWT–Food Science and Technology 2007, 40, 353–360.
- Sudha, M.L.; Srivastava, A.K.; Vetrimani, R.; Leelavathi, K. Fat Replacement in Soft Dough Biscuits: Its Implication on Dough Rheology and Biscuit Quality. Journal of Food Engineering 2007, 80, 922–930.
- Zoulias, E.I.; Oreopoulou, V.; Tzia, C. Textural Properties of Low-Fat Cookies Containing Carbohydrate or Protein-Based Fat Replacers. Journal of Food Engineering 2002, 55, 337–342.
- Piteira, M.F.C. Alimentos Funcionais: Incorporacao de Fibras em Bolachas [Functional Foods: Incorporation of Fibers into Biscuits]; Doutoramento em Engenharia Agro-Industrial, Universidade Tecnica de Lisboa Instituto Superior de Agronomia: Lisboa, Portugal, 2005.
- Pereira, D.; Correia, P.M.R.; Guine, R.P.F. Analysis of the Physical-Chemical and Sensorial Properties of Maria Type Cookies. Acta Chimica Slovaca 2013, 6, 269–280.
- Noble, K.G.; McCandliss, B.D. Reading Development and Impairment: Behavioral, Social, and Neurobiological Factors. Journal of Developmental and Behavioral Pediatrics 2005, 26, 370–378.
- Guinard, J.-X.; Brun, P. Sensory-Specific Satiety: Comparison of Taste and Texture Components. Appetite 1998, 31, 141–157.
- Cliff, M.A.; King, M. Use of Principal Component Analysis for the Evaluation of Judge Performance at Wine Competitions. Journal of Wine Research 1999, 10, 25–32.
- Gawel, R.; Godden, P.W. Evaluation of the Consistency of Wine Quality Assessments from Expert Wine Tasters. Australian Journal of Grape Wine Research 2008, 14, 1–8.
- Pankaj, S.; Velu, V.; Indrani, D.; Singh, R.P. Effect of Dried Guduchi (Tinospora cordifolia) Leaf Powder on Rheological, Organoleptic, and Nutritional Characteristics of Cookies. Food Research International 2013, 50, 704–709.
- MacFie, H.J.; Hedderley, D. Current Practice in Relating Sensory Perception to Instrumental Measurements. Food Quality and Preference 1993, 4, 41–49.
- Hair, J.F.; Anderson, J.; Tatham, R.L.; Black, W.C. Multivariate Data Analysis; Prentice Hall: Englewood Cliffs, NJ, 1998; 442–466.
- Martens, H.; Martens, M. Multivariate Analysis of Quality. An Introduction; Wiley: Chichester, UK, 2001.
- Martens, M.; Martens, H. Partial Least Squares Regression. In Statistical Procedures in Food Research; Piggott J. R. Ed.; Elsevier Applied Science: London UK, 1986.
- Tang, C.; Heymann, H.; Hsieh, F. Alternatives to Data Averaging of Consumer Preference Data. Food Quality and Preference 2000, 11, 99–104.
- Smith, M.F.; Leighon, C.S.; Morey, L.; Schonfeildt, H.C. Application of Partial Least Squares Regression to Relate Tastiness of Boiled Potatoes to Chemical and Physical Tests. South African Journal of Plant Soil 2009, 26, 31–35.