
Abstract
The parallel capacitances and resistances of the bulk canola seeds were measured to determine the dielectric properties of canola seeds using a radio frequency dielectric fixture at different levels of temperature (30–80°C) and moisture content (5–11% w.b.), over the frequency range of 5 to 30 MHz. The dielectric constant (ε′) increased from 3.82 to 7.85 with increasing temperature and decreasing frequency regardless of the seed moisture contents. The dielectric loss factors (ε”) of the bulk seeds increased with increasing temperature and moisture content and decreased with frequency, ranging between 0.11 and 13.0. The penetration depth of the electromagnetic power in the bulk seeds varied from 1.30 to 48.0 m depending upon temperature, frequency, and moisture content. The distinct correlation of sensitivity of dielectric properties with moisture content was not observed except for that of penetration depth. The dielectric properties of the bulk canola seeds were higher than those of other oil seeds at various moisture contents; it might be affected by relatively higher linolenic acid content among other fatty acids. The large difference of the dielectric loss factors of insect pests cf. those of canola seeds showed potential for radio frequency disinfestation based on selective heating of insect pests in the canola seeds. The dielectric properties determined can be used for simulating temperature distribution within the bulk canola seeds during the radio frequency process.
INTRODUCTION
Approximately 85% of canola produced in Canada is exported to markets around the world, exports with values in the billions of dollars. Canadian canola industries (worth $983 million) processes canola seed into meal and oil, which are subsequently used for manufacturing many other products. The contribution of canola to the Canadian economy is $15.4 billion each year including more than $8.2 billion in wages, and 228,000 Canadian jobs.[Citation1]
The average annual losses of oilseed production due to pest insect damage range from 8 to 10% causing millions of dollars in damage.[Citation2] Fumigation with methyl bromide has been widely used to disinfest various insect pests found in the oilseeds and cereal grains as it has been regarded as the most practical method for disinfestation. However, this method is environmental unfriendly and health hazardous and may leave an excessive insecticide residue in the treated products.[Citation3]
Conventional disinfestation methods of fumigation that use methyl bromide were banned since the Montreal Protocol of 1987[Citation4] and subsequent amendments because of its destructive effect to the ozone layer.[Citation5] Researchers have applied other conventional treatments such as ionizing radiation, hot air, and controlled atmosphere or cold storage as possible substitutes for the chemical treatments, however, all of these methods still leave definite room for further improvement.
One of the alternative treatments for disinfestation is radio frequency (RF) heating, one of the several EM (electromagnetic)-based electrical heating methods. The key advantage of RF heating over the thermal gradient driven conventional heating methods is that it produces a fast volumetric heating. As a result, this method has been thought as a way to overcome the problems with conventional thermal disinfestations techniques.[Citation6] Jiao et al.[Citation7] have shown significant reduction in treatment time using RF heating compared to existing heating methods. Because of the larger penetration depth of RF waves (on the order of meters), higher volume of grains could be disinfested as needed for the grain handling industries. Another important advantage of RF heating is the selective heating of the insect pests, in which the insects in grains would be destroyed at the temperatures lethal to them with a minimal or tolerable thermal degradation to the grain qualities. Although the frequency is the same, the and
for the insect and grain are different as these dielectric properties depend on various material properties such as concentration of ion, moisture content (MC), and density. If the ion concentration and MC of the insect are higher than those of the grain, RF heating can be very effective for disinfestations. Further, the grains can be efficiently dried to a desired level while it is being disinfested.
The objectives of this study were (1) to measure and analyze the dielectric properties of the bulk canola seeds at various temperatures, MCs, and frequencies, (2) to analyze dielectric dependence on fatty acids, (3) to determine the penetration depth of EM energy in bulk canola seed, (4) to develop regression models of the dielectric properties, and (5) to demonstrate a feasibility of RF disinfestation based on selective heating.
MATERIALS AND METHODS
Theory
The permittivity of a dielectric material, is defined as[Citation8]:
where, The (dielectric constant) represents the polarization of a material, or the ability of a material to store electrical energy or charges within the applied EM field. The
(dielectric loss factor) expresses quantity of heat dissipation that results from the conduction loss of charges, and dipolar or ionic losses, in other words the ability of the material to dissipate the electrical energy into heat energy compared to vacuum. Generally, dipole rotation loss (εd″) are and ionic conduction loss (εσ″) summed to the total ε″,
. The penetration depth of an EM wave within dielectric materials is determined by the frequency, and the dielectric properties of the material in free space.[Citation9] The following equation was used to estimate
[Citation10]
where, c = the speed of light in free space (),
= the dielectric constant,
= the dielectric loss factor, and
= the frequency (Hz). The ratio of temperature increment rate of insect to that of canola seed was also estimated following the procedure described by Von Hippel.[Citation10] The average power generated inside a material was calculated as shown in Eq. (3).[Citation8]
where, = the average power density (W m-3), ε° = vacuum permittivity (8.85 × 10⁻¹² F m−1) Cp = the specific heat of the material (J kg–1
–1),
= the bulk density of the material (kg m−3), E = the electric field strength (V m–1), f = the frequency (Hz),
= the rate of temperature increase. The power dissipation ratio (
) of insect (
) to canola seed (
) at 27.12 MHz was described using Eq (4) as follows:
where, = the electric field strength within insect bodies (V m–1),
= the electric field strength within canola seeds (V m–1),
= the loss factor of the insect,
= the loss factor of the canola seed. Electric field strength (E) within materials was estimated with a theoretical model Eq. (5), derived from basis of interaction of EM waves.[Citation11]
where, and
are the permittivity of the host and guest material. (i.e., grain and insect, respectively) Eq. (5) was transformed into Eq. (6) based on assuming both the canola seed and insect are homogeneous dielectrics, and the spherical shape of insect is surrounded by air.
was a substitute of
for low loss materials (
) in Eq. (6) with an acceptable error in
. The ratio of temperature increment rate of insect to that of canola seed depicted as
was derived from Eqs. (3) and (4) as shown in Eq. (7).
where, ()i = the rate of temperature increase of insect (
s–1), (
= the rate of temperature increase of canola seed (
s–1),
= the density of insect (kg m−3),
= the density of canola seed (kg m–3),
= the specific heat of insect (J kg–1
–1),
= the specific heat of canola seed (J kg–1
–1). Based on the above equations, a selective heating effect can be maximized depending on the values of
and
/
.
Materials
Top quality canola seed (B. napus L.) at initial MC of 9% was supplied by industrial partner Viterra Inc., Regina, SK, Canada. The dielectric properties, specific heat, and densities of rusty grain beetle (C. ferrugineus S.) as a function of temperature and MC were obtained from Shrestha and Baik. However, the effect of temperature on densities of rusty grain beetle seemed negligible, and the densities were, therefore, measured by Von Hippel at room temperature.[Citation10]
Sample Preparation
A standard method[Citation12,Citation13] was used to determine the MC of the bulk canola seeds. To calculate the average initial MC, seeds weighing 10 g were poured into each of five aluminum moisture dishes followed by placing them in a hot air oven—Despatch, Despatch Industries, MN, USA for 24 h at 103°C. The samples of the canola seeds were prepared at different MCs, 5, 7, 9, and 11% wet weight basis (weight of water/sample weight × 100%) separately. Samples of the canola seeds at 5 and 7% were prepared by drying a known mass of canola seeds at initial MC (9%) to the pre-calculated weight in a hot air oven set up at 40°C. Samples at 11% MC were prepared by spraying a pre-calculated amount of distilled water on known mass of the seeds at initial MC contained in a glass jar. The jar was constantly and manually shook and rotated while spraying with water. The air-tight jars were left at room temperature (23°C) for 3 days with periodic tumbling to achieve an equilibrium MC followed by cold storage (4°C) until used. A digital scale with an accuracy of ± 0.01 g (Symmetry, PR4200, Cole-Parmer Instrument Co., IL, USA) was used for all weighing. The samples from the cold storage were left at room temperature for 1 h and the final MC of samples were checked before using them.
Specific Heat, Densities, and Porosity of Canola Seeds
A differential scanning calorimeter (DSC; Q2000, TA Instruments, Inc., New Castle, Del) was used to measure heat capacity of the materials. A hermetically sealed aluminium pan including about 10 mg (0.01 mg) of sample was loaded into the DSC along with an identical blank aluminium pan for reference. Heating rate was kept constant at 5°C min–1. Heat capacities of canola seeds at MCs of 5, 7, 9, and 11% were measured at 30 to 75°C. All data were obtained from five replicates. The bulk density of canola seeds was calculated by measuring mass of known volume of bulk canola seeds in a precision steel cylinder of known volume (500
0.5 mL). The mass of bulk canola seeds was measured after leveling out the top surface with a steel cylindrical bar. An average of five replicates was used.
To determine particle density, a gas pycnometer (QuantaChrome Multipycnometer, QuantaChrome Corporation, Boynton Beach, FL, USA) was used. A certain mass of the seeds was poured into a large cell after calibration of the meter. Nitrogen gas flowed into the reference cell until the pressure reached to about 17 psig. Then, nitrogen gas was allowed to flow between the reference cell and the large cell containing the canola seeds. The initial gas pressure decreased to a new lower equilibrium pressure depending on the volume of the canola seeds based on the Archimedes principle. A gas equation was applied to calculate the particle volume using the initial and final pressures, and the known volumes of the reference and sample cells. The porosity of bulk canola seeds was calculated as:
where, ρb is bulk density and ρp is particle density.
Dielectric Properties
The capacitance (Cp) and the resistance (Rp) of bulk canola seeds at different MCs, temperatures, and frequencies were measured using a dielectric test fixture (DTF; 16452, Agilent Technologies, Palo Alto, CA), a computer controlled precision LCR (Inductance, Capacitance, and Resistance) device (4208A, Agilent Technologies, Palo Alto, CA), and other peripheral devices as shown in . To increase the sample volume, and thereof to minimize experimental error, all factory supplied spacers (thicknesses of 1.3, 1.5, 2, and 3 mm) were stacked together () to obtain a maximum volume of 16.4 mL.[Citation14] The ε of known air (low loss) to water and ethanol media (lossy) was measured using both 3 mm and 7.8 mm spacers (normal and modified fixtures) for the calibration of the system in measuring the Cp and Rp.[Citation15] The largest volume of the liquid fixture otherwise would be 6.8 mL using the 3 mm-spacer.
FIGURE 1 (A) the DTF filled with canola seeds; (B) bottom half of DTF with new spacer on top; and (C) gently closed the DTF using top and bottom halves with canola seed inside.
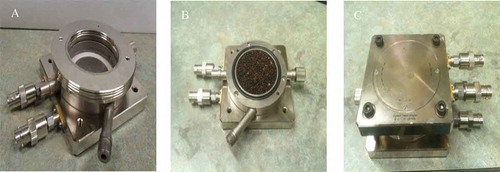
All the parts of the fixture two O-rings, top and bottom halves of the fixture, and spacers, were washed with warm soap water, rinsed using distilled water, and then dried completely before using them. Using the known volume of the fixture, an amount of the canola seeds was calculated from the seed bulk density, and was poured into the fixture so that it is filled completely with several gentle taps to remove voids as much as possible, then closed tightly (). The tightly closed fixture was visually inspected to make sure that the top and the bottom halves of the fixture were leveled along the spacer without leaving any uneven gaps assuring the two electrodes were parallel each other.
From the preliminary experiments, it was found that 1 h was sufficient to increase the sample temperature from 23°C to any target temperatures up to 80°C in the temperature and humidity chamber (Espec, SH-641, Espec Corp., Japan) with an accuracy of ± 0.1°C. The humidity function of the chamber was turned off. The four BNC female connectors of the fixture containing the canola seeds were connected to corresponding male connectors of 1 m 4-terminal BNC cable (16452–61601, Agilent Technologies, Palo Alto, CA) followed by placing it on the chamber shelf. The other ends were connected to the LCR device. To minimize biased error of the LCR device, it was calibrated following the manufacturer’s user guide.[Citation15] The random error of the system ranges 3 to 28%, depending upon the frequency and temperature.[15] The measured Cp and Rp were used to calculate and
of the test bulk seeds using Eqs. (9) and (10). All data were obtained using the same batch of canola seeds. To minimize the random error, an average of five replicates was used throughout this work unless otherwise mentioned.[Citation15]
where, ε' = dielectric constant, d = distance within two electrodes (m), Cp = parallel capacitance (F), A = electrode area (m2), εo = air permittivity, 8.85 × 10⁻¹² (F/m), ε'' = dielectric loss factor, f = frequency (Hz), and Rp = parallel resistance (Ω).
Penetration Depth (Pd)
Penetration depth is an important parameter to evaluate heating uniformity within materials, and to design efficient EM heating units. Penetration depth in the bulk canola seeds at different MCs, temperatures, and frequencies were calculated according Eq. (3).[Citation9] An average of five replicates was used.
Statistical Analysis
The mean values and the standard deviations (SD) of the measured dielectric properties were calculated. The effects of MC, frequency, and temperature on the dielectric properties of the bulk canola seeds were investigated using the factorial design. The modeling was performed using the stepwise regression analysis in SPSS 20.0 (SPSS Inc., Chicago, IL, USA).The regression model derived from experimental data using SPSS Statistics 20.0 (SPSS Inc., Chicago, IL, USA) was used to estimate relative sensitivities of the outputs (calculated values from the regression model) of dielectric properties and penetration depth to temperature at various MCs at 27.12 MHz. It was described as the ratio of the percent variation of output (dielectric properties) to that of input (temperature) with different MCs. The percent variation of output and input was calculated as Eq. (11). The dielectric properties at 55°C and the average temperature (55°C) were used as the reference output and input.
RESULTS AND DISCUSSION
Density and Porosity of Canola Seeds
Measured bulk and particle densities and calculated porosities as functions of temperature and MC were listed in . In general, both densities decreased with temperature. Increased particle size of canola seed increased the volume of air voids and decreased the mass of canola seeds due to the evaporation of moisture resulting in decreasing densities. The bulk and particle densities ranged from 655 to 670 kg·m–3 and 1064 to 1137 kg·m–3, respectively. The porosity of bulk canola seeds ranged from 38.29 to 41.63. It decreased with temperature and MC due to decreased ration of ρb to ρp.
Dielectric Constant ( ) of Canola Seeds
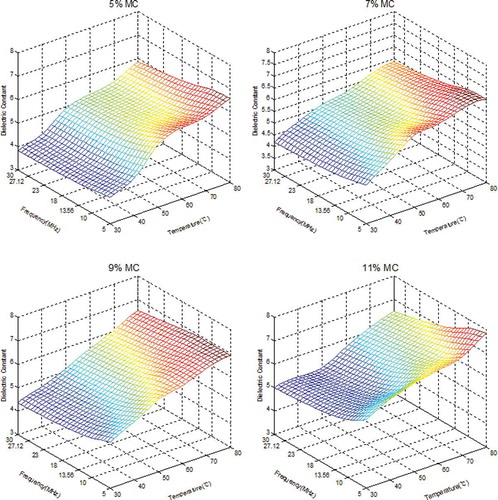
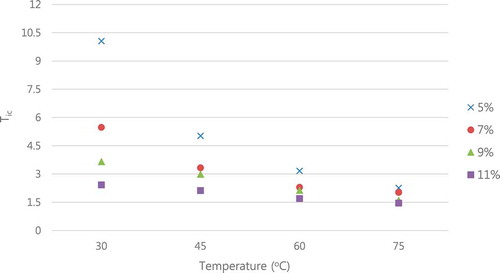
shows the dielectric constant () of bulk canola seeds as a function of frequency, and temperature for four levels of MCs. The
decreased almost linearly with increasing frequency for all MCs. It was attributed to rapidly alternating EM fields at higher frequencies significantly diminishing reorientation of the dipoles, distortion of ionic bonds, and the interfacial polarization mechanism within the test material resulting in less polarization.[Citation16] This phenomenon was in agreement with the Debye’s equation[Citation17] which indicates the decrease of the
with increasing frequency. Pace et al.[Citation18] also observed a similar trend, in which a sharp decrease of the
was observed with further increase of the frequency after general plateau from 1 kHz to 10 MHz. The
increased with increasing temperature at different MCs. It was attributed to increased level of dielectric dispersion because of higher ionic conductivity at higher temperatures.[Citation19] Ionic conductivity normally increases with increasing temperature[Citation20] The
increased with MC at different frequencies and temperatures. The added moisture enhanced the ionic, and dipole polarizations in the bulk canola seeds resulting in increasing storage of electrical charges under the applied EM field. As expected, the
at 11% MC was higher than that of any other MCs at any given frequencies and temperatures. The values for dielectric constant ranged from 3.82 to 7.85.
FIGURE 2 Frequency, temperature, and MC dependence of ε′ of the bulk canola seeds.
Dielectric Loss Factor () of Canola Seed
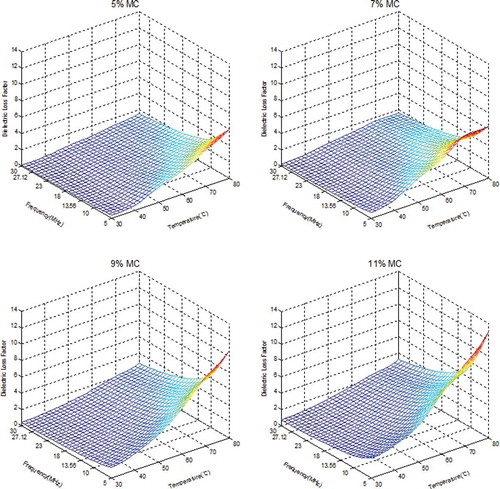
illustrates the dielectric loss factor () of the bulk canola seeds as a function of frequency and temperature at four levels of MC. The
decreased with increasing frequency with a dramatic drop to over 50% at 5 MHz to 13.56 MHz regardless of temperature and MC. Diminishing movements of the dipoles and ions due to the rapidly alternating EM fields with increasing frequency resulted in lower ionic conductivity and less conservation of EM energy to heat, consequently decreasing its values. Further increase of frequency to 30 MHz exhibited almost linear decrease of the
. The
decreased from 13.03 to 0.112 corresponding to increasing frequency for all MCs, and it almost linearly increased in proportion to increasing temperature and MC. The increased loss factor at higher temperature was attributed to higher oscillation of the dipoles and movement of the ions resulting from higher thermal agitation of the molecules and ions.[Citation20–Citation23] The ionic conductivity also mainly affects the
at low frequency range below 200 MHz.[Citation22,Citation24] The
is composed of ionic loss and dipole loss. Ionic loss is caused by migration of ions, and dipole loss by the rotation of water dipoles within alternating electric field. Therefore, the lower viscosity has improved movements of ionic and dipolar enhancing the
. The
was enhanced by increasing number of dipoles and free ions in the moisture.
FIGURE 3 Frequency, temperature, and MC dependence of ε” of the bulk canola seeds.
Penetration Depth (Pd)
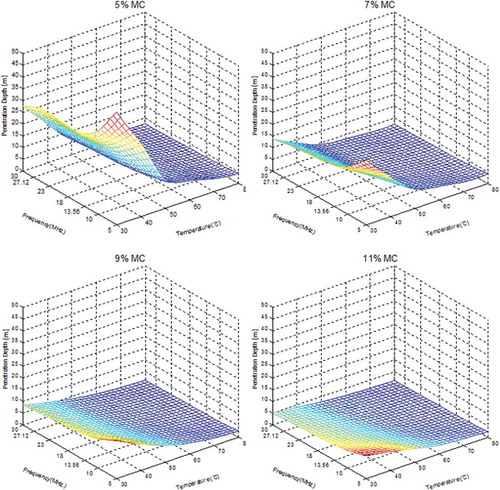
The penetration depths decreased with frequency, temperature and MC as shown in . As explained earlier, the dielectric properties increased with temperature and MC. But, the rapid increase of compared to
increased the values of ε″/ε′ resulting in decreasing penetration depths. The values for Pd ranged from 1.30 to 48.0 m. A maximum feasible electrode gap (less than 1.30 m) and sample size in designing the application chamber can be suggested from the results of Pd for uniform RF treatment for disinfestation of canola seeds.
FIGURE 4 Electromagnetic power penetration depths in the bulk canola seeds as a funtion of temperature, MC, and frequency.
Statistical Analysis and Models
Regression models for the prediction of the and
are given by Eqs. (12) and (13). The statistical data, R2, RMSE, p-value, and DF for errors are presented in .
where, ,
, T = temperature (°C), MC = MC (%), f = frequency (MHz). Based on the p-value of each component, the
of the bulk canola seeds seems to be affected more by MC and temperature, while MC and frequency seem to most affect
. Although the p-values of MC and temperature are greater than 0.05 they were included in the regression models considering their theoretical and reported effects.[Citation14] The higher values of R2, lower values of RMSE, and p-values < 0.0001 of the models confirmed that these equations could be used to predict the dielectric properties of bulk canola seed. These developed regression models also will be applied to dynamic simulation of selective heating.
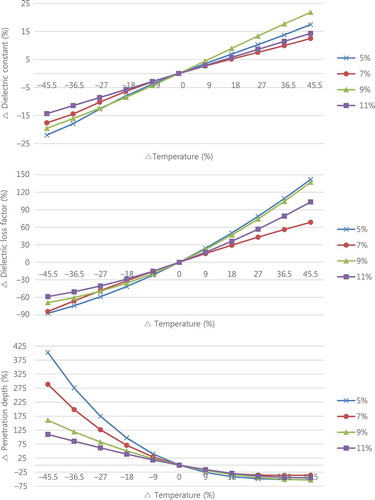
Sensitivity Analysis
indicates sensitivity of dielectric properties and penetration depth as a function of temperature at various MCs at 27.12 MHz in percentage. The distinct correlation of the sensitivity of dielectric properties with MC was not observed except that of penetration depth. The relatively more sensitive dielectric constants of canola seeds were observed at 9% MC with increasing temperature and at 5% MC with decreasing temperature from reference temperature (55°C) compared to those at the other MCs. The sensitivities of of canola seeds at 9 and 5% MC were around 1.7 and 1.5 times higher than those observed at 7 and 11% MC and at increased and decreased temperatures (± 45.5%). The dielectric loss factors of canola seeds at 5% MC were observed to be relatively more sensitive. The sensitivities of
of canola seed at 5% MC were approximately 2.0 and 1.5 times higher than those observed at 7 and 11% MC and at increased and decreased temperature (± 45.5%). The variation of penetration depth was much higher in low MC samples (5%) than in high MC samples (11%). The variation difference was around 290% between samples of 5% MC and 11% MC at 30°C decreased by –45.5% from the reference temperature. This means penetration depth at lower MC is more sensitive to temperature variation. The higher sensitivity of penetration depth to temperature change suggests that more attention should be given in determining the size of an industrial RF disinfestation chamber for low MC canola seeds.
FIGURE 5 Sensitivity analysis of dielectric properties of the canola seed and electromagnetic power penetration depth in the bulk canola seeds as a funtion of temperature and MC at 27.12 MHz.
Effect of Linolenic Acid
The canola seed consists of moisture, ash (minerals), oil, protein, and glucosinolate.[Citation25] Oil is the largest component by mass,[Citation26] and it contains caprylic, capric, palmitic, stearic, oleic, linoleic, and linolenic acids. The of these acids at 1 MHz at 75°C were found from Lizhi et al.[Citation27] and presented in a bar-chart (). Linolenic and caprylic acids showed the highest values of the
, 2.493
0.001 and 2.491
0.001 among the fatty acids. Most oil seeds have similar percentage of caprylic acid. The percentages of linolenic acid in soybean (5.36%) and canola oils (7.51%) were much higher compared to those of other oil seeds (0.055–0.31%) as indicated in .[Citation27] The
of fatty acid increases with degree of unsaturation or the number increasing of double bonds of unsaturated molecules.[Citation18,Citation27,Citation28] The linolenic acid has three double bonds of unsaturated molecules more than other fatty acid resulting in the higher
. This could be one of the reasons of the higher
of the canola oil relative to other oil seeds. It should be noted that other ingredients of canola seed potentially affect
along with the linolenic acid although we suspect the effect might be limited. shows the dielectric properties of canola seeds are higher than other oil seeds in accordance with the same reason at different MCs, 23–30°C, and 10 MHz.[Citation1,Citation29–Citation32]
FIGURE 6 The dielectric constants of fatty acids in the canola seed oil at 1 MHz at 75°C (data taken from Lizhi et al.).[Citation24]
![FIGURE 6 The dielectric constants of fatty acids in the canola seed oil at 1 MHz at 75°C (data taken from Lizhi et al.).[Citation24]](/cms/asset/7699604f-51eb-4711-b03f-85edef4bed42/ljfp_a_1013630_f0006_b.gif)
Comparison of Dielectric Properties of Bulk Canola Seeds to Those of Other Oil Seeds
The dielectric properties of various oil seeds were obtained from the published works[Citation29,Citation31,Citation33] to compare with the measured dielectric properties of bulk canola seeds, which were indicated in . As shown in , the range of total oil content was 38.4 to 49.7% except for soy bean (6.8%). the dielectric properties of the bulk canola seeds had the highest values of the dielectric properties ( = 5.46, and “ = 1.50) among peanut, safflower, and soy bean seed. The dielectric properties of canola seed and soy bean which have relatively high linolenic acid content were around two or three times higher than those of other oil seeds. As mentioned above, the linolenic acid content of the oil seed could be one of the important factors affecting the dielectric properties at the specific frequency (~10 MHz) and temperature (23–30°C) ranges studied.
Selective Heating
As shown in , the electric field strength (E) within the insects was weaker than that within the canola seeds by around 0.46–0.73 times. Nevertheless, power dissipation (P) in the insects was higher comparing to that within the canola seeds by approximately 1.7–17.3 times (). The dielectric loss factor of the insects was higher than that of the canola seeds by around 6.8–43.9 times (). As described by Eq. (7), temperature increment in an insect—canola seed mixture () is affected by power dissipation (
), bulk densities (
) of the canola seed and insect, and specific heats (
) of these (). The ratio of the bulk density (
) and specific heat (
) of the canola seed to those of the insect calculated using data from was less than 1 (approximately 0.65 - 0.86). Therefore, power dissipation (
) was the primary affecting factor for
. The calculated temperature increment rate of the insect bodies was higher than that of canola seeds by nearly 1.4 to 10.1 x. This suggests that the insects can be heated selectively within the canola seeds. Especially, insects in low MC canola seeds can be heated more selectively. It should be, however, noted that this calculation did not consider any conductive heat transfer (cooling) from hotter insect bodies to colder canola seeds. In real situnations, the difference between temperature increment rates of insect bodies and canola seed mixture could be smaller. The real selective heating efficiency can be determined empirically or theoretically based on numerical simulations.
TABLE 1 Specific heats, densities, and porosities of rusty grain beetle (C. ferrugineus S.) and canola seed (B. napus L.) at indicated temperatures and MCs[Citation11]
TABLE 3 Dielectric constants and loss factors of various oil seeds as a function of linolenic acid content and MC at 10 MHz
FIGURE 7 The ratio of approximated electric field strength of rusty grain beetle (C. ferrugineus S.) to canola seed (B. napus L.) as a function of MC and temperature at 27.12 MHz.
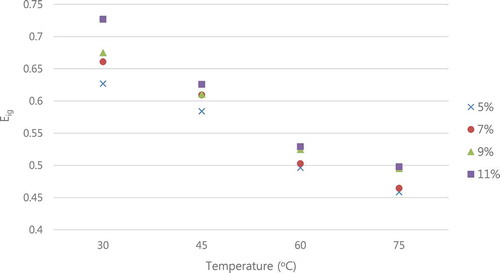
FIGURE 8 Rusty grain beetle (C. ferrugineus S.) to canola seed (B. napus L.) power dissipation factor for canola seed as a function of MC and temperature at 27.12 MHz.
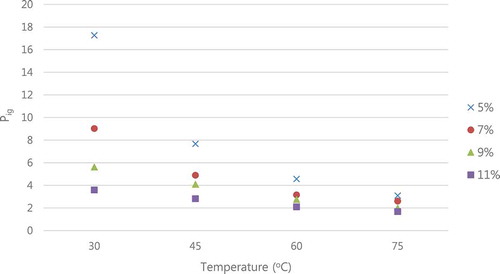
FIGURE 9 The ratio of dielectric loss factor for canola seed (B. napus L.) and rusty grain beetle (C. ferrugineus S.) as a function of MC and temperature at 27.12 MHz.
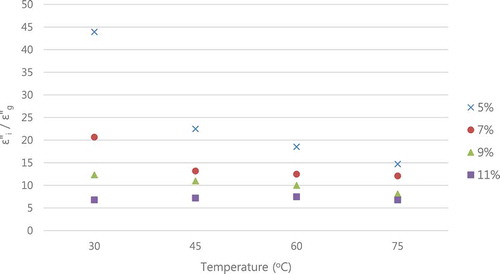
FIGURE 10 The ratio of temperature increment rate of rusty grain beetle (C. ferrugineus S.) to that of canola seed (B. napus L.) as a function of MC and temperature at 27.12 MHz.
CONCLUSIONS
The dielectric constant (
Penetration depth within the bulk canola seeds decreased with increasing MC, frequency, and temperature. The variation of penetration depth in drier samples was more sensitive to temperature change compared to that of wetter samples. More attention should be given to design industrial scale RF units with drier canola seeds considering the sensible variation of penetration depth in low MC of canola seeds.
A large difference between the dielectric loss factors of insect bodies and canola seeds makes selective heating of the insects among canola seeds feasible. The higher rate of temperature increment of the pest insect compared to that of the canola seed demonstrated a feasibility of RF disinfestation based on selective heating of insect pests at 27.12 MHz.
The regression models developed in this study could be used for estimating and simulating the dielectric properties of the bulk canola seeds further to evaluate feasibility of RF disinfestation based on selective heating.
ACKNOWLEDGMENTS
The authors would like to thank Mr. Ian Armer, grain quality control manager at Viterra Inc. for providing canola seed samples and technical support.
FUNDING
The authors gratefully acknowledge Saskatchewan Ministry of Agriculture and Western Grains research Foundation, Saskatchewan, Canada through Agriculture Development Fund for research funding (ADF #20130219).
Additional information
Funding
Related Research Data
REFERENCES
- Canola Council of Canada (2011). http://www.canolacouncil.org/markets-stats/industry-overview/ (accessed May 7, 2014).
- Canola Watch (2011). http://www.canolawatch.org/2011/05/09/estimating-flea-beetle-damage-in-canola/ (accessed May 7, 2014).
- Birla, S.; Wang, S.; Tang, J.; Tiwari, G. Characterization of Radio Frequency Heating of Fresh Fruits Influenced by Dielectric Properties. Journal of Food Engineering 2008, 89(4), 390–398.
- Reagan, R. 1987. Montreal Protocol on Substances That Deplete the Ozone Layer: Message from the President of the United States Transmitting the Montreal Protocol on Substances That Deplete the Ozone Layer. The Vienna Convention for the Protection of the Ozone Layer, Washington, DC: U.S., September 16, 1987; pp. 11, Government Printing Office.
- Wang, S.; Tang, J. Radio Frequency Heating: A Potential Method for Post-Harvest Pest Control in Nuts and Dry Products. Journal of Zhejiang University Science 2004, 5(10), 1169–1174.
- Tang, J.; Ikediala, J.; Wang, S.; Hansen, J.D.; Cavalieri, R. High-Temperature-Short-Time Thermal Quarantine Methods. Postharvest Biology and Technology 2000, 21(1), 129–145.
- Jiao, S.; Johnson, J.; Tang, J.; Tiwari, G.; Wang, S. Dielectric Properties of Cowpea Weevil, Black-Eyed Peas and Mung Beans With Respect to the Development of Radio Frequency Heat Treatments. Biosystems Engineering 2011, 108(3), 280–291.
- Choi, C.; Konrad, A. Finite Element Modeling of the RF Heating Process. IEEE Transactions on Magnetics 1991, 27(5), 4227–4230.
- Shrestha, B.; Baik, O. Radio Frequency Selective Heating of Stored-Grain Insects at 27.12 MHz: A Feasibility Study. Biosystems Engineering 2013, 114(3), 195–204.
- Von Hippel, A.R. Dielectric Properties and Waves; John Wiley: New York, NY, 1954.
- Stratton, J.A. Electromagnetic Theory (Vol. 33). John Wiley & Sons: New York, NY, 2007.
- ASAE Standard S358.2: Moisture Measurement—Forages. American Society of Agricultural and Biological Engineers; St. Joseph, MI, 2004.
- Brusewitz, G. (1975). Density of rewetted high moisture grains. Transactions of the ASAE, 18(5), 935–938.
- Shrestha, B.L.; Baik, O.D. Dielectric Behaviour of Whole-Grain Wheat with Temperature at 27.12 Mhz: A Novel Use of a Liquid Dielectric Test Fixture for Grains. International Journal of Food Properties 2015, 18(1), 100–112.
- Agilent, H.P. 4285A Precision LCR Meter-Operation Manual, (Chap 7), Agilent Technologies, Inc.: Tokyo, Japan, Jan/2001.
- Shrestha, B.L.; Baik, O. Permittivity of Mixtures of Saponaria vaccaria and Ethanol–Water Solution for RF Heating Assisted Extraction of Saponins. IEEE Transactions Instrumentation and Measurement, 2011, 60(8), 2861–2871.
- Debye, P. Polar Molecules ( Chap 5). Chemical Catalog Co.: New York, NY, 1929.
- Pace, W.E.; Westphal, W.B.; Goldblith, S.A. Dielectric Properties of Commercial Cooking Oils. Journal of Food Science 1968, 33(1), 30–36.
- Nelson, S.O.; Bartley, P.G. Frequency and Temperature Dependence of the Dielectric Properties of Food Materials. Transactions of the ASAE4 2002, 5(4), 1223–1227.
- Tang, J.; Feng, H.; Lau, M. (2002). Microwave Heating in Food Processing. In: Young, X., Tang, J. (Eds.), Advances in Bioprocessing Engineering, 1–43, Scientific Press: New York, NY, 2002.
- Sipahioglu, O.; Barringer, S.A.; Taub, I.; Prakash, A. Modeling the Dielectric Properties of Ham as a Function of Temperature and Composition. Journal of Food Science 2003, 68(3), 904–909.
- Wang, S.; Tang, J.; Cavalieri, R.; Davis, D. Differential Heating of Insects in Dried Nuts and Fruits Associated with Radio Frequency and Microwave Treatments. Transactions of American Society of Agricultural Engineers 2003, 46(4), 1175–1184.
- Koskiniemi, C.B.; Truong, V.D.; McFeeters, R.F.; Simunovic, J. Effects of Acid, Salt, and Soaking Time on the Dielectric Properties of Acidified Vegetables. International Journal of Food Properties 2013, 16(4), 917–927.
- Uan, D.; Cheng, M.; Wang, Y.; Tang, J. Dielectric Properties of Mashed Potatoes Relevant to Microwave and Radio‐frequency Pasteurization and Sterilization Processes. Journal of Food Science 2004, 69(1), FEP30–FEP37.
- Conrad, J.H.; Deyoe, C.W.; Harris, L.E.; Moe, P.W.; Van Soest, P.J. United States-Canadian Tables of Feed Composition: Nutritional Data for United States and Canadian Feeds., National Academy Press: Washington, DC, 1982.
- Haq, I.; Saeed, M.; Ahmed, I.; Ashraf, M.; Ejaz, N. (2009). Chemical Analysis and Characterization of (Brassica napus) Canola Oil Seed. Complex Medical Engineering, 2009, 1–4.
- Lizhi, H., Toyoda, K., & Ihara, I. Dielectric Properties of Edible Oils and Fatty Acids as a Function of Frequency, Temperature, Moisture, and Composition. Journal of food engineering 2008, 88(2), 151–158.
- Rudan-Tasic, D.; Klofutar, C. (1999). Characteristics of vegetable oils of some Slovene manufacturers. Acta Chimica Slovenica, 46(4), 511–521.
- ASAE. (2012). D293.4: Dielectric Properties of Grain and Seed.
- Sacilik, K.; Tarimci, C.; & Colak, A. Dielectric Properties Flaxseeds As Affected By Moisture Content and Bulk Density in the Radio Frequency Range. Biosystems Engineering, 2006, 93(2), 153–160.
- Sacilik, K.; Tarimci, C.; Colak, A. (2007). Moisture content and bulk density dependence of dielectric properties of safflower seed in the radio frequency range. Journal of Food Engineering 2007, 78(4), 1111–1116.
- USDA (2011). USDA National Nutrient Database for Standard Reference. http://ndb.nal.usda.gov/ndb/nutrients/report/nutrientsfrm?max=25&offset=0&totCount=0&nutrient1=204&nutrient2=&nutrient3=&subset=0&fg=&sort=f&measureby=m, ( accessed May 7, 2014,2014(May/7).
- Worthington, R.E., Holley, K.T. (1967). The Linolenic Acid Content of Peanut Oil. Journal of the American Oil Chemists’ Society, 44(8), 515–516.