
Abstract
There is reason to question some of the published thermal conductivity data for particulate foods. It is argued in this article, based on thermal conductivity bounds analysis, that the thermal conductivity of particulate foods should range between 0.03 W m–1 K–1 and 0.30 W m–1 K–1 (provided the porosity is greater than 25%), and that any data outside this range should be rejected. This argument was supported by data for five foods measured as part of this study (cocoa powder, corn starch, whole milk powder, sucrose, and wheat flour), and the majority of published data for particulate foods do indeed fall within this range. The geometric model was found to provide the most accurate thermal conductivity predictions of the models considered, and is recommended for use in first approximation predictions.
INTRODUCTION
Thermal conductivity is an important parameter for modeling thermal processes including cooking, drying, sterilization, pasteurization, chilling, and freezing. Such models allow for process optimization to improve quality and efficiency.[Citation1–Citation3] A significant number of thermal conductivity data for minimally processed foods may be found in the literature;[Citation1,Citation3–Citation7] however, there can be significant variation in published data for a given food product,[Citation8] and it is often difficult to analyze the data since one or more relevant factors such as the food’s composition, the measurement temperature, or measurement technique are not always stated within the article. This is particularly relevant for particulate foods, where the bulk density or porosity is often not reported.[Citation4–Citation6]
As an example, consider thermal conductivity data for wheat “flour”[Citation5,Citation9] compared to wheat “dust.”[Citation5,Citation10] The names of these two products would suggest that they would be morphologically similar (i.e., fine particles/powder), and yet their thermal conductivities differ by an order of magnitude (0.67 W m–1 K–1 compared to 0.06 W m–1 K–1). The measurements from the two sources were performed at different temperatures and had different moisture contents, but even accounting for these factors could not explain the difference. Similarly, data for soy-flour[Citation4,Citation5] range from 0.04 W m–1 K–1, to 0.95 W m–1 K–1; the latter of which is very high for any (unfrozen) food product, being significantly higher than the thermal conductivity of water between 0 and 100°C.[Citation1] At the opposite extreme, data for whole rapeseed[Citation11] (as cited by Wallapapan et al.)[Citation12] was as low as 0.0009 W m–1 K–1 which is orders of magnitude of thin air itself (0.025 W m–1 K–1 at 25°C).[Citation1]
Given that particulate foods contain significant (i.e., greater than 25%) porosity (where “porosity” refers to any void volume within the food), tend to be relatively dry (i.e., have low moisture content), and tend to have carbohydrates as the dominant nutritional component, from theory one would expect a narrower thermal conductivity range in the published data than is currently observable. It was not the aim of this article to critique all the published data for particulate foods individually (since some may simply be typographical errors); instead the aim of this article was to consider what ranges of thermal conductivities of powdered foods should be expected from theoretical considerations and to describe how simple effective thermal conductivity models can be used to moderate (i.e., check for plausibility) existing data, and as a check before new measurements are published.
THEORETICAL CONSIDERATIONS
The thermal conductivity of a heterogeneous material (such as a food product) is theoretically bounded by the Parallel (Eq. 1) and Series (Eq. 2) thermal conductivity models, often referred to as the “Wiener bounds:”[Citation13]
Now consider two hypothetical foods: the first is bone dry carbohydrate and has a porosity of 0.82 (about the upper limit of porosity found in the literature for a particulate food); the second hypothetical food has a porosity of 0.25 (the lower limit of porosity for particulates) and has a condensed phase which is 40% water and 60% carbohydrate (wet basis). Since the first hypothetical food is low in moisture content and high in porosity, we would expect it to have a thermal conductivity close to the lowest possible value for a particulate material. Conversely, since the second hypothetical food has low porosity and high moisture content we would expect it to have a thermal conductivity close to the highest possible value for particulate foods.
The upper and lower thermal conductivities for each food, as predicted by the Parallel and Series models (based on food component thermal conductivities at 20°C) are 0.30 W m–1 K–1 and 0.03 W m–1 K–1, respectively. The lowest predicted thermal conductivity is for the first hypothetical food (i.e., the lower bound for the hypothetical food expected to have lowest thermal conductivity) and the highest is for the second hypothetical food (upper bound for the hypothetical food expected to have the highest thermal conductivity).
The Wiener bounds apply to materials having any structure; however, for isotropic materials (including the randomly arranged particulate foods), the Hashin-Shtrikman bounds apply, which lie within the Wiener bounds.[Citation14,Citation15] For a particulate food, the lower Hashin-Shtrikman bound is equivalent to the Maxwell-Eucken model with air as the continuous phase (Eq. 3) and the upper bound is equivalent to the Maxwell-Eucken model with air as the dispersed phase (Eq. 4):
For particulate foods, which may be classed as “external porosity” materials, even narrower bounds have been proposed[Citation15,Citation16] where the effective medium theory (EMT) model (Eq. 5) serves as the upper bound and Eq. (3) serves as the lower bound:
Applying the upper external porosity bound (Eq. 5) to the hypothetical foods, the predicted thermal conductivity is only 0.18 W m–1 K–1 (the lower bound is the same as the lower Hashin-Shtrikman bound, i.e., 0.04 W m–1 K–1). It is difficult, therefore, to conceive how measured data for powdered foods can be accurate if it is significantly higher than 0.3 W m–1 K–1, or lower than 0.03 W m–1 K–1. While there is inherent variability in the thermal properties of biological materials, such as foods, and there is also inherent variability between different measurements from the same measurement device applied to the same food,[Citation18] these factors on their own cannot explain the wide range of thermal conductivity values that have been published for particulate foods.[Citation1,Citation4–Citation6] Conversely, the majority of the published data do in fact lie between 0.04 W m–1 K–1 and 0.2 W m–1 K–1 which corresponds to the range predicted by the external porosity bounds.
MATERIALS AND METHOD
While there is a large number of thermal conductivity data for particulate foods within the literature, relatively few of them are presented with supporting information that would be required to test the thermal conductivity models without making some assumptions. Therefore, in order to test these thermal conductivity bounds without introducing bias from different measurement apparatus and measurement techniques (as might be the case if data from the limited amount that is suitable for the purpose were to be used), the thermal conductivities of five powdered foods were measured at 20°C specifically for this study, along with the composition measurements required for the application of Eqs. (1) to (5).
Thermal Conductivity Measurement
A Hukseflux™ TP08 thermal conductivity probe was used for the thermal conductivity measurement. Its design complies with ASTM D 5334-00, D 5930-97, and IEEE 442-1981 standards.[Citation19] The probe needle was 70 mm long and 1.2 mm in diameter. The sample powders were poured into a watertight, stainless-steel sample container (constructed as per recommendations in the TP08 user manual[Citation19]) and shaken and tapped several times until the powder had settled. The sample containers were placed in a Julabo™ FP40 temperature-controlled bath. Measurements were performed with baseline temperatures of 20°C. The thermal conductivity probe was inserted into the sample which was allowed to equilibrate at the base-line temperature. Once the sample had equilibrated the heater was switched on and the probe temperature was recorded. After a period of time (2–4 min) the heater was switched off and the sample was allowed to return to the base-line temperature before a replicate measurement was performed. Once the value of the slope of the linear portion of the curve has been determined, the thermal conductivity of the sample may be calculated from Eq. (6):[Citation20]
Bulk Density and Moisture Content Measurements
In order to compare the measured data against thermal conductivity model predictions, bulk densities and moisture contents were also measured. Bulk densities were measured using volumetric flasks, and the standard deviation between replicates was used as an estimate of the measurement uncertainty. The moisture contents of each sample was measured by drying the sample at 105°C until the mass became steady with time, in which case the moisture content was determined from:
Materials
Five particulate foods were considered in these experiments: corn starch, sucrose, wheat flour, cocoa powder, and milk powder (all were in powder form, i.e., with mean particle diameters less than 0.1 mm). All were standard commercial products purchased from a local store. Where applicable, the protein, fat, and carbohydrate mass percentages as specified by the manufacturer are shown in .
TABLE 1 Protein, fat, and carbohydrate compositions of the powdered foods (mass basis)
TABLE 2 Bulk densities, moisture contents, and thermal conductivities of five powdered foods measured at 20°C
RESULTS AND DISCUSSION
shows the measured moisture contents, apparent densities, and thermal conductivities of the five powders. The thermal conductivity data in are the averages of at least 15 measurements performed on at least three different samples, and the standard deviation of the measurements ranged between 1 and 2.5% of the mean value. The probe manufacturer stated that the uncertainty in a typical measurement is ±3%,[Citation19] and since this value is greater than the standard deviation, it is used as the error estimate for the measurements. The uncertainty in the bulk density and moisture content measurements is estimated to be less than 1%.
Comparison between measured data and published data is complicated by the differences in moisture contents, bulk densities, and measurement temperatures (or, in the case of cocoa powder, corn-starch powder, and sucrose powder, lack of published data). However, the data for wheat flour are comparable to data (for wheat “dust”) measured by Chang et al.,[Citation10] the milk powder measurement is similar to data measured using a guarded hot-plate by MacCarthy.[Citation4,Citation21]
Comparison of Measured Data Against Thermal Conductivity Bounds
shows the measured thermal conductivity against the Weiner, Hashin Shtrikman, and External Porosity bounds. Note that Eqs. (3) and (4) are for binary mixtures, and so for multi-component foods the models must should applied sequentially, adding an extra component at each step. However, for simplicity the thermal conductivities of the non-gaseous food components have been modeled by Eq. (1) to produce the conductivity of the condensed phase (kc) for subsequent use in Eqs. (3) and (4). The justification for this approach has been provided elsewhere.[Citation8,Citation22] Although Eq. (5) can be applied for multi-component mixtures, the sequential approach (i.e., Eq. 1 for non-gaseous foods to produce kc, followed by Eq. 5) was applied for simplicity of implementation.
TABLE 3 Comparison of measured data against thermal conductivity bounds
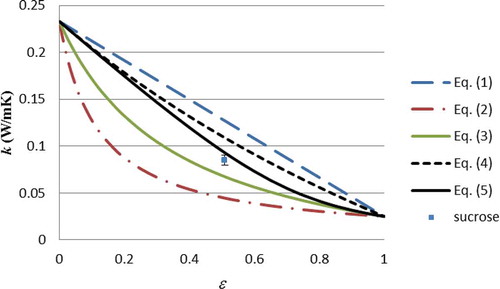
shows that for each of the five foods the measured thermal conductivity lies within the external porosity bounds, allowing for measurement uncertainty (the error bar of milk powder overlaps the bound), which means that they also necessarily fall within the Hashin-Shtrikman and Wiener bounds. , , and illustrate this graphically (note that each data point has been plotted separately, since the food compositions, and hence, kc, are different for each food). The measured data support the theory that the thermal conductivity of particulate foods should lie within bounds. Although testing five different foods at one temperature cannot be considered a complete validation of the theory, a much greater number of measured data in the literature[Citation1,Citation4–Citation6] would fall within the Wieners bounds at least (as far as can be inferred from the data which is supplied with the thermal conductivity measurements themselves). Hence, the thermal conductivity bounds may serve two valuable purposes:
They may be used as a check on measured data (provided the porosity is greater than 25%)—at the very least those data which lie outside the Wiener bounds should be rejected. This would hopefully reduce the number of clear outliers amongst the data which are published.
For particulate foods the external porosity bounds, being much narrower than the Wiener bounds, allow for the prediction of the limits of thermal conductivity for a given particulate food.
FIGURE 1 Thermal conductivity data for wheat flour along with thermal conductivity bounds.

FIGURE 2 Thermal conductivity data for cocoa along with thermal conductivity bounds.
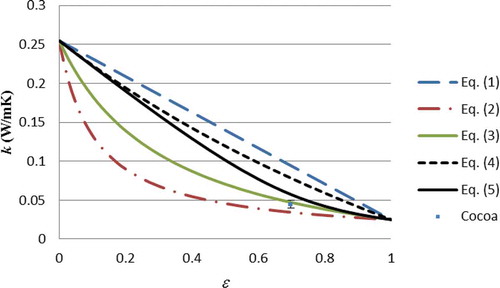
FIGURE 3 Thermal conductivity data for sucrose along with thermal conductivity bounds.
Thermal Conductivity Prediction for Powdered Foods
It is also worthwhile considering whether a thermal conductivity model can predict the actual thermal conductivity of these particulate foods, rather than simply upper and lower bounds of thermal conductivity. For genuine predictions, models that do not contain parameters whose values must be determined empirically are preferable. We expect the thermal conductivities of particulate foods to lie within the region bounded by Eqs. (4) and (5; i.e., the external porosity bounds),[Citation15] Three models that meet these criteria[Citation8,Citation15,Citation16] (no empirical parameters, predicted thermal conductivity falling within the external porosity region) are the Geometric, Levy,[Citation23] and Co-continuous (CC)[Citation24] models:
presents the thermal conductivities of Eqs. (11), (12), and (15) against the measured thermal conductivity data and the absolute prediction error of the models, as defined by:
shows that of the six models the Geometric model (Eq. 11) provides the most accurate predictions, which is perhaps unsurprising, since it divides the external porosity region most evenly (see Fig. 5 of Carson).[Citation8] It is, therefore, recommended for general use for obtaining first approximation estimates of the thermal conductivity of particulate foods.
TABLE 4 Comparison of measured data against thermal conductivity predictions
CONCLUSION
Theoretical arguments suggest that the thermal conductivity of particulate foods should fall within the range 0.03 W m–1 K–1 and 0.2 W m–1 K–1 (provided the porosity is greater than 25%). This was found to be the case when the thermal conductivities of five different particulate foods were measured. The majority of published thermal conductivity data for particulate foods also falls within this range. It is, therefore, suggested that whenever the thermal conductivity of a particulate food is measured, the measured value should be compared to the values predicted by the Series and Parallel models at the very least, and if it is higher than the value predicted by the Parallel model, or lower than the value predicted by the Series model, it should be rejected. Of the different thermal conductivity models considered, the Geometric model provided the most accurate predictions.
NOMENCLATURE
| F | = | Intermediate variable defined by Eq. (13) |
| G | = | Intermediate variable defined by Eq. (14)) |
| k | = | Thermal conductivity (W m–1 K–1) |
| m | = | Mass (kg) |
| Q | = | Heater power (W m–1) |
| t | = | Time (s) |
| T | = | Temperature (°C or K) |
| v | = | Volume fraction |
| x | = | Mass fraction |
| ε | = | Porosity (i.e., volume fraction of air) |
| ξ | = | Absolute model prediction error (W m–1 K–1) |
| ρ | = | Density (kg m–3) |
Subscripts
| a | = | Property of air |
| c | = | Property of condensed phase |
| e | = | Effective property |
| i | = | Component index |
| w | = | Property or water |
Related Research Data
REFERENCES
- ASHRAE Handbook of Refrigeration. American Society of Heating, Refrigeration, and Air-conditioning Engineers: Atlanta, GA, 2006.
- Fellows, P.J. Food Processing Technology—Principles and Practice; 2nd Ed.; Woodhead Publishing Ltd.: Cambridge, 2000.
- Rao, M.A.; Rizvi, S.S.H.; Datta, A.K. Engineering Properties of Foods; Taylor and Francis: Boca Raton, FL, 2005.
- Rahman, M.S. Food Properties Handbook, 2nd Ed.; CRC Press: Boca Raton, FL, 2009.
- Krokida, M.K.; Pangiotou, N.M.; Maroulis, Z.B.; Saravacos, G.D. Thermal Conductivity: Literature Data Compilation for Foodstuffs. International Journal of Food Properties 2001, 4, 111–137.
- Krokida, M.K.; Michailidis, P.A.; Maroulis, Z.B.; Saravacos, G.D. Literature Data of Thermal Conductivity of Foodstuffs. International Journal of Food Properties 2002, 5, 63–111.
- Rask, C. Thermal Properties of Dough and Bakery Products: A Review of Published Data. Journal of Food Engineering 1989, 9, 167–193.
- Carson, J.K. Measurement and Modelling of Thermal Conductivity of Sponge and Yellow Cakes as a Function of Porosity. International Journal of Food Properties 2014, 17, 1254–1263.
- Ojha, T.P.; Farrall, A.W.; Dhanak, A.M.; Stines, C.M. A Method of Determining Heat Transfer Through Powdered Foods. Trans. ASAE 1967, 10, 543–544.
- Chang, C.S.; Lai, F.S.; Miller, B.S. Thermal Conductivity and Specific Heat of Grain Dust. Trans. ASAE 1980, 23(5), 1303–1312.
- Moysey, E.B.; Shaw, J.T.; Lampman, W.P. The Effect of Temperature and Moisture on the Thermal Properties of Rapeseed. Trans. ASAE 1977, 20(4), 768–771.
- Wallapapan, K.; Sweat, V.E.; Diehl, K.C.; Engler, C.R. Thermal Properties of Porous Foods. In Physical and Chemical Properties of Food; Okos, M.R.; Ed.; American Society of Agricultural Engineers: St. Joseph, Michigan, 1986.
- Torquato, S. Random Heterogeneous Materials; Springer Verlag: New York, NY, 2002.
- Hashin, Z.; Shtrikman, S. A Variational Approach to the Theory of the Effective Magnetic Permeability of Multiphase Materials. Journal of Applied Physics 1962, 33, 3125–3131.
- Carson, J.K.; Lovatt, S.J.; Tanner, D.J.; Cleland, A.C. Thermal Conductivity Bounds for Isotropic, Porous Materials. International Journal of Heat and Mass Transfer 2005, 48, 2150–2158.
- Carson, J.K.; Lovatt, S.J.; Tanner, D.J.; Cleland, A.C. Predicting the Effective Thermal Conductivity of Unfrozen, Porous Foods. Journal of Food Engineering 2006, 75, 297–307.
- Landauer, R. The Electrical Resistance of Binary Metallic Mixtures. Journal of Applied Physics 1952, 23, 779–784.
- Kent, M.; Christiansen, K.; van Haneghem, I.A.; Holtz, E.; Morley, M.J.; Nesvadba, P.; Poulsen, K.P. Cost 90 Collaborative Measurements of Thermal Properties of Foods. Journal of Food Engineering 1984, 3, 117–150.
- User manual—TP08 Small Size Non-Steady-State Probe for Thermal Conductivity Measurement. Art no 5000-003 Version 0607, Hukseflux, www.hukseflux.com.
- Elustondo, D.; Elustondo, M.P.; Urbicain, M.J. New Thermal Conductivity Probe Design Based on the Analysis of Error Sources. Journal of Food Engineering 2001, 48, 325–333.
- MacCarthy, D.A. Effect of Temperature and Bulk Density of Spray-Dried Whole Milk Powder. Journal of Food Engineering 1985, 4, 249–263.
- Carson, J.K., Wang, J.F.; North, M.F.; Cleland, D.J. In Predicting the Thermal Conductivity of Low Water-Content Foods, Proceedings of the 23rd IIR International Congress of Refrigeration, Prague, August 21–26, 2011, Paper # 407.
- Levy, F.L. A Modified Maxwell-Eucken Equation for Calculating the Thermal Conductivity of Two-Component Solutions or Mixtures. International Journal of Refrigeration 1981, 4, 223–225.
- Wang, J.F.; Carson, J.K.; North, M.F.; Cleland, D.J. A New Structural Model of Effective Thermal Conductivity for Heterogeneous Materials with Co-Continuous Phases. International Journal of Heat and Mass Transfer 2008, 51, 2389–2397.