
Abstract
This study focused on the odor and taste components of 14 commercial brands of fish sauces from various Asian countries. Odor components were extracted by headspace monolithic material sorptive extraction techniques and analyzed by gas chromatography-mass spectrometry/olfactometry. The taste compounds were identified from the concentration of sodium chloride, free amino acids, minerals, and 5´-nucleotides. The sensory evaluation was carried out by 11 trained tasters. Seventy-nine different types of volatile compounds were identified, described, and quantified by concentration and odor active value. Acid groups were the dominant volatile compounds. Trimethylamine, butanoic acid, and 2-methyl butanoic acid produced odors described as rotten fish, ammonia, rancid butter, cheesy, sweet, and rancid. The concentration of salt contents was estimated at 21.30% (w/v). Aspartic and glutamic acids gave high taste values and nutrients produced the umami taste. Analysis showed that the various flavors obtained from the fish sauces resulted from differences in ingredients and production techniques.
INTRODUCTION
Fish sauce is a liquid extracted from fish fermented with sea salt.[Citation1] It is produced from a fish and salt mixture which is kept in a concrete tank within a temperature range of 35–40°C for over 6 months. Fish sauce is an important cooking ingredient in Southeast and Eastern Asia. It is made from anchovies, other small fish, shrimp, or from the processing of aquatic by-products. Japanese fish sauce is also produced from aquatic creatures such as salmon, octopus, urchins, and scallops.[Citation2–Citation5]
Fish sauces have distinct and particular odors, mainly ammoniacal, meaty, and cheesy.[Citation6] Sweet, meaty, and cheesy odors prevail in Thai fish sauce, with salty and anchovy like odors also noticed.[Citation7] Each fish sauce brand, made from different component species of small fish, prawns, and squids may also be mixed with over 20% salt or other additives. Fermentation time affects the taste and the chemical composition of the fish sauces.[Citation8] Nutrients such as peptides, amino acids, and nucleic acids in the fish sauce produce the umami taste. Fish sauces with the strong and complicated umami taste are an important dietary source. Umami means the taste of foods which have component glutamic acid and ribonucleotides (5´-inosinate and 5´-guanylate). These compounds can be found in meats, fruits, vegetables, certain processed foods, and also in seafood.[Citation9Citation10]
For the extraction of the volatile compounds in fish sauce, sensory evaluation with headspace monolithic material sorptive extraction (HS-MMSE) was used. MMSE is a process which makes use of a new generation media for adsorption and extraction by MonoTrap (MT) developed by using silica monolith technology. The MT composition is a porous monolithic structure made of pure silica and activated carbon with a large surface area. The silica and carbon hybridize and bond with octadecyl silane (C18, ODS). This ODS-bonded hybrid medium has good adsorption capacity for a wide range of compounds. The ODS groups which are bonded to the surface by activated carbon (or graphite carbon) present inside and outside the structure,[Citation11] can then be analyzed by using gas chromatography-mass spectrometry/olfactometry (GC-MS/O) techniques.[Citation12]
A sensory analysis method was used to describe the qualities of the fish sauces. Quantitative Descriptive Analysis (QDA®) is a much-used tool in the sensory analysis which provides the most detailed or complete description of products and/or product categories.[Citation13]
Various studies have clarified the odor and taste characteristics of fish sauces, but no research has compared the difference in odor and taste of fish sauces by locality. Moreover, the difference in the flavor of fish sauces is dependent upon the preference of people in each area and this can also be applied to other food products. This research focused on the flavors of fish sauces from countries in East and South Eastern Asia. Many instruments were used for chemical analysis and the comparison and relationship of sensory evaluation by the tasting panelists. Many factors contribute to the flavors of fish sauces, including the species of fish, ingredients, processing period, and temperature. All of these were evaluated in this study.
MATERIALS
Fish Sauce Samples
This research focused on comparing the odor and taste of fish sauces from various Asian countries. Samples were imported from Asian countries and bought from the markets in Thailand (T1, T2, T3, and T4), Vietnam (V1, V2, and V3), China (C1, C2, and C3), South Korea (K1, K2, and K3), and Japan (J). Despite their different origins and process of production, every commercial brand of fish sauce possessed the key odor and taste characteristics. Samples were transported in tightly sealed plastic bottles and stored securely in the laboratory at 4°C. The ingredients used in the manufacturing of fish sauce are listed in .
TABLE 1 Code and ingredients of 14 fish sauce samples
Reagents for Chemicals Analysis
C5-C30 n-alkanes were used to made retention indices (RIs), and 2,4,6-trimethylpyridine (TMP, purity 99 %, I.S.) was used to internal standard, and purchased from Sigma-Aldrich Trading Co. Ltd. (Shanghai, China).
Potassium chromate (K2CrO4) was used as an indicator for Mohr’s method in the titration of chloride ions in a silver nitrate standard solution.
Amino acids standards (Hitachi, Japan) were used as a standard in the analysis of free amino acids (FAAs).
Sodium, potassium, phosphorus, calcium, and magnesium standards were used for the analysis of minerals.
Nucleotides standards used were 5´-Cytosine monophosphate (CMP), 5´-Uridine monophosphate (UMP), 5´-Inosine monophosphate (IMP), 5´-Guanosine monophosphate (GMP) and 5´-Adenosine monophosphate (AMP).
METHODS
Extraction of Volatile Compounds
Volatile compounds in the fish sauce samples were extracted by HS-MMSE. Five milliliters of each fish sauce sample was pipetted into a vial (15 mL) with 10 µL of I.S., 1000 mg/L TMP (purity 99%). A MT rod (diameter 2.9 mm × length 5 mm, hole diameter 1 mm; ODS, silica gel, and activated carbon; GL Science, Shinjuku, Tokyo, Japan) was used for HS-MMSE. I.S. was added to a sample solution, then screwed closed. MT rods were placed in fixed positions in the headspace containing the sample. The vial was kept in a heat-gathering style magnetism mixer for 30 min at 50°C and volatile compounds were adsorbed to the surfaces of the MT rods. Then the MT rods were removed, placed in an adsorption tube, and desorbed by thermal desorption.
GC-MS/O
The volatile compounds were analyzed by a 6980 gas chromatography ion trap 5793 mass spectrometer (Agilent Inc., USA). The effluent from the capillary column was split 1:1.5 (v/v) between the mass spectrometry detector and the ODP-2. Separations in GC were performed on a DB-5MS capillary column (60 m length × 0.32 mm i.d. × 1 μm film thickness; Agilent Inc., USA), using helium (99.999% purity) as the carrier gas at 1.26 mL/min and pressure 80.166 kPa. Oven temperature was programmed from 50°C for 3 min, and then increased to 200°C at the rate of 3°C/min and held for 4 min, further increased to 250°C at 10°C/min and maintained for 3 min, and finally post run to 280°C at 1.6 mL/min for 2 min. MS conditions were as follows: detector interface temperature 250°C, ion source temperature 230°C, ionization energy 70 eV, mass range 40–450 amu, electron multiplier voltage 1576 V, and scan rate 1.8 s−Citation1. Next, the samples were desorbed at 240°C with a thermal desorption unit (TDU; Gerstel, German) directly into the hot injector of the gas chromatograph with simultaneous cryofocusing using liquid nitrogen.
Identification and Quantification
Volatile compound identification was based on a comparison of GC RIs, mass spectra (comparison with MS spectra database Wiley/NIST 2008 and the internal library of the laboratory), and odor properties. RI was calculated as follows:
The retention time of each volatile compound (x) is denoted by Rt(x), and the retention times of n-alkanes eluting directly before and after the compound (x) under the identical chromatographic conditions are denoted by Rt(n) and Rt(n + 1). Under comparable GC-MS conditions, the ratio of each peak area to the I.S. peak area was calculated. The estimated concentration of each volatile compound in fish sauce sample was calculated as reported rather than as follows:[Citation12]
Odor Active Values (OAVs)
OAVs were calculated from the equation:
where Ci is the estimated unit of concentration of the compound in the sample and OTi is its odor threshold found in the literature. An OAV equal to or greater than one actually contributes to the aroma as an odor-active compound because it is above the odor threshold.[Citation14]
Detection of Odor Descriptive Method
Three trained panelists (one male and two female) smelled the odor in five fish sauce samples (T1, T4, C3, V3, and J), chosen from the total samples for detecting odor descriptive by GC-O. Panelists were formed for sensory analysis of each fish sauce sample and they were able to detect various descriptive odors.[Citation15Citation16]
Determination of Salt, FAAs, and Minerals
Salt contents were determined and calculated to NaCl (%) by determination of chloride ion concentration by titration.[Citation17] FAAs from each of the fish sauce samples were determined. Samples were transformed to pH value 2.2 and diluted with distilled water to suit with the concentration of standard solution. Millipore filter membrane 0.45 µm was used beforehand to determine the sample. The samples were analyzed for FAAs by the automatic Amino Acids Analyzer (AAA, L8800, Hitachi, and Tokyo, Japan). Phosphate was converted into molybdenum blue, and then determined by a Spectrophotometer UNICO 2100 (Absorbance 660 nm) based on the Association of Official Analytical Chemists (AOAC) method.[Citation18] Sodium, potassium, calcium, and magnesium were determined by flame atomic absorption spectroscopy (FAAS, Analytik Jena, Zeenit 700). Fish sauce samples were diluted with distilled water to match with the concentration of standard solution in a volumetric flask.
Determination of 5´-Nucleotides
The fish sauce sample was processed through a 0.45 µm filter into a 2 mL vial. The 10 µL sample was analyzed by a Water e2695 Alliance HPLC Separations Module with Ultimate® HPLC Column (AQ-C18, 5µm, 4.6 × 250 mm, based on 99.999% ultra-high purity silica) and a Waters 2998 photodiode array detector. The mobile phase used KH2PO4 (pH 4.5). The flow rate was 1.0 mL/min. The temperature was controlled at 40°C. The 5´-nucleotides were detected at 248 nm. The concentration of samples was analyzed by comparing with the standard solution and calibration curve.
Taste Active Values (TAVs)
TAVs were calculated as the ratio between its concentration determined in fish sauce samples and its threshold value generally measured in water or in a simple matrix. The compounds whose TAV was greater than one were considered as active in food taste.[Citation19]
Sensory Evaluation
Four milliliters of 14 different fish sauce samples were poured into small glasses. The samples were coded with discrete 3-digit numbers and served to panelists in the sensory room at 25 ± 1°C. The panel was comprised of 11 Chinese students (six males and five females) from the College of Food Science and Technology at Shanghai Ocean University. They were all trained in QDA®. QDA® on a 9-point scale was used to explain the sensory profile of sample products.[Citation20Citation21] The panelists had trained to detect common odors.[Citation22–Citation24] They were asked to describe the differences between samples by comparing the sensory attribute in each treatment and provide an indication of the sensory characteristics of the fish sauce samples. The sensory attributes selected were odors: ammonia, caramel, fermented, fishy, rancid, roasted, and musty; and tastes: meaty, sour, umami, salty, sweet, and bitter. Aftertastes were sweet, salty, bitter, caramelized, and fishy.[Citation25Citation26] The panelists determined and evaluated the odor intensity from the fish sauce samples by QDA® on a 9-point scale. The rating scale ranged from extremely weak (1) to extremely intensive (9).[Citation13] There was a break time of 5–10 min for each sample to avoid sensory fatigue.
Statistical Analysis
The data were analyzed by statistical package for the social science (SPSS) software analysis (version 17.0), performing a one-way analysis of variance (ANOVA; Duncan’s multiple range test) set at p < 0.05 level of significance.
RESULTS AND DISCUSSION
Analyzing the Volatile Compounds
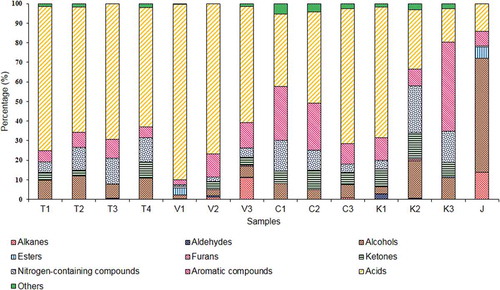
Seventy-nine volatile compounds from 14 fish sauce samples were identified on DB-5MS column (). The total ion chromatograms obtained from T4 and J samples are shown in and . Volatile compounds included three alkanes, four aldehydes, 11 alcohols, three esters, two furans, six ketones, 11 nitrogen-containing compounds, 11 aromatic compounds, 18 acids, and 10 others. The main volatile compounds identified in the samples were trimethylamine (TMA), acetone, 1-propanol, acetic acid, 2-butanone, benzene, propanoic acid, 3-methyl-1-butanol, 2-methyl-1-butanol, butanoic acid, 2-methyl butanoic acid, 3-methyl butanoic acid, 4-methyl pentanoic acid, phenol and benzaldehyde. shows that acids were the most volatile compounds in all samples. These results agreed well with previous studies. Six volatile acids from the main volatile compounds were identified in most of the samples, including acetic acid, propanoic acid, butanoic acid, 2-methyl butanoic acid, 3-methyl butanoic acid, and 4-methyl pentanoic acid. The volatile acid class represents the major constituents in the samples and could be produced by either lipolysis or from the amino acid metabolism in terms of valine deamination.[Citation27] The straight-chain volatile acids (acetic, propanoic, and butanoic acids) occurred from straight-chain fatty acids. 2-methyl butanoic acid, 3-methyl butanoic acid, and 4-methyl pentanoic acid were produced from the degradation of some amino acids.[Citation2] However, the difference between volatile groups showed the highest concentration of aromatic compounds in the K3 sample and highest alcohols in the J sample.
TABLE 2 Concentration of volatile compounds in fourteen fish sauce samples (Mean ± SD)
FIGURE 1 Total ion chromatogram of volatile compounds in T4 sample by GC-MS.
FIGURE 2 Total ion chromatogram of volatile compounds in J sample by GC-MS.
FIGURE 3 Percentage of total concentration in volatile compound group of 14 fish sauce samples by GC-MS.
The major volatile compounds identified in Thai fish sauce samples (T1-T4) and K1 sample produced from anchovy fish were TMA, acetic acid, propanoic acid, 3-methyl butanol, 2-methyl butanol, butanoic acid, methyl pyrazine, 3-methyl butanoic acid, 2-methyl butanoic acid, and 4-methyl pentanoic acid. Different volatile compound amounts may cause different odors. Volatile compounds were only identified in Vietnamese fish sauce samples. These were S-ethyl ethanethioate, cyclohexanone, 2-ethyl-3-methylpyrazine, 2-methyl-1,3-dithiacyclopentane, 2-acetylthiazole, α-methyl benzene methanol, 2-ethyl-3,5-dimethyl pyrazine, phenylmethyl ester acetic acid, ethyl ester benzene acetic acid, 3-acetyl-2,5-dimethylthiophene, and triacetin.
Different volatile compounds were identified in K2 and K3 samples from Sand lance fish and wild fish. These were isobutyronitrile, tetrahydro-3-methylfuran, 2-methylbutanenitrile, 3-(methylthio)-propanenitrile, and benzylnitrile from Sand lance fish and 3-methyl butanamide and dimethyl phthalate from wild fish. It has been reported that TMA, benzaldehyde, and four to seven carbon chain acids were the most important contributors to the aroma of fish sauce. 3-methylbutanal and 2-methylbutanal were also present at concentrations greater than their thresholds of 0.2 and 3 ppb, respectively.[Citation28Citation29] In addition, 2-methyl and 3-methylbutanal, dimethyl disulfide, and benzaldehyde were major aroma active compounds. Recently, Thai fish sauce was evaluated and four odor active compounds were detected (2-methylpropanal, 2-methylbutanal, 2-ethylpyridine, and dimethyl trisulfide) using GCO-aroma extract dilution analysis and QDA® with trained sensory analysis.[Citation4]
Analyzing the OAVs and the Odor Descriptions
Thirty-one OAVs were analyzed for odor thresholds by the GC-O method using 14 fish sauce samples (). Odor descriptions were analyzed by GC-O and compared with previous studies.[Citation30–Citation32Citation49] The results showed that the panelists could detect some odors. These are compared in . The three compounds with the highest OAVs were TMA (rotten fish, ammonia), butanoic acid (rancid butter, cheesy), and 2-methyl butanoic acid (sweet, cheese, rancid). In addition, acetone (light ethereal, nauseating), acetic acid (vinegar, acidic, cheesy), and 3-methyl-1-butanol (rancid, pungent, balsamic) were also important in fish sauce on the basis of OAVs. OAVs of 2-methyl phenol (bitumen, manure, leather) and 4-methyl phenol (horse manure, horse stable-like) were only found in sample J.
TABLE 3 Odor active values in 14 fish sauce samples
TABLE 4 Odor descriptions in 14 fish sauce samples
Among the nitrogen-containing compounds, TMA contributed the major proportion and might impart fishy flavors to those fish sauce products.[Citation30] Previous work showed that 11 odor-active compounds: acetic acid, propanoic acid, 2-methylpropanoic acid, butanoic acid, 3-methylbutanoic acid, dimethyl trisulfide, 3-(methylthio) propanal,1-octen-3-ol, 2-butanol, TMA, and n-propanol, contributed to the aroma characteristics of Thai fish sauce.[Citation7] Also, a determination by GC-MS and GC-O showed that aroma characteristics of Thai and Korean fish sauce including TMA (fishy), butanoic, pentanoic, hexanoic, and heptanoic acid compared to pungent and dirty socks, 2,6-dimethy pyrazine (cooked rice, buttery popcorn) and benzaldehyde (cotton candy).[Citation33]
Analyzing the Taste Compounds
Total salt contents were estimated at 21.30% from the 14 fish sauce samples, ranging from 16.48–25.79% (w/v) in T1-K3 sample, but the J sample was very low at 1.91% (w/v). The lowest was found in the J sample and the highest in the C2 sample (). The concentration of salt is the main composition of the fish sauce which adds saltiness in preparing foods. The concentrations of sodium chloride in fish sauces were similar with the reference average value of 20.5 g/100 mL.[Citation34] The J sample had a much lower value than reported previously, this may have been due to a different production method. The sample also had a variety of ingredients besides pure fish sauce which could be produced by fish and salt ().
TABLE 5 Percentage of sodium chloride in 14 fish sauce samples
shows the results of the concentration of FAAs taste. FAAs in most fish sauce samples showed glutamic acid as the highest content. shows that umami FAAs contents were high in T4, V3, and T1 sample, respectively. Sweet FAAs contents were highest in the T2 sample. Bitter FAAs contents were high in T1 and T4 samples. Umami, sweet and bitter FAAs contents in T3, V2, and C3 samples were very low.
FIGURE 4 Comparison of FAAs taste composition group in 14 fish sauces.
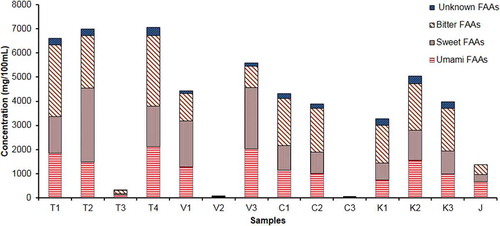
TABLE 6 Concentration of free amino acids in 14 fish sauce samples (mean ± SD, n = 3)
Anchovy fish was used to produce and could be indicated in T1, T2, T3, T4, and K1 (). This group showed the high concentration of umami taste in T1 and T4 samples, with the T3 sample very low. The C2 sample, produced by fish and shrimp had concentration of umami, sweet and bitter FAAs at 1153.95, 1003.06, and 1952.86 mg/100 mL, respectively. Concentration of tastes in the K2 sample, produced from Sand lance fish and krill, produced umami taste 1545.27 mg/100 mL, sweet taste 1263.01 mg/100 mL, and bitter 1909.81 mg/100 mL. This was higher in K3, produced from wild fish, which found umami, sweet, and bitter tastes at 984.24, 955.87, and 1771.18 mg/100 mL, respectively, but lower in the T4 sample, produced from anchovy fish. J sample results which had very different ingredients, gave umami, sweet, and bitter taste at 667.33, 310.07, and 399.84 mg/100 mL, respectively. The results are shown in .
shows the TAVs of FAAs for each of the fish sauce samples.[Citation50] TAVs were a very useful index.[Citation19] Aspartic acid and glutamic acid had high TAVs in fish sauce samples. T4 (187.39) and V3 (369.64) samples were also the highest for aspartic and glutamic acid, respectively. Both of these FAAs were important for the umami taste. Previous studies found that glutamic and aspartic acids showed the highest taste value and lowest threshold in Mountain trout muscles,[Citation35] and that FAAS, such as aspartic and glutamic, are most effective FAAs on the taste. It has been shown that the highest taste values of glutamic and aspartic acids were observed for other seafood, including Skipjack tuna sauce,[Citation36] and Pacific whiting sauce.[Citation37]
TABLE 7 Taste thresholds and taste active values of free amino acids in 14 fish sauce samples
Free glutamic acid is the signaling molecule of the umami taste and the main ingredient in savory condiments.[Citation38] Some reports showed that the umami taste came from glutamic acid and aspartic acid, sweetness from Threonine, Serine, Glycine, and Alanine, and bitterness from Valine, Isoleucine, Leucine, Phenylalanine, Lysine, Histidine, and Arginine. Other FAAs like Cysteine and Methionine were also identified to be bitter in taste.[Citation39] Glutamic acid in Thai fish sauce samples was found to be 950 mg/100 g with the total of FAAs content 7090 mg/100 g.[Citation40]
Mineral compositions in fish sauce samples had very high sodium content compared to the saltiness in fish sauces (). The concentration of sodium in fish sauces was higher than phosphate, magnesium, potassium, and calcium. The results showed that fish sauces had sodium as the main mineral which related to the results of NaCl (%; ). All minerals in fish sauce were identified to be sour and salty. There has been little work done on minerals in the flavor of food.[Citation41] Maybe inorganic salts, such as Na+, K+, Cl−, and PO43− contribute to fish flavor.[Citation42]
TABLE 8 Concentration of minerals in 14 fish sauce samples (mean ± SD, n = 3)
shows the contents of 5´-nucleotides, including 5´-CMP, 5´-UMP, 5´-GMP, 5´-IMP, 5´-AMP, and disodium 5’-ribonucleotides (GMP+IMP). The results show that 5´-nucleotide content was highest in the V1 sample, but very low in T3 and T4. The 5´-CMP contents in K2 and K3 samples were the highest, after the K1 sample. 5´-UMP contents were only found in V3, T2, and C2 samples. In T3, T4, C3, and K1 samples there was no 5´- GMP, but this was highest in the V1 sample. The 5´-IMP content of the V1 sample was the highest, followed by J and V3 samples, but T3 and T4 did not have any. All samples contained 5´-AMP which was the highest in the V2 sample. Disodium 5’-ribonucleotides (IMP+GMP), was shown to affect the taste characteristics of the samples, and the V1 sample was the highest. The highest 5´-nucleotides content was found in the V1 sample, followed by V3. TAVs of GMP, IMP, and AMP in fish sauce samples are shown in . The V1 sample had high GMP (12.31) and IMP (4.96).
TABLE 9 5´-nucleotides contents in 14 fish sauce samples (mean ± SD, n = 3)
TABLE 10 Taste thresholds and taste active values of 5´-guanosine monophosphate, inosine monophosphate, and adenosine monophosphate in 14 fish sauce samples
Nucleotides not only provide foods with an umami taste, but they also improve or modify the taste of foods.[Citation43] The synergism between glutamic acid and 5′-ribonucleotides and the presence of sodium and chloride ions were required to produce the characteristic taste of some food.[Citation41] IMP and GMP are intense flavor-enhancers of the umami taste and are much stronger than monosodium glutamate (MSG). The synergistic effect of flavor 5´-nucleotides with MSG-like components (Glu and Asp) could greatly increase the umami taste of soups.[Citation44] AMP contributed sweetness, but no umami taste; however, there is a synergistic interaction between AMP and IMP in eliciting the umami taste. When a very low concentration of IMP was also present, umami and complexity tastes were elicited, and sweetness was increased.[Citation45]
Analyzing the Sensory Data
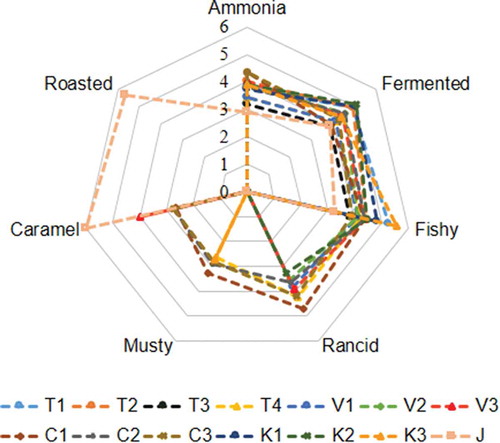
The sensory profiles of 14 fish sauce samples were determined based on the QDA®. Eleven panelists chose the QDA® attributes. shows the scores of odors. Ammonia, fermented, fishy, rancid, musty, caramel, and roasted were chosen as strong odors in each fish sauce sample and were significantly different. Ammonia, fermented and fishy odors were found to be strong in most of the fish sauce samples. Various odors were found in the 14 samples, including ammonia, fermented, roasted, and caramel. Moreover, the J sample showed a large difference when compared to the other samples. The J sample appeared to have different characteristics such as a lower level of ammonia and fermented odor, a higher level of caramel odor, and an additional odor which was deemed to be roasted.
FIGURE 5 The sensory profiles of odors in each fish sauce samples based on generic quantitative descriptive analysis.
The scores of taste are shown in . Umami, salty, salty aftertaste, and fishy aftertaste showed intense tastes in each fish sauce sample which were significantly different. In addition, the QDA® scores showed the intensity of the sweet taste in the Vietnamese (V1, V2, and V3) and Japanese (J) sample. The 13 fish sauce samples (T1-K3) were rated as salty, and not significantly different. The J sample had the lowest result. When the salty taste of each fish sauce sample was compared, each had a different taste, even among the fish sauces produced in the same country. However, the taste of the Vietnamese fish sauce samples (V1, V2, and V3) was the sweetest. The J sample was also compared with the other 13 fish sauce samples. This had many tastes which affected the overall taste of the sauce. The umami taste in fish sauce samples may have affected the quality of the taste.
FIGURE 6 The sensory profiles of tastes in each fish sauce samples based on generic quantitative descriptive analysis.
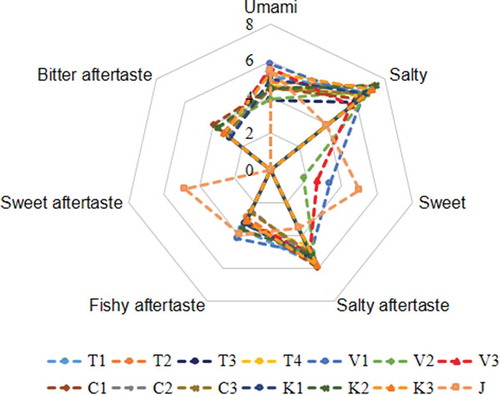
Previous researchers have defined characteristic aromas as fishy, anchovy-like, salty, sweet, sour, shrimp paste-like, meaty, and cheesy. In addition, the ammonia odor has been related to fishy and shrimp paste-like odors.[Citation7] Thai commercial fish sauces (regarding the 15 sensory properties of pure fish sauces and mixed fish sauces), found four tastes (sweet, salty, bitter, and umami) and five aftertastes (sweet aftertaste, salty aftertaste, bitter aftertaste, caramelized flavor, and fishy flavor).[Citation25] Results of the successful QDA® indicated that the panelists were in unison with respect to the relative differences between the samples. However, a limitation of QDA® is that, it is difficult to compare results between different panels, between laboratories, and from one time to another.[Citation46]
The Relationship Between Odor and Taste Compounds with Sensory Attributes
The odor in most of the fish sauce samples was identified as ammonia, fermented, and fishy by sensory evaluation. GC-MS/O was used to identify the volatile compounds and odor. There were significant differences in some volatile compounds which affected the specific odors of each fish sauce sample. However, fish sauce samples still contain odors, which can describe the odor characteristics, including TMA (rotten fish, ammonia), butanoic acid (rancid butter, cheesy), and 2-methyl butanoic acid (sweet, cheese, rancid).
Comparing the results of taste and sensory evaluation of the 14 fish sauce samples the panelists found that the concentration of saltiness was very intense. Chemical analysis is a true indicator of taste concentration components which affect the quality of taste. The most important taste compounds are FAAS and inorganic salts, which are water-soluble and produce the distinct taste of foods.[Citation47] Overall, the samples had umami and salty taste which were the main taste in the fish sauce when compared to taste compounds and sensory evaluation. Components related to umami, such as FAAs and IMP, were considered important to the sensory quality. The contrast of quantification of FAAs and taste intensity depend on many other factors, such as peptide content and some of the flavor compounds, as well as their synergistic effects.[Citation48] The taste compounds were detected by a sweet taste in all samples which related to the sensory test.
CONCLUSION
The results showed the differences in the odor and taste components of various fish sauces from instrument analysis and the sensory tests in this study. Each sample had similarities and differences in odor and taste. There was a significant difference between volatile compounds such as the Vietnamese samples and K2 and K3 samples contained some volatile compounds not found in others. Moreover, the J sample showed a significant difference in odor by the sensory test. The T4 and V3 samples were the highest in aspartic and glutamic acid, both important for the umami taste. The V1 sample had the highest GMP and IMP. The differences in fish species, ingredients and processing techniques can affect the flavors of fish sauces.
FUNDING
The authors would like to thank the members of the Lab of Food Nutrition and Quality Evaluation, College of Food Science, and Technology, Shanghai Ocean University, China for providing help and support for this research.
Additional information
Funding
REFERENCES
- Klomklao, S.; Benjakul, S.; Visessanguan, W.; Kishimura, H.; Simpson, B.K. Effects of the Addition of Spleen of Skipjack Tuna (Katsuwonus Pelamis) on the Liquefaction and Characteristics of Fish Sauce Made from Sardine (Sardinella Gibbosa). Food Chemistry 2006, 98, 440–452.
- Sanceda, N.; Suzuki, E.; Kurata, T. Branched Chain Amino Acids As Source of Specific Branched Chain Volatile Fatty Acids During the Fermentation Process of Fish Sauce. Amino Acids 2003, 24(1), 81–87.
- Sanceda, N.; Suzuki, E.; Kurata, T. Quality and Sensory Acceptance of Fish Sauce Partially Substituting Sodium Chloride or Natural Salt with Potassium Chloride During the Fermentation Process. International Journal of Food Science and Technology 2003, 38(4), 435–443.
- Fukami, K.; Funatsu, Y.; Kawasaki, K.; Watabe, S. Improvement of Fish-Sauce Odor by Treatment with Bacteria Isolated from the Fish-Sauce Mush (Moromi) Made from Frigate Mackerel. Journal of Food Science 2004, 2(69), 45–49.
- Ohmori, T.; Mutaguchi, Y.; Yoshikawa, S.; Doi, K.; Ohshima, T. Amino Acid Components of Lees in Salmon Fish Sauce Are Tyrosine and Phenylalanine. Journal of Bioscience and Bioengineering 2011, 112, 256–258.
- Dougan, J.; Howard, G. Some Flavoring Constituents of Fermented Fish Sauce. Journal of the Science of Food and Agriculture 1975, 26, 887–894.
- Wichaphon, J.; Thongthai, C.; Assavaniga, A.; Lertsiria, S. Volatile Aroma Components of Thai Fish Sauce in Relation to Product Categorization. Flavour and Fragrance Journal 2012, 27, 149–156.
- Park, J.; Fukumoto, Y.; Fujita, E.; Tanakaa, T.; Washioe, T.; Otsukae, S.; Shimizue, T.; Watanabe, K.; Abe, H. Chemical Composition of Fish Sauces Produced in Southeast and East Asian Countries. Bioresource Technology 2006, 97, 2032–2040.
- Curtis, R.I. Umami and the Foods of Classical Antiquity. American Society for Nutrition 2009, 90, 712–718.
- Lopetcharat, K.; Choi, Y.J.; Park, J.W.; Daeschel, M.A. Fish Sauce Products and Manufacturing: A Review. Food Reviews International 2001, 17, 65–88.
- Sato, A.; Sotomaru, K.; Takeda, M.A. Novel Approach for Aroma Components Analysis Using a Monolithic Hybrid Adsorbent As a New Generation Medium “MonoTrap”. 2009. http://scholar.google.hk/scholar (accessed January 07, 2014).
- Wu, W.; Tao, N.; Gu, S. Characteristics of Key Odor Active Compounds in Steamed Meat of Coilia Ectenes from Yangze River by GC-MS-O. European Food Research and Technology 2014, 238, 237–245.
- Lawless, H.T.; Heymann, H. Sensory Evaluation of Food, Principles, and Practices; Aspen Publishers: Gaitherburg, MD, 1998; 827 pp.
- Callejón, R.M.; Morales, M.L.; Ferreira, A.C.S., Troncoso, A.M. Defining the Typical Aroma of Sherry Vinegar: Sensory and Chemical Approach. Journal of Agriculture and Food Chemistry 2008, 56(17), 8086–8095.
- Le, G.S.; Prost, C.; Demaimay, M. Critical Comparison of Three Olfactometric Methods for the Identification of the Most Potent Odorants in Cooked Mussels (Mytilus edulis). Journal of Agriculture and Food Chemistry 2000, 48(4), 1307–1314.
- Ravi, R.; Prakash, M.; Bhat, K.K. Characteristics of Aroma Active Compounds of Cumin (Cuminum Cyminum L.) By GC-MS, E-Nose, and Sensory Techniques. International of Food Properties 2013, 16, 1048–1058.
- Sheen, R. T.; Kahler, H. L. Effect of ions on Mohr method for chloride determination, hydrogen peroxide modification for sulfite elimination Industrial and Engineering Chemistry 1938, 10, 628–629.
- AOAC. 2000. Official Method of Analysis, 17th Ed; Association of Official Analytical Chemists: Washington, DC.
- Chen, D.W.; Zhang, M. Non-Volatile Taste Active Compounds in the Meat of Chinese Mitten Crab (Eriocheir Sinensis). Food Chemistry 2007, 104(3), 1200–1205.
- Murray, J.M.; Delahunty, C.M.; Baxter, I.A. Descriptive Sensory Analysis: Part, Present, and Future. Food Research International 2001, 34, 461–471.
- Stone, H.; Sidel, J.L. Sensory Evaluation Practices; Academic: San Diego, CA, 1993; 387 pp.
- Piper, D.; Scharf, A. Descriptive Analysis—State of the Art and Recent Developments; Series Sensory Analysis number 1, Göttingen, Germany: Forschungsforum, 2004; 1612–3689.
- Kreutzmann, S.; Thybo, A.K.; Bredie, W.L.P. Training of a Sensory Panel and Profiling of Winter Hardy and Colored Carrot Genotypes. Food Quality and Preference 2007, 18, 482–489.
- Elmac, Y.; Yldrm, H.K.; Ycel, U.; Ova, G.; Altu, T. Descriptive Profiling of Flavor Attributes of White Wines from Different Grape Varieties. International Journal of Food Properties 2007, 10(3), 651–659.
- Ritthiruangdej, P.; Suwonsichon, T. Sensory Properties of Thai Fish Sauces and Their Categorization. Kasetsart Journal 2006, 40, 181–191.
- Jiang, J.J.; Zeng, Q.X.; Zhu, Z.W. Analysis of Volatile Compounds in Traditional Chinese Fish Sauce (Yu Lu). Food and Bioprocess Technology 2011, 4, 2666–2671.
- Montel, M.C.; Masson, F.; Talon, R. Bacterial Role in Flavour Development. Meat Science 1998, 49, S111–S123.
- Buttery, R.G.; Ling, L.C.; Stern, D.J. Studies on Popcorn Aroma and Flavor Volatiles. Journal of Agriculture and Food Chemistry 1997, 45, 837–843.
- Buttery, R.G.; Teranishi, R.; Flath, R.A.; Ling, L.C. Identification of Additional Tomato Paste Volatiles. Journal of Agriculture and Food Chemistry 1990, 38, 792–795.
- Giri, A.; Osako, K.; Okamoto, A.; Ohshima, T. Olfactometric Characterization of Aroma Active Compounds in Fermented Fish Paste in Comparison with Fish Sauce, Fermented Soy Paste, and Sauce Products. Food Research International 2010, 43, 1027–1040.
- Shibamoto, T.; Tang, S. “Minor” Tropical Fruits—Mango, Papaya, Passion Fruit, and Guava. In Food Flavours: Part C. The Flavour of Fruit; Morton, A.; MacLeod, A.J.; Eds.; Elsevier: Amsterdam, The Netherlands, 1990; 221–234 pp.
- Czerny, M.; Christlbauer, M.; Christlbaue, M.; Fischer, A.; Granvogl, M.; Hammer, M.; Hartl, C.; Hernandez, N.M.; Schieberle, P. Reinvestigation on Odour Thresholds of Key Food Aroma Compounds and Development of An Aroma Language Based on Odour Qualities of Defined Aqueous Odorant Solutions. European Food Research and Technology 2008, 228(2), 265–273.
- Pham, A.J.; Schilling, M.W.; Yoon, Y.; Kamadia, V.V.; Marshall, D.L. Compounds Using GC-MS, SPME-OSME-GCO, and Stevens’ Power Law Exponents. Journal of Food Science 2008, 73(4), 268–274.
- Park, J.N.; Fukumoto, Y.; Fujita, E.; Tanaka, T.; Washio, T.; Otsuka, S.; Shimizu, T.; Watanabe, K.; Abe, H. Chemical Composition of Fish Sauces Produced in Southeast and East Asian Countries. Journal of Food Composition and Analysis 2001, 14, 113–125.
- Gunlu, A.; Gunlu, N. Taste Activity Value, Free Amino Acid Content, and Proximate Composition of Mountain Trout (Salmo Trutta Macrostigma Dumeril, 1858) Muscles. Iranian Journal of Fisheries Sciences 2014, 13(1), 58–72.
- Cha, Y.J.; Cadwallader, K.R. Aroma Active Compounds in Skipjack Tuna Sauce. Journal of Agricultural and Food Chemistry 1998, 46(3), 1123–1128.
- Tungkawachara, S.; Park, J.W.; Choi, Y.J. Biochemical Properties and Consumer Acceptance of Pacific Whiting Fish Sauce. Journal of Food Science 2003, 68(3), 855–860.
- Yamaguchi, S.; Ninomiya, K. What is Umami? Food Review International 1998, 14, 123–138.
- Warmke, R.; Belitz, H.D.; Grosch, W. Evaluation of Taste Compounds of Swiss Cheese (Emmentaler). Z Lebensm Unters Forsch 1996, 203, 230–235.
- Chotechuang, N. Taste Active Components in Thai Foods: A Review of Thai Traditional Seasonings. Journal Nutrition and Food Science 2012, S10:004. doi:10.4172/2155-9600.S10-004
- Fuke, S.; Konosu, S. Taste-Active Components in Some Foods: A Review of Japanese Research. Physiology and Behavior 1991, 40, 863–868.
- Shahadi, F. Flavor of Meat, Meat Products, and Sea foods, 2nd Ed.; Blackie Academic & Professional: New York, NY, 1998; 429 pp.
- Kotani, K.; Toyota, T.; Yasumatsu, K. 5′-Ribonucleotides as flavor enhancers. Developments in Food Science 1992, 28, 523–545.
- Yamaguchi, S.; Yoshikawa, T.; Ikeda, S.; Ninomiya, T. Measurement of the Relative Taste Intensity of Some a-Amino Acid and 5´-Nucleotides. Journal of Food Science 1971, 36, 846–849.
- Fuke, S.; Ueda, Y. Interactions Between Umami and Other Flavor Characteristics. Trends in Food Science and Technology 1996, 7(12), 407–411.
- Prost, C.; Hallier, A.; Cardinal, M.; Serot, T.; Courcoux, P. Effect of Storage Time on Raw Sardine (Sardina Pilchardus) Flavor and Aroma Quality. Journal of Food Science 2004, 69(5), 198–204.
- Nguyen, H.D.; Wang, X.C. Volatile, Taste Components, and Sensory Characteristics of Commercial Brand Oyster Sauces: Comparisons and Relationships. International Journal of Food Properties 2012, 15, 518–535.
- Schlichtherle-Cerny, H.; Grosch, W. Evaluation of Taste Compounds of Stewed Beef Juice. Z-Lebensm Unters Forsch A 1998, 207, 369–376.
- Mohamed, H.N.; Man, Y.C.; Mustafa, S.; Manap, Y.A. Tentative Identification of Volatile Flavor Compounds in Commercial Budu, Malaysian Fish Sauce, Using GC-MS. Molecules 2012, 17, 5062–5080.
- Kato, H.; Rhue, M.R.; Nishimura, T. Role of Free Amino Acids and Peptides In Food Taste. In Flavors Chemistry Trends and Developments, ACS Symposium Series; Teranishi, R.; Butterry, R.G.; Shahidi, F.; Eds.; American Chemical Society: Washington, DC, 1989; 159 p.