
Abstract
The stability enhancing effect of ferulic acid on anthocyanins from purple corn cob was investigated in a model system. The addition of ferulic acid provided color-enhancing and stabilizing effects on purple corn cob during storage and heating. These effects were observed through changes in spectrophotometric and CIE L*a*b* color space parameters. In test samples enhanced with ferulic acid, high-performance liquid chromatography–mass spectrometry detected and identified three new anthocyanin-derived pigments, cyanidin-3-glucoside-vinylguaiacol, pelargonidin-3-glucoside-vinylguaiacol, and peonidin-3-glucoside-vinylguaiacol, with respective m/z values of 595, 579, and 609.
INTRODUCTION
Anthocyanins existed widely in the higher order plants, being found in the roots, caudexes, leaves, and in the flowers and fruits. They are in high demand by the food industry to replace synthetic dyes because of legislative action and consumer concern about synthetic food additives.[Citation1] The anthocyanins also possess known pharmacological properties and are used by humans for therapeutic purposes. Several studies have shown that anthocyanins have a demonstrated ability to protect against a myriad of human diseases such as liver dysfunction, hypertension, vision disorders, microbial infections, and diarrhea.[Citation2–Citation5]
Purple corn is a pigmented variety of Zea mays L. and rich in resource in China. Recently, anthocyanins from purple corn have been reported to have various biological activities, such as antioxidant,[Citation6] antimicrobial,[Citation7] and anti-obesity activities, amelioration of hyperglycemia,[Citation8] and anticarcinogenic properties.[Citation9] Purple corn cob is often neglected and discarded in production. However, it was discovered that purple corn cob contains rich anthocyanins.[Citation10] Additionally, it is also non-season dependent and less expensive when compared to most of other sources of anthocyanins, such as the grape and strawberry. Clearly, purple corn cob can be used as an alternative source of natural colorant.
It is well-known that the color and stability of anthocyanin strongly depend on the pH, appearing red in acidic, violet in neutral, and blue in basic aqueous solutions.[Citation11] anthocyanins from purple corn cob is a less stable pigment in comparison to acylated anthocyanins from many other higher order plants. Thus, it is important to find ways to enhance and stabilize the anthocyanins and their colors. Intermolecular co-pigmentation of anthocyanins is the main color-stabilizing mechanism in plants.[Citation12,Citation13] The co-pigments include flavonoids, alkaloids, amino acids, organic acids, polysaccharides, and anthocyanins themselves.[Citation14]
Ferulic acid (FA) is an organic phenolic molecule with an important role in plant tissue. In addition to having a significant metabolic function and a component of plant tissue, cinnamic acids constitute the main acyl group in the structure of acylated anthocyanins, taking privileges over many other organic acids color enhancers, such as citric acids and benzoic acid.[Citation15] Gris et al.[Citation16] evaluated the intermolecular co-pigmentation reaction of anthocyanins in grapes with FA using ultraviolet-visible (UV-Vis) spectrophotometry. Rein et al.[Citation17] detected the formation of novel pigments in strawberry and raspberry juices after the addition of FA and postulated a stabilizing effect of FA on the color of fruit juices.
Current research on anthocyanins from purple corn has focused mainly on the analysis of their stability and structures.[Citation10,Citation18] Some researchers[Citation18] reported that the stability of anthocyanins from purple corn cob were lower than those from purple sweet potato and synthetic dyes. However, little information is available on increasing the stability of anthocyanin from purple corn cob through the addition of FA. Therefore, the objectives of this study were to evaluate the effect of FA on the color and stability of anthocyanins from purple corn cob under storage conditions of darkness at 25 ± 2°C, and to identify the structure of new anthocyanin-derived pigments responsible for enhanced test samples.
MATERIALS AND METHODS
Materials
Purple corn cob was generously supplied by Professor Zhong Zhang at Anhui Technical Teachers College (Fengyang City, Anhui Province, China). The cob was dried in a heated air drier (50°C; ZT-3, Jiangdu City, Jiangsu Province, China), pulverized by a disintegrator (FSD-100A, Taizhou City, Zhejiang Province, China), and sifted through a 100-mesh sieve. The resulting purple corn cob powder was stored at 4°C until use. The FA was obtained from Sigma Company (USA). All other reagents were of analytical grade.
Extraction of Anthocyanins and Preparation of the Model System
Purple corn cob powder (100 g) was macerated with 400 mL methanol for 24 h in the dark at 4°C. The crude extract obtained was filtered through nylon, and the cob remains were washed with 200 mL of ethanol and then the crude extract filtrate was collected. The extract was concentrated to 50% of the methanol initial volume and evaporated under vacuum at 35°C. Afterward, the concentrated extracts of anthocyanins were filtered through a 0.45 mm Millipore filter and kept in an amber flask at 4 ± 1°C. To prepare the anthocyanins-rich model system, the extract of concentrated anthocyanins was dissolved and diluted in citrate buffer (0.1 M, Merck citrate acid-sodium citrate) at pH 3.0 to make a solution with an absorbance value close to 0.500. For the storage study, 0.05% potassium sorbate (g/L) was added to prevent bacterial growth.
Addition of FA to the Anthocyanins-Rich Model System
To enhance the color of the purple corn cob anthocyanin solutions, FA was used as the color co-pigment in this study. Stock solutions of FA (2, 4, and 6 mg mL–Citation1) were selected to obtain three levels of enhancement. Then, 2 mL of each of the three FA concentrations was added individually into the anthocyanins-rich solutions (3 mL) of the model system. The solutions were mixed and left for 2 h in the dark to reach equilibrium at room temperature (25 ± 2°C). Thereafter, the solutions were subjected to UV-Vis spectrophotometric and CIELAB measurements. Then, the control (without FA enhancement) and test samples (with FA enhancement) were stored at 25 ± 2°C in sealed tubes, and the color stability, thermal stability, and color enhancement of all samples were followed using a UNIC-2802 spectrophotometer (Unico, USA), D-65 diffused illumination of a Minolta Chroma CR-400 Colorimeter, and a high-performance liquid chromatography (HPLC) measurements as described below.
Spectrophotometric Measurements
Absorption spectra of the control and test samples were recorded using a UV-Vis spectrophotometer scanning in the visible wave length range of 450–650 nm. The change in the maximum absorbance (Amax) at varying wavelengths (λmax) was observed. This revealed a possible hyperchromic effect (ΔAmax) and bathochromic shift (Δλmax), resulting from the formation of a longer chromatophore through an intermolecular interaction between the FA and the anthocyanins.
Color Measurements
Tristimulus parameters (L*, C*, and h°) were calculated using CR-S4w software (CR400, Konica Minolta, Japan), based on the CIE L*a*b* color space. A standard D65 illuminator was used at a ∆λ of 5 nm.[Citation19]
High-Performance Liquid Chromatography–Mass Spectrometry (HPLC–MS) Analysis
Identification was performed with a HPLC system (Waters 2690) using a Waters 2996 photodiode array detector. Data analysis was performed with Waters HPLC ChemStation software. Solvents and samples were filtered through a 0.45 μm filter. Chromatographic analysis was carried out by using a LiChrospher C-18 (5 μm 2.1 mm × 250 mm i.d.) prodigy. Simultaneous monitoring was performed at 520 nm at a flow rate of 0.8 mL/min, running temperature of 35°C, and injection volume of 10 μL. Mobile phase A was a mixture of 0.05% (v/v) trifluoroacetic acid in distilled water, whereas B consisted of 100% HPLC-grade acetonitrile. The separation of the anthocyanins was carried out for 40 min. The elution profile was a linear gradient elution with solvent A at 95–80% from 0 to 20 min and at 80–60% from 20 to 50 min at a flow rate of 0.8 mL/min. The identities of anthocyanins were checked and then confirmed by using electrospray MS with a Waters Platform ZMD 4000 mass spectrometer equipped with an ion spray interface (ISV = 4400) operated in the positive-ion mode. Spectra were recorded in positive ion mode between m/z 200 and 1200.
Statistical Analysis
All trials were carried out in triplicate and all data are reported as mean ± standard deviation (n = 3). Statistical significance was established using the Student t-test at p < 0.05.
RESULTS AND DISCUSSION
Effect of FA on Spectral Characteristics
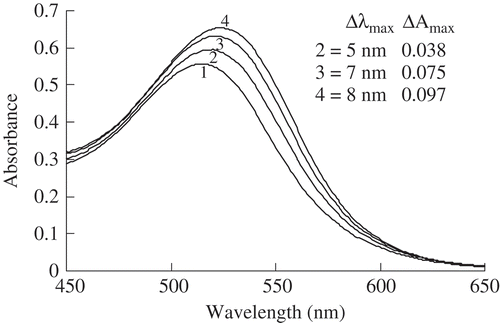
illustrates the spectrophotometric results of the effect of phenolic acids on the absorption spectrum of the anthocyanins at pH 3.0 following color enhancement of the anthocyanins by adding various concentrations (2, 4, and 6 mg/mL) of FA. The spectrophotometric curves verify that FA promoted an increase in the maximum absorption wavelength (bathochromic effect – Δλmax) and absorbance (hyperchromic effect – ΔAmax). Specifically, the respective wavelength and absorbance of the control samples were 515 nm and 0.557 as λmax and Amax values, whereas those of the test samples were 520 nm and 0.595, 522 nm and 0.632, and 523 nm and 0.654 at the respective FA concentrations of 2, 4, and 6 mg mL–Citation1 (). The increase in FA concentration in the anthocyanin solutions produced increases in the hyperchromic shift and bathochromic effects (). These results were in agreement with earlier research[Citation16,Citation20,Citation21] and confirm that the co-pigmentation reaction (the hyperchromic shift and bathochromic effects) depends on the concentration of the co-pigment. The concentration of FA used in the experiment to check stability was 6 mg mL–Citation1 because greater hyperchromic effect (ΔAmax) and bathochromic shift (Δλmax) effects were observed at this concentration in the anthocyanin maximum absorption wavelength ().
FIGURE 1 Effect of various concentrations of ferulic acid on the visible light spectral characteristics in the model system. (1): control samples (anthocyanins without ferulic acid; λmax = 515 nm and Amax = 0.557); (2), (3), and (4): test samples (anthocyanins with ferulic acid) with various concentrations (2, 4, and 6 mg mL–Citation1, respectively) of ferulic acid.
Effect of FA on the Stability of Anthocyanins during Storage
The addition of FA to the anthocyanins solutions improved the color of the anthocyanins during storage (). The effect of adding FA on the hyperchromic effects caused shifts in the Amax value but to different extents. The control sample solutions showed a lower Amax, from 0.557 to 0.315, whereas the test sample solutions showed a significant upward shift in Amax values, from 0.654 to 0.793, at the beginning and the end of storage, respectively.
FIGURE 2 Effect of ferulic acid on the visible light spectral characteristics of the model system initially and after 90 days of storage at 25°C while protected from light. (1): control samples (anthocyanins without ferulic acid); (2): samples enhanced with ferulic acid. The concentration of ferulic acid was 6 mg mL–Citation1. (A): before storage; (B): after 90 days of storage.
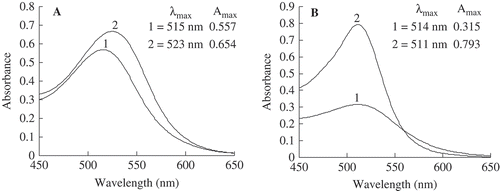
The addition of FA to the test samples improved the stability of the anthocyanins during storage, and the enhancement of stability, measured as the shift of the Δλmax of the absorption spectra during storage, was time dependent. The control sample, considered to indicate a zero bathochromic shift (Δλmax = 0 nm) at the beginning of storage, showed a hypsochromic shift (shift to a lower value of Δλmax) of 1 nm (from 515 to 514 nm) at the end of 90 days of storage. The values of λmax in the test samples also decreased, with a bathochromic shift from 523 at the beginning to 511 nm at the end of storage. Similarly, a bathochromic shift of anthocyanins from red wine enhanced with caffeic acid was reported to decrease as the numbers of fermentation days increased.[Citation16] In contrast, Yawadio et al.[Citation22] reported that the λmax values of black rice anthocyanins enhanced with FA continued to increase after 28 days of storage.
Effect of FA on the Color Parameters
As shown in , there were noticeable changes in the C* and h° parameters for the control and test samples, both initially and at the end of 90 days of storage, confirming that FA greatly improved the color of the test samples by enhancing the color intensity of the purple corn cob anthocyanins and stabilizing the color during storage. The initial color parameter values for the control and test samples were, respectively, 14.75 ± 0.18 and 28.66 ± 0.14 for C* and 21.93 ± 0.18 and 16.67 ± 0.12 for h°. The initial values showed that the color of the test samples was more intense than that observed in the control sample. Previous reports of color enhancement by different phenolic acids have mostly concerned red wine only.[Citation21,Citation23] The assumption has been that most co-pigmentation reactions in wine involve fermentation. Here, it was shown that anthocyanin co-pigmentation reactions do not require fermentation and can also take place in non-fermented test samples over a 2-h period.
TABLE 1 Effect of ferulic acid on the color changes of anthocyanins from purple corn cob at pH 3.0, initially and after 90 days storage at 25°C protected from light
The metric chroma correlates with color saturation of the color.[Citation24] The C* of the original control sample decreased after storage from 14.75 ± 0.18 to 10.88 ± 0.11, and the same tendency was observed for the test samples, decreasing from 28.66 ± 0.14 to 21.11 ± 0.14. These data indicated that the addition of FA significantly (p < 0.05) increased the values of C* during storage, leading to a more vivid color.
A significant increase in the hue angle (h°) values occured in all control and test samples, ranging from 21.93 ± 0.18 to 44.85 ± 0.16 and 16.67 ± 0.12 to 40.95 ± 0.12, respectively (p < 0.05). These changes were accompanied by tonality changes from red to orange-red as the h° values increased over the 90-day time. The h° value of the control sample at the end of storage was significantly greater than that of the test samples (p < 0.05; ). This result supports the present work, which demonstrated that the addition of FA could increase the color stability of anthocyanins and maintain the orange-red color of the test samples.
Identification of Changes in the Relative Composition of Anthocyanins in Control and Test Samples by HPLC–MS Analysis
As shown in , Peak 1 was cyanidin-3-glucoside with a molecular ion [M+H]+ at m/z 449 and a fragment ion [M+H-162]+ at m/z 287 corresponding to cyanidin, which lost glucose from cyanidin-3-glucoside. Peak 2, with [M+H]+ at m/z 433, was identified as pelargonidin-3-glucoside. Fragment ion [M+H-162]+ at m/z 271, which corresponded to pelargonidin, lost glucose from pelargonidin-3-glucoside. Peak 3, with [M+H]+ at m/z 463, was identified as peonidin-3-glucoside. The fragment ion at m/z 301, with a loss of 162 from peonidin-3-glucoside, was characterized as peonidin. Peak 4, with [M+H]+ at m/z 535, was identified as cyanidin-3-(6-malon)-glucoside. The fragment ion [M+H-162-86]+ at m/z 287 was characterized as cyanidin, which lost a glucose (-162) and a malonic acid (-86) from pelargonidin-3-(6-malon)-glucoside. Peak 5, with [M+H]+ at m/z 519, was identified as pelargonidin-3-(6-malon)-glucoside. The fragment ion at m/z 433, with a loss of 162 from pelargonidin-3-glucoside, was characterized as pelargonidin. Peak 6, with [M+H]+ at m/z 549, was identified as peonidin-3-(6-malon)-glucoside. The fragment ions at m/z 463 and 301 referred to peonidin-3-glucoside and peonidin, respectively. Peak 7, with [M+H]+ at m/z 575 and the fragment ions at m/z 449 may be cyanidin-3-glucoside. However, we have no additional evidence for, nor can we suggest the possible identity of, the remaining residue of 126 amu.
TABLE 2 Identification of the pigment compounds of test samples by HPLC-MS before and after 90 days storage
To investigate the changes in composition of the anthocyanins from purple corn cob after adding FA, the control and test samples were separated by HPLC (). Because standards for anthocyanins and the new anthocyanin-derived pigments were unavailable, their identification was carried out by comparison of their retention times and by confirming the molecular weights with electrospray ionization/mass spectrometry (ES/MS).
FIGURE 3 Changes in HPLC profiles of test samples at the beginning and end of storage. (A): before storage; (B): after 90 days of storage. (1): cyanidin-3-glucoside; (2): pelargonidin-3-glucoside; (3): peonidin-3-glucoside; (4): cyanidin-3-(6-malon-glucoside); (5): pelargonidin-3-(6-malon-glucoside); (6) and (7): peonidin-3-(6-malon-glucoside).
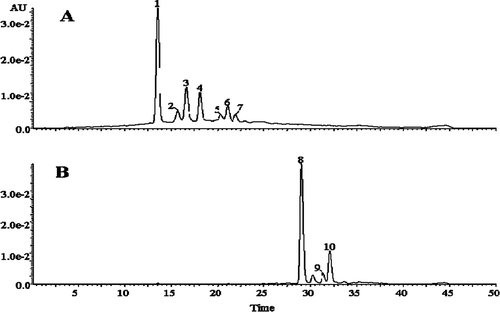
, which shows the HPLC chromatograms of test samples before () and the end of 90 days of storage (), indicates that new pigments were formed in the test samples. Compared with , the original seven peaks were not detected in . Three new peaks appeared in the HPLC chromatograms of the test samples, indicating that new pigments were formed from the samples, and they were eluted after 29.1, 31.4, and 32.1 min, respectively, for peak 8, 9, and 10.
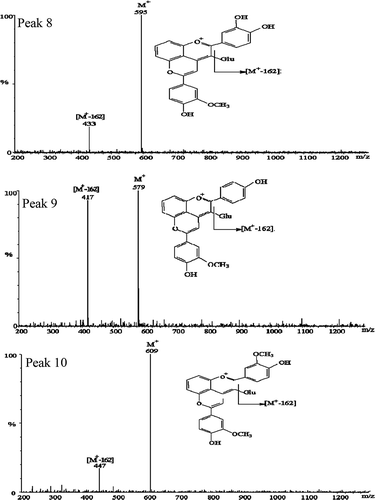
To provide further evidence of the formation of novel pigments after adding FA, newly formed compounds were detected by HPLC–MS. These new compounds are identified results were shown in and . As shows, the mass spectra of the new pyranoanthocyanin molecules detected from the test samples indicate that novel pigments were formed and give a clear explanation of the origin of the color enhancement resulting from this co-pigmentation between purple corn cob anthocyanins and FA. also shows the molecular ions of the three new anthocyanin-derived pigments. Peak 8 was a cyanidin-3-glucoside-vinylguaiacol adduct with molecular ion [M+] at m/z 595. The fragmentation product, [M+ – 162] (cyanidin-vinylguaiacol) at m/z 433, is consistent with the loss of a glucoside. Peak 9, with [M+] at m/z 579, was identified as a pelargonidin-3-glucoside-vinylguaiacol adduct. Fragment ion [M+ – 162] was at m/z 417, which corresponds to pelargonidin-vinylguaiacol. Peak 10 was a [M+] ion with m/z 609, which corresponds to the mass of a peonidin-3-glucoside-vinylguaiacol adduct, another pyranoanthocyanin, producing the fragmentation of [M+ – 162] at m/z 447.
FIGURE 4 Positive ion mass spectra and molecular structure of the novel co-pigmentation compounds formed in the test sample and detected after 90 days of storage. Peak 8: cyanidin-3-glucosede-vinyguaiacol; Peak 9: pelargonidin-3-glucosede-vinylguaiacol; Peak 10: peonidin-3-glucosede-vinylguaiacol; Glu: glucoside.
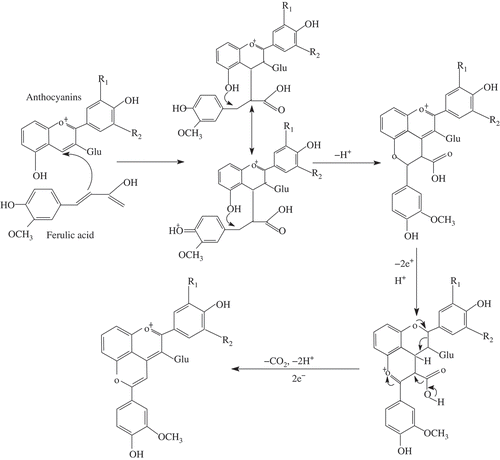
Anthocyanin monoglucosides are known to form adducts to their 4-carbon and 5-hydroxyl positions, with the smallest pyranoanthocyanins being vitisin B[Citation25] and other pyruvic acid derivatives.[Citation26–Citation28] Cinnamic acids, which have also been observed to form pyranoanthocyanins with monoglucosides, have been found mainly with malvidin-3-glucoside.[Citation29,Citation30] Rein et al.[Citation17] detected the formation of hydroxyphenyl-pyranoanthocyanins in strawberry and raspberry juices after the addition of FA and postulated a stabilizing effect on the color of fruit juices. Yawadio et al.[Citation22] used high performance liquid chromatography – diode array detection – mass spectrometry (HPLC-DAD-MS) to investigate the novel pigments (pyranoanthocyanins) isolated and detected from black rice anthocyanins enhanced with FA. To our knowledge, however, this is the first time that the detection of pyranoanthocyanins in a purple corn cob anthocyanin model system has been reported. According to results of the present work, this is clear evidence of the formation of new pigments,[Citation29] and the proposed mechanism for the reaction is shown in .
FIGURE 5 The proposed pathway of formation of the new pyranoanthocyanin adduct with anthocyanin-3-glucoside and ferulic acid; Glu: glucoside.
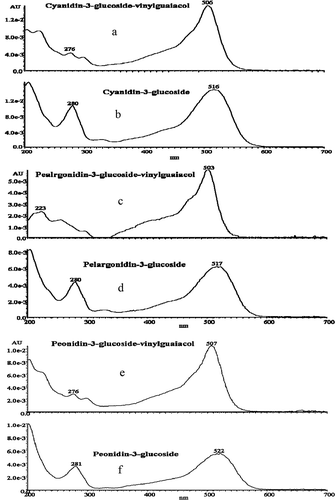
The spectra for the anthocyanins and new pigments in the control and test samples are presented in . The three new kinds of pigments all showed a bathochromic shift. The cyanidin-3-glucoside-vinylguaiacol adduct, pelargonidin-3-glucoside-vinylguaiacol adduct, and peonidin-3-glucoside-vinylguaiacol adduct showed bathochromic shift at λmax 506, 503, and 507 nm (Δλmax = 10, 14, and 15 nm, compared to cyanidin-3-glucoside, pelargonidin-3-glucoside, and peonidin-3-glucoside, respectively). The shape of the main spectral band for the novel pigments was narrow and pointed, as was similarly noticed by Rein et al.[Citation17] The color of the novel anthocyanin-derived wine pigments has been reported to be orange-red,[Citation31,Citation32] similar to the new pigments in the test samples ().
FIGURE 6 Absorption spectrum of (a) cyanidin-3-glucoside-vinylguaiacol; (b) cyanidin-3-glucoside; (c) pelargonidin-3-glucoside-vinylguaiacol; (d) pelargonidin-3-glucoside; (e) peonidin-3-glucoside-vinylguaiacol; and (f) peonidin-3-glucoside.
CONCLUSION
The experimental results suggested that anthocyanins from purple corn cob, a less stable pigment, can be converted into a vinylguaiacol adduct (a more stable compound) through the addition of FA, resulting in the enhancement of the color and stability of the anthocyanins. The co-pigmentation of the anthocyanins studied here improved the color of purple corn cob anthocyanins by stabilizing and enhancing their spectrophotometric and CIELAB parameters. This co-pigmentation also resulted in the formation vinylpyranoanthocyanins in the test samples, which possessed higher coloring properties, heat stability, and stronger color as compared to the corresponding control sample. These results indicated that FA can be used as a tool to increase the stability of purple corn cob.
FUNDING
This research is supported by a series of scientific funding plans in China comprising the Jiangsu “Green and Blue” Engineering Program [2014] 23, the Jiangsu Overseas Research and Training program [2011] 34, and several other scientific support plans (JHB2011-76, HAP201209, HAP201301, HC201316-8, and HG201309).
Additional information
Funding
REFERENCES
- Francis, F.J. Food Colorants: Anthocyanins. Critical Reviews in Food Science and Nutrition 1989, 28, 273–314.
- Mirela, K.; Martina, O.; Vlasta, P. Anthocyanins, Phenols, and Antioxidant Activity of Sour Cherry Puree Extracts and Their Stability During Storage. International Journal of Food Properties 2014, 17, 1393–1405.
- Šamec, D.; Žegarac, J.P. Fluctuations in the Levels of Antioxidant Compounds and Antioxidant Capacity of Ten Small Fruits During One Year of Frozen Storage. International Journal of Food Properties 2015, 18, 21–32.
- Smith, M.; Marley, K.; Seigler, D.; Singletary, K.; Meline, B. Bioactive Properties of Wild Blueberry Fruits. Journal of Food Science 2000, 65, 352–356.
- Wang, C.J.; Wang, J.M.; Lin, W.L.; Chu, C.Y.; Chou, F.P.; Tseng, T.H. Protective Effect of Hibiscus Anthocyanins Against Tert-Butyl Hydroperoxide-Induced Hepatic Toxicity in Rats. Food and Chemical Toxicology 2000, 38, 411–416.
- Cevallos-Casals, B.A.; Cisneros-Zevallos, L. Stoichiometric and Kinetic Studies of Phenolic Antioxidants from Andean Purple Corn and Red-Fleshed Sweet Potato. Journal of Agricultural and Food Chemistry 2003, 51, 3313–3319.
- Cevallos-Casals, B.A.; Cisneros-Zevallos, L.A. A Comparative Study of Antimicrobial, Antimutagenic and Antioxidant Activity of Phenolic Compounds from Purple Corn and Bilberry Colorant Extracts. In Book of Abstracts of the Institute of Food Technologists Technical Program Abstracts; Chicago, IL, 2003; Poster 14E-1.
- Tsuda, T.; Horio, F.; Uchida, K.; Aoki, H.; Osawa, T. Dietary Cyanidin 3-O-Beta-D-Glucoside-Rich Purple Corn Color Prevents Obesity and Ameliorates Hyperglycemia in Mice. The Journal of Nutrition 2003, 133, 2125–2130.
- Hagiwara, A.; Miyashita, K.; Nakanishi, T.; Sano, M.; Tamano, S.; Kadota, T.; et al. Pronounced Inhibition by a Natural Anthocyanin, Purple Corn Color, of 2-amino-1-methyl-6-phenylimidazo[4,5-b]pyridine (PhIP)-Associated Colorectal Carcinogenesis in Male F344 Rats Pretreated with 1,2-dimethylhydrazine. Cancer Letters 2001, 171, 17–25.
- Pascual-Teresa, S.; Santos-Buelga, C.; Rivas-Gonzalo, J.C. LC-MS Analysis of Anthocyanins from Purple Corn Cob. Journal of the Science of Food and Agriculture 2002, 82, 1003–1006.
- Goto, T.; Kondo, T. Structure and Molecular Stacking of Anthocyanins—Flower Color Variation. Angewandte Chemie International Edition in English 2003, 30, 17–33.
- Mazza, G.; Brouillard, R. Recent Developments in the Stabilization of Anthocyanins in Food Products. Food Chemistry 1987, 25, 207–225.
- Davies, A.J.; Mazza, G. Copigmentation of Simple Acylated Anthocyanins with Colorless Phenolic Compounds. Journal of Agricultural and Food Chemistry 1993, 41, 716–720.
- Mazza, G.; Brouillard, R. The Mechanism of Co-Pigmentation of Anthocyanins in Aqueous Solutions. Phytochemistry 1990, 29, 1097–1102.
- Harborne, J.B. Comparative Biochemistry of the Flavonoids. Academic Press: London, UK, 1967; 383 pp.
- Gris, E.F.; Ferreira, E.A.; Falcão, L.D.; Bordignon-Luiz, M.T. Influence of Ferulic Acid on Stability of Anthocyanins from Cabernet Sauvignon Grapes in a Model System and a Yogurt System. International Journal of Food Science and Technology 2007, 42, 992–998.
- Rein, M.J.; Ollilainen, V.; Vahermo, M.; Yli-Kauhaluoma, J.; Heinonen, M. Identification of Novel Pyranoanthocyanins in Berry Juices. European Food Research and Technology 2005, 202, 239–244.
- Cevallos-Casals, B.A.; Cisneros-Zevallos, L. Stability of Anthocyanin-Based Aqueous Extracts of Andean Purple Corn and Red-Fleshed Sweet Potato Compared to Synthetic and Natural Colorants. Food Chemistry 2004, 86, 69–77.
- Fan, G.J.; Han, Y.B.; Gu, Z.X.; Gu, F.R. Composition and Color Stability of Anthocyanins Extracted from Fermented Purple Sweet Potato Culture. LWT–Food Science and Technology 2008, 41, 1412–1416.
- Bąkowska, A.; Kucharska, A.Z.; Oszmiański, J. The Effects of Heating, UV Irradiation, and Storage on Stability of the Anthocyanin–Polyphenol Copigment Complex. Food Chemistry 2003, 81, 349–355.
- Darias-Martín, J.; Martín-Luis, B.; Carrillo-López, M.; Lamuela-Raventós, R.; Díaz-Romero, C.; Boulton, R. Effect of Caffeic Acid on the Color of Red Wine. Journal of Agricultural and Food Chemistry 2002, 50, 2062–2067.
- Yawadio, R.; Morita, N. Color Enhancing Effect of Carboxylic Acids on Anthocyanins. Food Chemistry 2007, 105, 421–427.
- Mateus, N.; Freitas, V. Evolution and Stability of Anthocyanins-Derived Pigments During Port Wine Aging. Journal of Agricultural and Food Chemistry 2001, 49, 5217–5222.
- Gonnet, J.F. Color Effects of Co-Pigmentation of Anthocyanins Revisited-2. A Colorimetric Look at the Solutions of Cyanin Copigmented by Rutin Using the CIELAB Scale. Food Chemistry 1999, 66, 387–394.
- Bakker, J.; Timberlake, C.F. Isolation, Identification and Characterization of New Color-Stable Anthocyanins Occurring in Some Red Wines. Journal of Agricultural and Food Chemistry 1997, 45, 35–43.
- Fulcrand, H.; Benabdeljalil, C.; Rigaud, J.; Cheynier, V.; Moutounet, M. A New Class of Wine Pigments Generated by Reaction Between Pyruvic Acid and Grape Anthocyanins. Phytochemistry 1998, 47, 1401–1407.
- Mateus, N.; Silva, A.M.; Vercauteren, J.; de Freitas, V.; Occurrence of Anthocyanin-Derived Pigments in Red Wines. Journal of Agricultural and Food Chemistry 2001, 49, 4836–4840.
- Vivar-Quintana, A.M.; Santos-Buelga, C.; Rivas-Gonzalo, J.C. Anthocyanin-Derived Pigments and Colour of Red Wines. Analytica Chimica Acta 2002, 458, 147–155.
- Schwarz, M.; Wabnitz, T.C.; Winterhalter, P. Pathway Leading to The Formation of Anthocyaninevinylphenol Adducts and Related Pigments in Red Wines. Journal of Agricultural and Food Chemistry 2003, 51, 3682–3687.
- Hakansson, A.E.; Pardon, K.; Hayasaka, Y.; De Sa, M.; Herderich, M. Structures and Colour Properties of New Wine Pigments. Tetrahedron Letters 2003, 44, 4887–4891.
- Francia-Aricha, E.M.; Guerra, M.T.; Rivas-Gonzalo, J.C.; Santos-Buelga, C. New Anthocyanin Pigments Formed after Condensation with Flavanols. Journal of Agricultural and Food Chemistry 1997, 45, 2262–2266.
- Mateus, N.; De Pascual-Teresa, S.; Rivas-Gonzalo, J.C.; Santos-Buelga, C.; De Freitas, V. Structural Diversity of Anthocyanin- Derived Pigments in Port Wines. Food Chemistry 2002, 76, 335–342.