
Abstract
The presence of pig derivatives, such as porcine gelatin, in any products is prohibited to be consumed by Muslim community. This study is intended to develop a specific primer from mytochondrial D-loop capable of amplifying DNA from porcine gelatin in commercial capsule shells. Two pairs of primers designed from mitochondrial D-loop region were tested in order to confirm the primer specificity in gelatin sources (pork, beef, and catfish) and fresh tissue (pig, cows, goat, chickens, and rat). Primers were then used to perform sensitivity test of six dilution series (1000, 200, 100, 10, 5, and 1 pg/µL) of porcine gelatin and porcine capsule shell. The amplification was also performed on capsule shell from porcine-bovine mixture gelatin at 0, 10, 20, 30, 40, 50, and 100% concentration. The repeatability test was performed by measuring amplification capsule shells from porcine–bovine gelatin mixture. Real time polymerase chain reaction method using primers designed was further applied to analyze capsule shells purchased from markets. From two primers have been designed specifically, only primer D-Loop 108 (forward: 5’-CGT ATG CAA AAA ACC ACG CCA-3’; reverse: 5’-CTT ACT ATA GGG AGC TGC ATG-3’) had the capability to identify the presence of porcine DNA in fresh tissue and gelatin sources at optimum annealing temperature of 58.4ºC. Sensitivity of the developed method expressed as limit of detection of DNA in gelatin and capsule shells is 5 pg.
Introduction
From a Muslim point-of-view, the government has an obligation to ensure that food and other products consumed is halal. “Halal” is an Arabic term associated with any products allowed to be consumed by Muslims according to Islamic law, known as Syariah Law.[Citation1] One of the non-halal components frequently met in food and pharmaceutical products is gelatin coming from fish and pig bones (porcine gelatin).
Originally, gelatin material is important because of its extensive use for capsule shells, food, and cosmetics that are generally not listed on the label.[Citation2] Chemically, gelatin is a mixture of polypeptides prepared by hydrolysis of collagen. Gelatin can be extracted from skins, bones, and hides of mammalian animals such as pig and cow.[Citation3] According to the Gelatin Manufacturers Institute of America (GMIA),[Citation4] commercial gelatin is obtained from bovine and porcine, in which an approximately of 90% of gelatin is coming from porcine. The Syariah (Islamic law) prohibited Muslim to consume any products containing porcine gelatin.[Citation5] The analytical method was indispensable to be developed for the detection and quantification of gelatin made from porcine.
Numerous analytical techniques have been developed, proposed, and used by researchers and industries for analysis of gelatins namely chemical precipitation,[Citation6] Fourier transform infrared spectroscopy,[Citation7] High-performance liquid chromatography coupled with fluorescence detector,[Citation8] mass-spectrometer detection,[Citation9,Citation10] enzyme-linked immuno-sorbent assay,[Citation11] and DNA-based technique using polymerase chain reaction (PCR).[Citation12,Citation13] Real-time polymerase chain reaction (qPCR) using specific primers offers an alternative test due to its better DNA stability which can directly monitor cycles of amplification using a fluorescent label.[Citation14–Citation16] qPCR has been succesfully used for analysis of pig derivatives for halal authentication studies.[Citation17,Citation18]
Newly primer from mitochondrial D-loop porcine DNA region that has not been published become promising targets for PCR amplification.[Citation19] Newly primer obtained by designing using Primer National Center for Biotechnology Information-Basic Local Alignment Search Tool (NCBI-BLAST) software at the NCBI website Primer-BLAST was evaluated. Two primer pairs used is the primer D-Loop 112 (forward: 5’-TGC AAA AAA CCA CGC CAA GT-3’; reverse: 5’-TGC ACG ACG ATA TAC GGG T-3’) and primer D-Loop 108 (forward: 5’-CGT ATG CAA AAA ACC ACG CCA-3’; reverse: 5’-CTT ACT ATA GGG AGC TGC ATG-3’). The objective of this study is to evaluate the ability of two designed specific primers from mitochondrial D-loop to amplify DNA from porcine gelatin, specifically the in commercial capsule shells. Furthermore, the specific primer is subjected to validation step by determining specificity, sensitivity, linearity, and repeatibility.
Materials
Porcine and bovine species-specific gelatin was purchased from Sigma-Aldrich (St. Louis, MO). Beef, chicken, and goat were purchased from a local market in Yogyakarta. Rat meat (Rattus rattus) was obtained from a farmer in Yogyakarta, Indonesia. The capsule shells from a porcine–bovine mixture is made a series concentration levels of 0, 10, 20, 30, 40, 50, and 100% (w/w), as described by Widyaninggar et al. (2012). The commercial capsules were purchased from several pharmacies around Yogyakarta, Indonesia.
DNA Isolation from Gelatin and Gelatin Capsules
Isolation of DNA was performed by DNA isolation KitK280-50 according to BioVision Inc.[Citation20] Capsule shells were cut into small by commercial cutter. Approximately 3 g of small capsule shells was transferred into a 15 mL-conicle tube, added with 2 mL of phosphate buffer saline (PBS) and incubated at water bath at 65°C for 1 h. One milliliter of this solution was pippetted into a 2 mL clean tube. The solution was added with 1 mL of 1x cytosol extraction buffer, shaken, and incubated for 10 min. The mixture was centrifuged at 10,000 × g for 10 min, and subjected to further centrification at 15,000 × g for 30 min. The supernatant is discarded and eluate was added with 1 mL of 1x cytosol extraction buffer, and centrifuged again at 15,000 × g (4°C) for 30 min. The supernatant is discarded and eluate was added with 30 µL of mitochondrial lysis buffer, 25 µL of enzyme B mix, and incubated at water bath 50°C for 60 min. The eluate was added with 100 µL of absolute ethanol, stored in a freezer –20°C for 10 min. Afterward, the eluate was centrifuged at 15,000 × g for 5 min. The supernatant is discarded, and eluate was washed twice using 1 mL of 70% cold ethanol. The precipitate was air dried for ±5 min, added with 40 µL of buffer trids-EDTA (TE), and stored at –20°C until it was used for analysis.
PCR Amplification
DNA isolates were analyzed by qPCR with N’,N’-dimethyl-N-[4-[(E)-(3-methyl-1,3-benzothiazol-2-ylidene)methyl]-1-phenylquinolin-1-ium-2-yl]-N-propylpropane-1,3-diamine (SYBR Green I) select master mix fluorescent dye using primers at optimum annealing temperature to detect porcine DNA in the original gelatin material and gelatin capsule shells. Newly primers designed at an optimum annealing temperature were applied to the analysis of commercial capsule shells by qPCR. For each reaction, a total of 20 μL of the above mixture was dispensed (containing 10 µL of SYBR Green master mix, 1 µL of primer forward, and 1 µL of primer reverse, 4 µL of DNA template [50 ng], and water free RNA-ase). The amplification was performed with a qPCR (PCR CFX96 [Biorad, USA]). The thermal cycler followed the program of initial denaturation at 95°C for 15 s, to denature the DNA template completely, while annealing at an optimum temperature and extension were performed at 72°C for 10 s. The melting curve was performed at 65–95°C using slope 0.5°C/2 s. A sample was deemed to be DNA porcine positive, if the sample DNA showed amplification, otherwise, a sample was assumed to be negative, if the sample DNA showed no amplification in the detection system and the internal amplification control (inhibition control) of the sample was positive.
Determination of the Sensitivity and Repeatibility of the Assay
The determination of sensitivity assay was measured in terms of both detection limit of porcine DNA in pure gelatin and in the capsule shells. The replicate of qPCR measurements was made of dilution series of (1000, 200, 100, 10, 5, and 1 pg/µL) porcine gelatin and porcine capsule shell. The limit of detection (LoD) was taken as being the lowest amount that could be amplified with a reproducible Ct value. A similar approach was adopted to determine LoD in porcine gelatin spiked into capsule shell. The repeatibility assay was performed by replication of these dilution series in three replicates.
Analysis of Survey Samples
The commercial samples of capsule shells containing gelation were analyzed three times following the finalized protocol previously set out.
Result and Discussion
The DNA in capsule shells made from the mixture of porcine–bovine gelatin is extracted DNA isolation KitK280-50 according to BioVision Inc.[Citation20] DNA concentration is shown in . DNA obtained during extraction is used for further analysis using primers of D-loop 112 and D-loop 108. Both pairs of potential primer sequences were selected from six candidate primers, which are specific to mitochondrial D-loop porcine DNA region. The selected primers have G or C bases in the last five positions of the 3’ end, amounting to less than 3 G or C, which is expected to increase the specific binding at the 3’ end, but did not formed GC clamp folds. During gelatin processing, the degradation of DNA occurs, then 150–180 bp length amplicon (less than 250 bp) is expected to increase the possibility of getting a positive signal in the analysis of capsule shells.
TABLE 1 The concentration of DNA isolate extracted from capsule shells preparing from the mixture of pork and beef
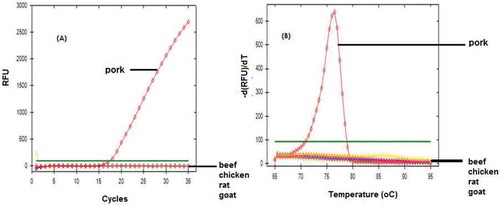
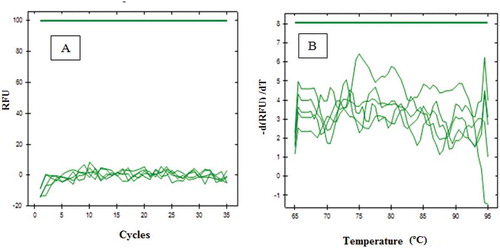
The designed primers were optimized in order to determine the appropriate annealing temperature at various gradient temperature, namely 52.0, 52.7, 54.0, 55.9, 58.4, 60.3, 61.4, and 62.0ºC, respectively. The number of cycles is limited to 35, and baseline threshold was set at 100. Primer D-Loop 112 mitochondrial porcine DNA showed amplification only at a temperature of 52.7ºC; however, it only reached very small response or about 60 relative fluorescence unit (RFU). In addition, the primer D-Loop 112 did not show any amplification response when the temperature was raised to 54.0ºC and unloaded at 52.0°C. It demonstrated that primer D-Loop 112 did not amplify porcine DNA (). Furthermore, the primer mitochondrial D-Loop 108 could amplify porcine DNA at annealing temperature of 52.7, 58., and 60.3ºC. This proves that primer D-Loop 108 was specific to porcine DNA. Finally, based on the optimization, the annealing temperature of primer D-Loop 108 was selected at temperature of 58.4ºC due to the highest RFU value (2154) with a low number of cycles (16.52). The annealing temperature (58.4ºC) was used to specify the test of primer D-Loop 108 on DNA isolated from gelatin and fresh tissue ( and , respectively). The results showed that porcine DNA had been amplified at Cq of 17.46, while bovine, chicken, rat, and goat DNA did not show any amplification at this condition. Using primer mitochondrial D-Loop 108, porcine DNA from gelatin source was amplified at Cq 27.88, while DNA from bovine or fish gelatin sources showed no response up to 35 cycles. The primer D-Loop 108 did not amplify DNA from other DNA, namely pig, beef, chicken, goat, and rat. This indicate that the used primer is specific only to DNA porcine. No cross-reactivity was observed, indicating high specificity of D-Loop 108 primer for their own species.
FIGURE 1 Amplification curve (a) and denaturation peak; (b) using primer D-Loop 112 at various annealing temperatures at 52.0, 52.7, 54.0, 55.9, 58.4, 60.3; 61.4, and 62.0ºC, respectively. Light gray (red): from isolate containing porcine gelatin DNA, dark gray (blue): from isolate containing bovine gelatin DNA.
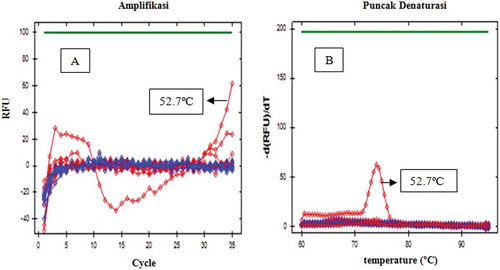
FIGURE 2 Amplification curve (a) and denaturation peak; (b) using primer D-Loop 108 at various annealing temperatures at 52.0, 52.7, 54.0, 55.9, 58.4, 60.3, 61.4, and 62.0ºC, respectively. Light gray (red): from isolate containing porcine gelatin DNA, dark gray (blue): from isolate containing bovine gelatin DNA.
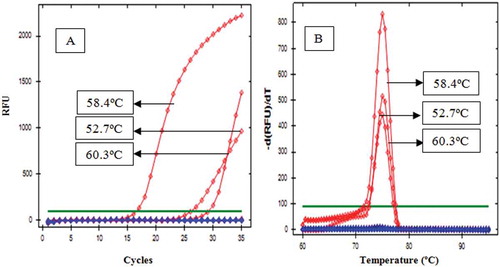
FIGURE 3 Amplification curve (a) and denaturation peak; (b) of DNA from fresh tissue using primer D-Loop 108 at annealing temperature of 58.4.
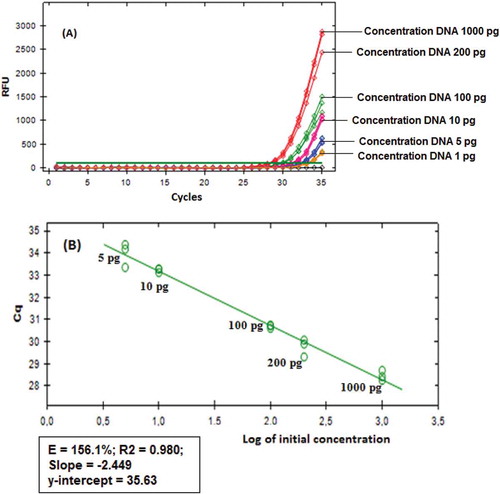
For determination of LoD, the dilution series (1000, 200, 100, 10, 5, and 1 pg/µL) was used. Porcine gelatin DNA could still be amplified up to 5 pg, while at 1 pg, porcine gelatin DNA is not amplified to cycle of 35. The R2 obtained was 0.980, with y-intercept of 35.630 complying good linearity. The amplification efficiency is 156.1% calculated from the slope of –2449 exceeding acceptance criteria in Adams,[Citation21] which is 90–110% (). The standard curves were also obtained from six serial dilutions of the capsule shell containing 100% porcine gelation (each with concentration level of 1000, 200, 100, 10, 5, and 1 pg/µL). Each dilution series can provide good amplification up to 5 pg. Amplification at concentration 1 pg of porcine gelatin DNA does not provide a response up to 35th cycle. Standard curve showed that coefficient of determination (R2) was 0.981, slope of –2.558 and a y-intercept of 35.665, which meet criteria of linearity curve. The value of amplification efficiency is 146.0% calculated from the slope. It shows that each cycle of amplification template is not exponential.
FIGURE 4 Amplification results of porcine gelatin DNA (a) from a dilution series of DNA at several concentrations and its corresponding standard curve (b).
The repeatability test demonstrated that the amplification of all positive response samples containing porcine DNA occur. The dilution of porcine gelatin DNA at concentration of 5 pg would require a longer cycle (Cq = 33.97) to amplify than at concentration of 1000 pg (Cq = 28.41). The coefficient of variation (CV) of 6.94% was obtained, which was lower than that of CV maximum allowed for PCR analysis, i.e., corresponding ≤25%. The repeatability tests were also performed on porcine capsule shells 100%. The capsule shells at concentration dilution of 5 pg could be amplified at Cq of 33.90, whereas at concentration 1000 pg, it required a longer cycle (Cq 28.11). The CV obtained is 7.28%, lower than that required CV, i.e., ≤25%, according to Codex Alimentarius Commission.[Citation22]
D-Loop 108 rimer along with qPCR analysis was then applied to identify the presence of porcine gelatin DNA in commercial capsules with the optimum annealing temperature using qPCR. No amplification occurred in the commercial capsule shells. This demonstrated that five commercial capsule shells evaluated contained no porcine gelatin DNA ().
FIGURE 5 Amplication curve of commercial capsule shell containing DNA using primer D-loop 108. (a) Amplification curve; (b) denaturation peak.
Conclusion
Two primers targeting on mitochondrial D-loop region has been designed specifically, but only primer D-Loop 108 capable of identifying the presence of porcine DNA in fresh tissues (pork, beef, chicken, goat, and rat) and gelatin (porcine, bovine, and catfish) using qPCR at the optimum annealing temperature of 58.4ºC. The lowest concentration of porcine DNA in gelatin and capsule shells is 5 pg. All commercial capsule shells examined did not contain porcine DNA.
FUNDING
This research was financially supported by a grant from the Director General of Higher Education, Ministry of Education and Culture, through the project number of LPPM-UGM/346/LIT/2014.
Additional information
Funding
REFERENCES
- Rohman, A.; Che Man, Y.B. Analysis of Pig Derivatives for Halal Authentication Studies. Food Review International 2011, 28, 97–112.
- Azira, T.; Che Man, Y.B.; Raja Mohd Hafidz, R.N.; Aina, M.A.; Amin, I. Use of Principal Component Analysis for Differentiation of Gelatine Sources Based on Polypeptide Molecular Weights. Food Chemistry 2014, 151, 286–292.
- Karim, A.A.; Bhat, R. Gelatin Alternatives for the Food Industry: Recent Developments, Challenges, and Prospects. Trends in Food Science and Technology 2008, 19, 644–656.
- GMIA (Gelatin Manufacturers Institute of America). Gelatin Handbook; Atlantic Gelatin, Kraft Foods Global Inc.: MA, USA, 2012; 12–25.
- Riaz, M.N.; Chaudry, M.M. Halal Food Production; CRC Press: Boca Raton, FL, USA, 2004; 1–20.
- Hidaka, S.; Liu, S.Y. Effects of Gelatins on Calcium Phosphate Precipitation: A Possible Application for Distinguishing Bovine Bone Gelatin from Porcine Skin Gelatin. Journal of Food Composition and Analysis 2003, 16, 477–483.
- Hashim, D.M.; Man, Y.B.C.; Norakasha, R.; Shuhaimi, M.; Salmah Y.; Syahariza, Z.A. Potential Use of Fourier Transform Infrared Spectroscopy for Differentiation of Bovine and Porcine Gelatins. Food Chemistry 2010, 118, 856–860.
- Nemati, M.; Oveisi, M.R.; Abdollahi H.; Sabzevari, O. Differentiation of Bovine and Porcine Gelatins Using Principal Component Analysis. Journal of Pharmaceutical and Biomedical Analysis 2004, 34, 485–492.
- Zhang, G.F.; Liu, T.; Wang, Q.; Lei, J.D.; Ma, G.H.; Su, Z.G. Identification of Marker Peptides in Digested Gelatins by High Performance Liquid Chromatography/Mass Spectrometry. Chinese Journal of Analytical Chemistry 2008, 36, 1499–1504.
- Zhang, G.F.; Liu, T.; Wang, Q.; Chen, L.; Lei, J.; Luo, J.; Ma, G.; Su, Z. Mass Spectrometric Detection of Marker Peptides in Tryptic Digests of Gelatin: A New Method to Differentiate Between Bovine and Porcine Gelatin. Food Hydrocolloids 2009, 23, 2001–2007.
- Venien, A.; Levieux, D. Differentiation of Gelatins Using Polyclonal Antibodies Raised Against Tyrosylated Bovine and Porcine Gelatins. Journal of Immunoassay Immunochemistry 2005, 26, 215–229.
- Demirhan, Y.; Ulca, P.; Senyuva, H.Z. Detection of Porcine DNA in Gelatine and Gelatine-Containing Processed Food Products-Halal/Kosher Authentication. Meat Science 2012, 90, 686–689.
- Cai, H.; Gu, X.; Scanlan, M.S.; Ramatlapeng, D.H.; Lively, C.R.; Real-Time PCR Assays for Detection and Quantitation of Porcine and Bovine DNA in Gelatin Mixtures and Gelatin Capsules. Journal of Food Composition and Analysis 2012, 25, 83–87.
- Pryor, R.J.; Wittwer, C.T. Real-Time Polymerase Chain Reaction and Melting Curve Analysis. In Clinical Applications of PCR, Methods in Molecular BiologyTM; Lo, Y.M.D.; Chiu, R.W.K.; Chan, K.C.A.; Eds.; Humana Press: New York, NY, USA, 2006; 19–32.
- Shipley, G.L. An Introduction to Realtime PCR; In Real-Time PCR; Dorak, M.T.; Ed.; Taylor & Francis: London, UK, 2006; 9–18.
- Tasara, T.; Schumacher, S.; Stephan, R. Conventional and Real-Time PCR-Based Approaches for Molecular Detection and Quantitation of Bovine Species Material in Edible Gelatin. Journal of Food Protection 2005, 68, 2420–2426.
- Maryam, S.; Sismindari Raharjo, T.J.; Sudjadi Rohman, A. Analysis of Porcine Contamination in Dendeng Using Mitochondrial D-loop 686 and cyt b Gene Primers by Real Time Polymerase Chain Reaction. International Journal of Food Properties 2016, 199, 187–195.
- Che Man, Y.B.; Mustafa, S.; Mokhtar, N.F.K.; Nordin, R.; Sazili, A.Q. Porcine-Specific Polymerase Chain Reaction Assay Based on Mitochondrial D-Loop Gene for Identification of Pork in Raw Meat. International Journal of Food Properties 2012, 15, 134–144.
- Karabasanavar, N.S.; Singh, S.P.; Kumar, D.; Shebannavar, S.N. Detection of Pork Adulteration by Highly-Specific PCR Assay of Mitochondrial D-Loop. Food Chemistry 2014, 145, 530–534.
- BioVision Inc. Mitochondrial DNA Isolation Kit Research Catalog K280-50. BioVision Research Products: CA, USA, 2008.
- Adams, P.S. Data Analysis and Reporting. In Real-Time PCR; Dorak, M.T.; Ed.; Taylor & Francis: London, UK, 2006.
- Codex Alimentarius Commission. CAC/GL 74: Codex Guidelines on Performance Criteria and Validatin of Methods for Detection, Identification, and Quantification of Specific DNA Sequences and Specific Proteins in Foods. Codex Alimentarius Commission: Rome, Italy, 2010; 1–22.