
ABSTRACT
In this study, the potential of visible and near infrared spectroscopy was investigated to classify the maturity stage and to predict the quality attributes of pomegranate variety “Ashraf” such as total soluble solids content, pH, and titratable acidity during four distinct maturity stages between 88 and 143 days after full bloom. Principal component analysis was used to distinguish among different maturities. The prediction models of internal quality attributes of the pomegranate were developed by partial least squares regression. The transmission spectra of pomegranate were obtained in the wavelength range from 400 to 1100 nm. In this research several preprocessing methods were utilized including centering, smoothing (Savitzky–Golay algorithm, median filter), normalization (multiplicative scatter correction and standard normal variate) and differentiation (first derivative and second derivative). It concluded that different preprocessing techniques had effects on the classification performance of the model using the principal component analysis method. In general, standard normal variate and multiplicative scatter correction gave better results than the other pretreatments. The correlation coefficients (r), root mean square error of calibration and ratio performance deviation for the calibration models were calculated: r = 0.93, root mean square error of calibration = 0.22 °Brix and ratio performance deviation = 6.4 °Brix for total soluble solids; r = 0.84, root mean square error of calibration = 0.064 and ratio performance deviation = 4.95 for pH; r = 0.94, root mean square error of calibration = 0.25 and ratio performance deviation = 5.35 for titratable acidity.
Introduction
The pomegranate (Punica granatum L.) fruit is one of the most important fruits of the world, found mostly in tropical and subtropical regions such as Iran, Afghanistan, India, Mediterranean countries (Morocco, Spain, Turkey, Tunisia, and Egypt), and Middle Eastern countries.[Citation1] Due to its multi-functionality and nutritional value in the human diet, it has a very high demand in the world and fetches a good price in the world market.[Citation2] Pomegranate seeds are consumed directly and sometimes juiced for fresh juice consumption. The fruit can also be used in flavoring and coloring agents. Considerable amounts of acids, sugar, vitamins, polysaccharides, polyphenoles and important minerals are found in edible part of this fruit. Pomegranate fruits are most widely grown in Iran. Pomegranates are produced 650,000 tonnes a year and around one-quarter of the productions exported to other countries every year.[Citation3] As the export of fruits is more dependent on quality, the government has devised stringent quality control regulations for the export of the fruit because any compromise in quality may lead to the rejection of the lot and eventually, considerable market loss.
Pomegranate is a non-climacteric fruit and thus, a minimum maturity state is required at harvest.[Citation4] Many researchers determined maturity state and quality of pomegranate fruit on the basis of physiological parameters such as total soluble solids (TSS), pH, dry weight (DW) content, and acidity that involve laborious laboratory techniques which are destructive in nature, time consuming and inapplicable to grading and sorting.[Citation5–Citation9] Therefore, to ensure the minimum acceptability of the quality to consumers, much research has being conducted worldwide to develop non-destructive methods to determine the overall quality of pomegranate fruit. Machine vision (NMR), dielectric spectroscopy, and X-ray computed tomography are some of the most recent non-destructive techniques used for quality evaluation of pomegranate fruit.[Citation9–Citation12]
Near infrared (NIR) spectroscopy is one of the techniques that have received considerable attention from researchers. NIR spectroscopy has been used to evaluate the internal quality parameters non-destructively for different agricultural produce such as apples,[Citation13–Citation15] apricots,[Citation16] avocados,[Citation17] bananas,[Citation18] cherries,[Citation19] citrus fruits,[Citation20] dill,[Citation21] grapes,[Citation22] kiwifruits,[Citation23,Citation24] mandarin,[Citation25,Citation26] mangoes,[Citation27] melons,[Citation28,Citation29] oranges,[Citation30] peaches,[Citation31] peppers,[Citation32] plums,[Citation33] rice,[Citation34] and tomatoes.[Citation35,Citation36] As found in literature, despite an extensive research on NIR spectroscopy of fruit, any published results on the NIR spectroscopy of the pomegranate fruit and its arils are not available.
The NIR spectroscopy is believed to perform as a useful new technique for pomegranates’ internal quality evaluation and assessment of postharvest storability of the same fruit. These operations are of interest to growers, breeders and postharvest technologists particularly when implemented non-destructively. The objectives of the study were (1) to investigate the potential of visible and near infrared (Vis/NIR) spectroscopy for the prediction of quality parameters (pH, titratable acidity [TA], and TSS) of pomegranate fruit in a non-destructive manner, and (2) to study the changes in terms of chemical properties of the pomegranate fruit during four distinct maturity stages between 88 and 143 days after full bloom (DAFB), trying to evaluate the maturity index of the fruit by a non-destructive technique. Knowledge of the maturity indices for harvest would be useful in efforts to postharvest management.
Materials and Methods
Fruit Samples
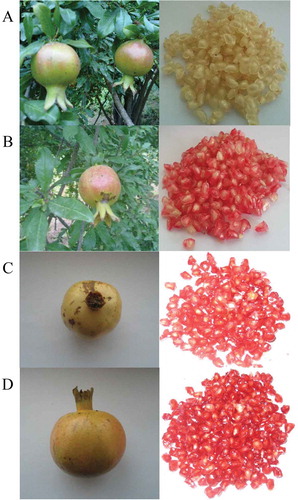
In the present study, a total of 400 pomegranate fruits (Ashraf variety) of the same size and without physical defects from five trees at 88, 109, 124, and 143 DAFB, grown in 2014 in a commercial orchard in Shahidabad Village, Behshahr County, Mazandaran Province, Iran, was randomly collected (A sample of 100 fruits at each stage of DAFB). The fruits were harvested from 5-year-old trees at 5 × 7 m spacing. As the Ashraf variety is an organic variety of pomegranate fruit, any irrigation system and adding of fertilizer were not utilized. Sampling started on August 31, 2014, when it was possible to squeeze juice from the arils, and ended in October 2014 at the fruits’ commercially full ripe stage. The fruits were classified into groups of four different maturity levels, based on the subjective evaluation of the skin texture of the fruit (): (1) Immature stage: hard texture (S1), (2) Fairly half-ripe stage: fairly firm texture (S2), (3) Half-ripe stage: firm texture (S3), and (4) Full ripe stage: soft texture (S4).
Figure 1. Fruit and arils of pomegranate (cv. “ASHRAF”) cultivar at different maturity stages. Immature stage: A: 88 DAFB; B: half-ripe stage: 109 DAFB; C: fairly half-ripe stage 124: DAFB; and D: full-ripe stage: 143 DAFB.
Determination of Chemical Quality Parameters
After that NIR spectroscopy of intact fruit was conducted, the fruits of each maturity stage were juiced with a commercial juice extractor. The juice was filtered and centrifuged afterward. The juice was then used to determine the TSS content, titratable acidity (TA), and pH. The TSS and pH of juice were measured three times using a hand-held refractometer (TYM Model, China) and digital pH meter (3020 Model, GenWay Company), respectively, and the average values were noted. The juice’s soluble solid content was expressed in values of °Brix. TA was determined as an average among replicates after titration using a Metrohm862 compact titrosampler (Herisau, Switzerland), and the results were presented as the percentage of citric acid. Many researchers have been used these methods.[Citation23,Citation24,Citation26,Citation37]
NIR Spectra Acquisition
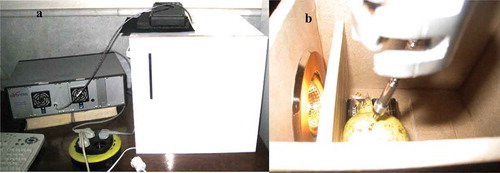
From each fruit, four spectra (400–1100 nm at intervals of 1 nm) in transmittance mode were collected at four equidistant positions along the equator using a dual-channel spectrometer AvaSpec-2048TEC equipped with an AvaSoft7 software for Windows, a cooled, 1 nanometer resolution and sensitivity of 2000 count per 1 mJ entrance irradiation (). The average of these four measurements was used to represent the spectral profile for each sample. The used light source was consisted of a tungsten halogen lamp (100 W, 12 V) which provides spectral wavelength in the visible and infrared region. The light was arranged at a distance of about 50 mm from the fruit surface and at an angle of 90 degrees to fiber optic that guide transmittance light to a detector (). A white Teflon material was used as the reference material before every measurement. Dark current was measured automatically prior to each measurement. The integration time was set 50 ms.
Figure 2. A: Set-up of Vis/NIR equipment; B: fruit presentation for NIR spectroscopy.
Spectral Data Preprocessing
Vis/NIR instruments generate a large amount of spectral data producing valuable analytical information.[Citation35] However, to obtain reliable, accurate, and stable calibration models the raw data acquired from spectrometer need to be preprocessed first to reduce the effect of irrelevant information such as background and noise spectra.[Citation38] Recently, several preprocessing methods have been developed for these purposes.[Citation39] First, four spectra of every sample were averaged into one spectrum. The averaged value is then converted to absorbance value using Abs = log (1/T) equation where T is the amount of transmittance, to obtain linear correlation between spectra and sample molecular concentration. However, as many researchers reported,[Citation39–Citation41] this transformation dose not essentially improve the multivariate linearity. Therefore, in this research several preprocessing methods were utilized including centering, smoothing by (Savitzky–Golay algorithm, median filtering), normalization (multiplicative scatter correction [MSC] and standard normal variate [SNV]) and differentiation (first derivative and second derivative). Centering, which is also referred as mean centering, ensures that all results will be outstanding in terms of variation around the mean.[Citation41] Smoothing is designed to optimize the signal to noise ratio.[Citation40] MSC attempts to remove the effects of scattering by linearizing each spectrum to some “ideal” spectrum of the sample, which, in practice, corresponds to the average spectrum.[Citation41] Also, first and second derivative preprocessing methods were used to remove background spectra and enhance spectral resolution.[Citation38] In this article, all preprocessing methods were carried out by ParLeS software version 3.1.[Citation42]
Calibration and Validation
The 100 pomegranate fruits of studied variety at each stage of DAFB were randomly divided in two categories: the first category including 70 samples was used to develop calibration models and the other was used for predicting quality and validation purposes. The calibration equations were obtained using partial least squares (PLS) regression method. PLS is a multivariate method, which is widely employed in Vis/NIR spectroscopy analysis.[Citation41] Since there is a large amount of spectral information generated by NIR spectroscopy, the reduction of original data dimensions is required to provide a few uncorrelated variables containing only relevant information from the samples. So, before modeling by PLS regression the method of principle component analysis (PCA), a best known and most widely used data reduction method, was employed. PLS analysis can be carried out to create the regression model leading to the content prediction of chemical components. As a result, the PLS method was used to consider simultaneously the variable matrix Y (the values of SSC, pH, or TA) and the variable matrix X (the spectral data) for developing calibration models. The internal validation (in groups of 30 samples) was used to validate the models.[Citation40] Also, PCA models based on the maturity stages of pomegranate fruit were developed. The accuracy of the calibration and validation were assessed by correlation coefficient (r), root mean square error of calibration (RMSEC), root mean square error of prediction (RMSEP), and ratio performance deviation (RPD) as follows:[Citation43]
Results and Discussion
Fruit Quality Parameters
The changes of studied chemical properties of pomegranate fruit during different stages of fruit maturation for both calibration and prediction (validation) data sets are presented in . As shown in this table, the values of TSS content and pH increased during DAFB while the values of TA decreased within the same period. The highest pH value and SSC of pomegranate juice were 3.51 and 18.85 °Brix, respectively. Also the lowest TA value was 0.72%. The trends of how three parameters change during maturation are in line with the fruit physiological development.
Table 1. Statistical details of the samples used in calibration (Cal) and validation (Val) of different Models.
Influence of the Maturation on the Transmittance Spectra
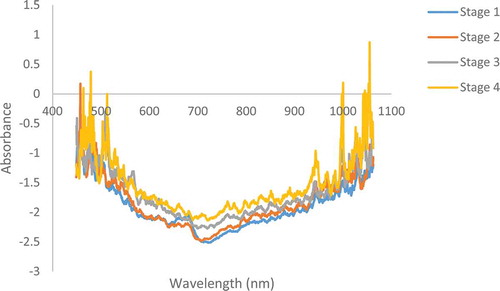
The average raw transmittance spectra of Ashraf pomegranate fruit at four different stages of maturity during DAFB are shown in . As shown, the average spectra of all four maturity stages differed mainly in the 400–1100 nm region, and that the transmittance patterns were different for all four maturity stages. As illustrated in this figure, the collected transmittance spectra had similar shapes, although the intensity was obviously different. There was obvious peak of the curve around 720 nm; one valley of the curve was located around 680 nm.
Figure 3. NIR raw absorbance spectra of pomegranate fruit at different maturity stages. Stage 1: 88 DAFB; Stage 2: 109 DAFB; Stage 3: 124 DAFB; and Stage 4: 143 DAFB.
shows the summary statistics of performance of PCA models on the studied pomegranate fruit maturity using different spectral data preprocessing. Each calibration model was used to classify of maturation data set in order to verify the improved ability of models based on different pre-processing techniques. The model developed from MSC spectra for S4 (143 DAFB) may well classify its group with an accuracy of 93.33%, S3 (124 DAFB) 85%, S2 (109 DAFB) 83.67%, and S1 (88 DAFB) 86.87% correctly. Also, the highest percent classification accuracy (93.25%) was dedicated to the PCA calibration model of S4 developed by SNV preprocessing spectra. This model could classify 93.33 and 91.91% of S4 and S1 correctly and respectively. The best models obtained for S2 and S3were developed using MSC preprocessing spectra. The accuracy of correct classifications was 82.14 and 87.15%, respectively. It can be concluded that different preprocessing techniques had significant effects on the classification performance of the model using PCA method. In general, SNV and MSC were better than the other preprocessing techniques.
Table 2. Performance of different spectral preprocessing techniques on pomegranate maturity classification by principal component analysis (PCA).
Effects of Different Preprocessing
As it was stated previously, various calibration models were developed by using different preprocessing techniques on the spectral data. In order to investigate the enhanced ability of models based on studied preprocessing techniques, each calibration model was used to predict TSS, pH, and TA of prediction dataset. As it was reported by many researchers a proper model should have a higher correlation coefficients; lower both RMSEC and RMSEP values and also a RPD value more than five.[Citation24,Citation39,Citation41,Citation45] The results of the most accurate models of calibration and prediction with several preprocessing methods and their combinations for TSS and pH are presented in and .
Table 3. The results of calibration and prediction of PLS models with preprocessing techniques for TSS.
Table 4. The results of calibration and prediction of PLS models with preprocessing techniques for pH.
As it can be seen from these tables, the minimum correlation coefficient was observed when any preprocessing techniques were not applied for prediction of either TSS or pH. A decrease in RMSEC and RMSEP values and an increase in correlation coefficient and RPD value was observed when preprocessing techniques was applied. Also it was found that combinations of different preprocessing techniques gave better results to select a proper model. So, in each studied smoothing techniques namely median filter, Savitzky–Golay and wavelet, the PLS model with two different normalizing techniques (MSC and SNV) was evaluated and found that SNV gave slightly better results than MSC method. This is in agreement with the results reported by Moghimi et al.[Citation24] for SSC and pH prediction of kiwifruit with PLS model preprocessed using MSC and SNV. Withal between three studied smoothing techniques namely median filter, Savitzky–Golay and wavelet, the median filter introduced better models. Not only the normalizing method sand smoothing techniques but also the different transformation techniques (first derivative and second derivative) influenced the results for either TSS, pH, or firmness. The obtained result using first derivative was better for TSS, firmness but second derivative was better for pH. Cen and He[Citation38] have reported that the peaks and troughs were not very noticeable in the original spectra but became more obvious using first derivative.
Prediction of Internal Quality Attributes
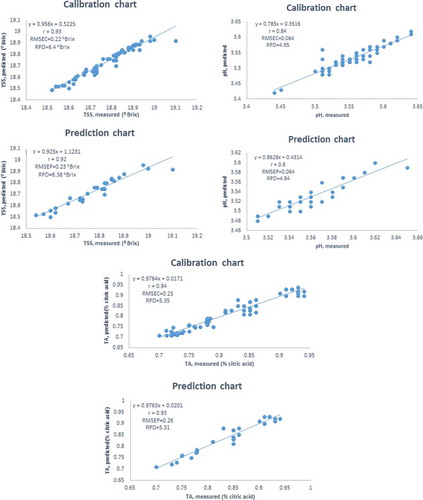
shows the scatter plots of the predicted results and measured TSS, pH, and TA values produced by the PLS model. In this figure, the ordinate and abscissa depict the distribution of the predicted and measured values of the appropriate parameters, respectively. The solid line is the regression line corresponding to the ideal correlation between the measured values and predicted values. The predicting models had excellent performance, confirmed by their high determination coefficients and low RMSEC and RMSEP values and also a high RPD value for each characteristic.
Figure 4. Scatter plot of measured values versus NIRS predicted values for the validation set after application of SNV, median filtering and applying first derivative preprocessing: A: TSS; B: pH; and C: TA.
TSS
Maximum values of r and minimum values of RMSEC and RMSEP values and also a high RPD value (best model) for the prediction of TSS in PLS regression was developed when SNV, median filte,r and first derivative were used as preprocessing (). NIR spectroscopy in conjunction with PLSR could broadly predict the amount of TSS per pomegranate sample. This is the first reported prediction of TSS in the literatures, to the best of our knowledge, with the best model displaying correlation coefficient and a RMSEP. However, Zhang et al.[Citation10] have reported a R2 to be 0.17 and root mean error of cross-validation (RMSECV) to be 0.57 between measured SSC of pomegranate fruit by the reference analytical methods and predicted SSC by NMR from the PLS model.
NIR spectroscopy can also be used in measuring TSS in a wide variety of fruits. Shao et al.[Citation37] obtained r = 0.9 and RMSEP = 0.377 °Brix for estimating TSS from NIR parameters in tomatoes and Lu[Citation19] has reported r = 0.89 and standard error of prediction (SEP) of 0.68 for cherries. Also, Clark et al.[Citation46] achieved r = 0.92 and RMSEP = 0.92% in their NIR-based prediction model used for kiwifruits. Gomez et al.[Citation26] obtained better results (r = 0.94 and RMSEP = 0.35 °Brix) when they used their model for mandarins. However, with our proposed and developed model we achieved higher determination coefficient r (i.e, 0.93 for calibration set and 0.92 for prediction set) and lower error (i.e., RMSEC 0.22 and RMSEP 0.23) when compared with those obtained in other research.
pH
The highest r-value and the lowest RMSEP for the prediction of pH was achieved to be 0.85 and 0.064, respectively, following SNV, median filtering and second derivative based data preprocessing. The results of PLS model of pH showed that application of preprocessing techniques on PLS model of pH had little effect on improving the predictability of the calibration model. Similar to the scatter plot of TSS (), the fitted curve to the pH measured-predicted data points had a slope of almost 45º; this showed predicted values were very close to measured values (). As stated earlier, there have been no published results on the use of NIR spectroscopy for quality assessment of the pomegranate fruit. However, Zhang et al.[Citation10] found R2 0.6 and RMSECV 0.13 between measured pH by the reference analytical methods and predicted pH by NMR from the PLS model. They also reported that the RMSECV was very close to RMSEC, which means the loss in the accuracy was high when the calibration models were applied to the test data. In addition they declared that the low value of the error indicated that the PLS model provided fairly accurate prediction of pH.
TA
Similar to the results of performance from application of different preprocessing techniques on PLS model in prediction of TSS, the best model for the prediction of TA was achieved when SNV, median filter and first derivative were used as pre-processing. The obtained statistical parameters for best model were r = 0.94, RMSEC = 0.25 and RPD = 5.35 for calibration set and r = 0.93, RMSEP = 0.26 and RPD = 5.31 for prediction set. (). The R2 and RMSECV using the PLS model of MR images reported by Zhang et al.[Citation10] for prediction of TA of pomegranate fruit were 0.54 and 0.26, respectively.
Conclusion
This work has demonstrated the potential of Vis/NIR spectroscopy and chemometrics as useful techniques to non-destructively monitoring key pomegranate’s quality attributes such as TSS, pH, and TA during four distinct maturity stages between 88 and 143 DAFB. It has been shown that Vis/NIR spectroscopy with chemometrics is a promising tool for non-destructive prediction of internal quality of pomegranate fruit. Also, pomegranates were classified by running PCA on their Vis/NIR spectroscopy data. It can be concluded that different pre-processing techniques had effects on the classification performance of the model using PCA method. In general, SNV and MSC gave better than first or second derivative pre-processing techniques. Calibration models for different groups of wavelengths in the range of 400–1100 nm for the prediction of TSS, pH, and TA of pomegranate fruit using PLS regression methods with respect to transmittance and centering, median filter, smoothing (Savitzky–Golay algorithm), normalization (MSC), and differentiation (first derivative and second derivative) were developed and tested using internal validation. The prediction of TSS was more accurate with the maximum values of r and minimum values of RMSEP 0.92 and 0.23 °Brix, respectively, and was developed when SNV, median filter, and first derivative were used as preprocessing. Application of SNV, median filter and second order derivative improves the prediction in case of pH using PLS model (r = 0.84, RMSEC = 0.064, and RPD = 4.95 for calibration set and r = 0.85, RMSEP = 0.064, and RPD = 4.94 for prediction set). Similar to results performance of preprocessing on PLS model for prediction of TSS, The best model for the prediction of TA was achieved when SNV, median filter and first derivative were used as preprocessing. This study provided the useful information that could be applied to the pomegranate processing industries and also to the biological research centers.
Acknowledgment
The authors would like to thank Ferdowsi University of Mashhad for providing the laboratory facilities.
Funding
The authors are grateful for the Ferdowsi University of Mashhad for providing the financial support through the project No. of 28580.
Additional information
Funding
Related Research Data
References
- Jbir, R.; Hasnaoui, N.; Mars, M.; Marrakchi, M.; Trifi, M. Characterization of Tunisian Pomegranate (Punicagranatuml.) Cultivars Using Amplified Fragment Length Polymorphism Analysis. Scientia Horticulturae 2008, 115, 231–237.
- Holland, D.; Hatib, K.; Bar-Ya’akov, I. Pomegranate: Botany, Horticulture, Breeding. Horticultural Reviews 2009, 35, 127–191.
- Anon. Agricultural and Natural Sources Section; Bulletin of Iranian Data Center, 2010.
- Kader, A.A. Fruit, Maturity, Ripening and Quality Relationships. Acta Horticulturae 1999, 485, 203–208.
- Salah, A.A.; Dilshad, A. Changes in Physical and Chemical Properties During Pomegranate (Punica Granatum L.) Fruit Maturation. Food Chemistry 2002, 76, 437–441.
- Al-Said, F.A.; Opara, L.U.; Al-Yahyai, R.A. Physico-Chemical and Textural Quality Attributes of Pomegranate Cultivars (Punica Granatum L.) Grown in the Sultanate of Oman. Journal of Food Engineering 2009, 90, 129–134.
- Zarei, M.; Azizi, M.; Bashir-Sadr, Z. Evaluation of Physicochemical Characteristics of Pomegranate (Punica Granatum L.) Fruit During Ripening. Fruits 2011, 66, 121–129.
- Fawole, O.A.; Opara, U.L., Changes in Physical Properties, Chemical, and Elemental Composition and Antioxidant Capacity of Pomegranate (Cv. ‘Ruby’) Fruit at five Maturity Stages. Scientia Horticulturae 2013a, 150, 37–46.
- Fawole, O.A.; Opara, U.L. Fruit Growth Dynamics, Respiration Rate, and Physico-Textural Properties During Pomegranate Development and Ripening. Scientia Horticulturae 2013b, 157, 90–98.
- Blasco, J.; Cubero, S.; Gomez-Sanchis, J.; Mira, P.; Molto, E. Development of a Machine for the Automatic Sorting of Pomegranate (Punica Granatum) Arils Based on Computer Vision. Journal of Food Engineering 2009, 90, 27–34.
- Zhang, L.; McCarthy, M.J. Assessment of Pomegranate Postharvest Quality Using Nuclear Magnetic Resonance. Postharvest Biolology and Technology 2013, 77, 59–66.
- Castro-Giraldez, M.; Fito, P.J.; Ortola, M.D.; Balaguer, N. Study of Pomegranate Ripening by Dielectric Spectroscopy. Postharvest Biolology and Technology 2013, 86, 346–353.
- Magwaza, L.S.; Opara, U.L. Investigating Non-Destructive Quantification and Characterization of Pomegranate Fruit Internal Structure Using X-Ray Computed Tomography. Postharvest Biolology and Technology 2014, 95, 1–6.
- Lu, R.; Guyer, D.; Beaudry, R.M. Determination of Firmness and Sugar Content of Apple Using NIR Diffuse Reflectance. Journal of Texture Studies 2000, 31, 615–630.
- Yan-de, L.; Yi-bin, Y.; Xiaping, F.; Huishan, L. Experiments on Predicting Sugar Content in Apples by FT-NIR Technique. Journal of Food. Engineering 2007, 80, 986–989.
- Fan, G.; Zha, J.; Du, R.; Gao, L. Determination of Soluble Solids and firmness of Apples by Vis/NIR Transmittance. Journal of Food. Engineering 2009, 93, 416–420.
- Carlini, P.; Massantini, R.; Mencarelli, F. Vis-NIR Measurement of Soluble Solids in Cherry and Apricot by PLS Regression and Wavelength Selection. Journal of Agriculture and Food Chemistry 2000, 48, 5236–5242.
- Clark, C.J.; McGlone, V.A.; Requejo, C.; White, A.; Woolf, A.B. Dry Matter Determination in “Hass” Avocado by NIR Spectroscopy. Postharvest Biolology and Technology 2003, 29, 300–307.
- Tarkosova, J.; Copikova, J. Determination of Carbohydrate Content in Bananas During Ripening and Storage by Near Infrared Spectroscopy. Journal of Near Infrared Spectroscopy 2000, 8, 21–26.
- Lu, R. Predicting Firmness and Sugar Content of Sweet Cherries Using Near-Infrared Diffuse Reflectance Spectroscopy. Transaction of the ASAE 2001, 44, 1265–1271.
- Lee, K.; Kim, G.; Kang, S.; Son, J.; Choi, D.; Choi, K. Measurement of Sugar Content in Citrus Using Near Infrared Transmittance. Key Engineering Materials 2004, 270, 1014–1019.
- Schulz, H.; Drews, H.H.; Quilitzsch, R.; Kruger, H. Application of Near Infrared Spectroscopy for the Quantification of Quality Parameters in Selected Vegetables and Essential Oil Plants. Journal of Near Infrared Spectroscopy 1998, 6, A125–A130.
- Herrera, J.; Guesalaga, A.; Agosin, E. Shortwave Near Infrared Spectroscopy for Non-Destructive Determination of Maturity of Wine Grapes. Measurement Science and Technology 2003, 14, 689–697.
- McGlone, V.A.; Jordan, R.B.; Seelye, R.; Martinsen, P.J. Comparing Density and NIR Methods for Measurement of Kiwifruit Dry Matter and Soluble Solids Content. Postharvest Biolology and Technology 2002, 26, 191–198.
- Moghimi, A.; Aghkhani, M.H.; Sazgarnia, A.; Sarmad, M. Vis/NIR Spectroscopy and Chemometrics for the Prediction of Soluble Solids Content and Acidity (pH) of Kiwifruit. Biosystem Engineering 2010, 106, 295–302.
- Walsh, K.B.; Golic, M.; Greensill, C.V. Sorting of Fruit Using Near Infrared Spectroscopy: Application to a Range of Fruit and Vegetables for Soluble Solids and Dry Matter Content. Journal of Near Infrared Spectroscopy 2004, 12, 141–148.
- Gomez, H.A.; He, Y.; Pereira, A.G. Non-Destructive Measurement of Acidity, Soluble Solids and Firmness of Satsuma Mandarin Using Vis/NIR Spectroscopy Techniques. Journal of Food Engineering 2006, 77, 313–319.
- Saranwong, S.; Sornsrivichai, J.; Kawano, S. Performance of a Portable Near Infrared Instrument for Brix Value Determination of Intact Mango Fruit. Journal of Near Infrared Spectroscopy 2003, 11, 175–181.
- Guthrie, J.A.; Liebenberg, C.J.; Walsh, K.B. NIR Model Development and Robustness in Prediction of Melon Fruit Total Soluble Solids. Australian Journal of Agricultural Research 2006, 57, 1–8.
- Jamshidi, B.; Minaei, S.; Mohajerani, E.; Ghassemian, H. Prediction of Soluble Solids in Oranges Using Visible/Near-Infrared Spectroscopy: Effect of Peel. International Journal of Food Properties 2014, 18, 1460–1468.
- Long, R.L.; Walsh, K.B. Limitations to the Measurement of Intact Melon Total Soluble Solids Using Near Infrared Spectroscopy. Australian Journal of Agricultural Research 2006, 57, 403–410.
- Ying, Y.B.; Liu, Y.D.; Wang, J.P.; Fu, X.P.; Li, Y.B. Fourier Transforms Near-Infrared Determination of Total Soluble Solids and Available Acid in Intact Peaches. Transaction of the ASAE 2005, 48, 229–234.
- Schulz, H.; Baranska, M.; Schutze, W.; Losing, G. Characterization of Peppercorn, Pepper Oil, and Pepper Oleoresin by Vibrational Spectroscopy Methods. Journal of Agriculture and Food Chemistry 2005, 53, 3358–3363.
- Lapchareonsuk, R.; Sirisomboon, P. Sensory Quality Evaluation of Rice Using Visible and Shortwave Near-Infrared Spectroscopy. International Journal of Food Properties 2015, 18, 1128–1138.
- Golic, M.; Walsh, K.B. Robustness of Calibration Models Based on Near Infrared Spectroscopy for the in-Line Grading of Stone Fruit for Total Soluble Solids Content. Analytica Chimica Acta 2006, 555, 286–291.
- Pedro, A.M.K.; Ferreira, M.M.C. Nondestructive Determination of Solids and Carotenoids In Tomato Products by Near-Infrared Spectroscopy and Multivariate Calibration. Analytical Chemistry 2005, 77, 2505–2511.
- Shao, Y.; He, Y.; Gomez, A.H.; Pereir, A.G.; Qiu, Z.; Zhag, Y. Visible/Near Infrared Spectrometric Technique for Nondestructive Assessment of Tomato “Heatwave” (Lycopersicum Esculentum) Quality Characteristics. Journal of Food Engineering 2007, 81, 672–678.
- Blanco, M.; Villarroya, I. NIR Spectroscopy: A Rapid Response Analytical Tool. Trend in Analytical Chemistry 2002, 21, 240–250.
- Cen, H.; He, Y. Theory and Application of Near Infrared Reflectance Spectroscopy in Determination of Food Quality. Trends in Food Science & Technology 2007, 18, 72–83.
- Naes, T.; Isaksson, T.; Fearn, T.; Davies, T. A User-Friendly Guide to Multivariate Calibration and Classification; NIR Publications: Charlton, Chichester, UK, 2004.
- Perkin, J.H.; Tenge, B.; Honigs, D.E. Resolution Enhancement Using Anapproximate-Inverse Savitzky–Golay Smooth. Spectrochimica Acta Part B: Atomic Spectroscopy 1988, 43, 575–603.
- Nicolai, B.M.; Beullens, K.; Bobelyn, E.; Peirs, A.; Saeys, W.; Theron, K.I.; Lammertyn, J. Nondestructive Measurement of Fruit and Vegetable Quality by Means of NIR Spectroscopy: A Review. Postharvest Biology and Technology 2007, 46, 99–118.
- Viscarra Rossel, R.A. ParLeS: Software for Chemometric Analysis of Spectroscopic Data. Chemometrics and Intelligent Laboratory Systems 2008, 90, 72–83.
- Clark, C.J.; McGlone, V.A.; De Silva, H.N.; Manning, M.A.; Burdon, J.; Mowat, A.D. Prediction of Storage Disorders of Kiwifruit (Actinidia Chinensis) Based on Visible-NIR Spectral Characteristics at Harvest. Postharvest Biology and Technology 2004, 32, 147–158.
- Liu, F.; Wang, L.; He, Y. Application of Effective Wavelengths for Variety Identification of Instant Milk Teas. Journal of Zhejiang University 2010, 44, 619–623.
- Westad, F.; Bevilacqua, M.; Marini, F. Regression. In Chemometrics in Food Chemistry; Marini, F.; Ed.; Amsterdam, Netherlands: Elsevier, 2013; 127–169.