
Abstract
The culinary banana peel, which is an agricultural waste available in abundance, has not been able to draw much attention in terms of its utilization. In addition to being an abundant source of functional and nutritional compounds, it also deserves to be utilized in a proper and/or better way. The aim of this study was to explore this agro-waste at different levels of maturity in order to identify the active compounds at particular stage of maturity. Phenolics, flavonoids, and radical scavenging activity were maximum at early developmental stage, whereas compounds like protein, fat, carbohydrates, and starch increased with maturity and declined at over-ripe stage. The starch present in the peel is of C-type as confirmed by x-ray diffractograms and crystalline in nature. The peel, at the edible mature stage 4, yielded a high cellulose content which could be used as a reinforcement material in high-performance biocomposites. The presence of various functional groups indicating the complex nature of the culinary banana peel was confirmed by Fourier transform infrared characterization. Scanning electron microscope micrographs revealed that microstructure of peel changes drastically and degradation of starch and other compounds occurred at the over-ripe stage. Hence, in this context, the culinary banana peel can serve as a potential biomaterial in industrial applications and can add a higher value to this locally important and underutilized crop.
INTRODUCTION
Peels are the major by-products of all fruits and vegetables obtained during processing; however, some studies show that these are good sources of polyphenols, carotenoids, and other bioactive compounds, which in turn, possess various beneficial effects on human health.[Citation1] But these wastes are either uneconomically utilized or disposed of, thereby causing serious pollution problems. The peel of bananas constitutes 40% of the total weight of fresh bananas, and yet, it has been underutilized and discarded as waste.[Citation2,Citation3] This may be due to the ignorance regarding the benefits of commercial application.[Citation4] Like its pulp flour counterpart, banana peel flour can potentially be used in new products with standardized composition for various industrial and domestic uses.[Citation5] Banana peel extract contains higher antioxidant compounds and thus, promising a more intense utilization of the peels in food and nutraceuticals. However, potential application of the banana peel depends on its chemical composition as well as its physicochemical and functional properties.[Citation5]
The banana peel being a key source of many functionally important bioactive compounds that are still underutilized, and very little scientific effort has been put to identify its functionality in terms of application to food and nutraceuticals. This biomaterial can potentially offer new products with standardized compositions for various industrial and domestic uses.[Citation6,Citation7] As reported by Emaga et al.,[Citation5,Citation8] banana peel is a rich source of dietary fiber, protein, crude fat, lipid, pectin, essential amino acids, polyunsaturated fatty acids, and micronutrients. Studies have reported that all of the essential amino acid contents are higher than Food and Agricultural Organization standards, except for lysine. During the process of value added products development from culinary banana, the peel is a waste material of various fruits and vegetables processing units located in Northeast India and is possible to obtain banana peel sufficiently.[Citation9] A literature survey revealed that this biomaterial is unexploited in terms of its value and has enormous potential for industrial use. Hence, the use of this biomaterial will not only help in increasing value, but also helps with keeping the environment pollution free.
Keeping in view the importance of the banana peel as a potential source of many functionally important biochemical compounds, it would be interesting to understand the detailed changes in biochemical compositions at various stages of development. As the fruit advances to maturation stage, the composition of both the pulp and peel changes significantly.[Citation5] Therefore, the present study was undertaken to evaluate the changes in biochemical compositions with advancement in fruit maturity. This study will not only help in knowing the compositional changes, but also help in confirming the best stage for obtaining the particular compound of interest at its maximum quantity.
MATERIAL AND METHODS
Sample Collection and Preparation
The fingers of the culinary banana were harvested from Tezpur University campus at five different growth stages, viz. 20, 35, 50, 65, and 80 days after emergence (DAE). The samples were thoroughly cleaned and pulp and peel were separated using a stainless steel knife. Peels were washed with the solution of 0.5% MgSO4 to remove latex from the cut surfaces,[Citation10] followed by rinsing with tap water, and finally dried at 50°C for 24 h. The dried culinary banana peels were ground to obtain the flour, packed in polyethylene bags, and stored at 4°C for further analysis. The flour samples obtained at different stages of maturity were coded as stage 1 (20 DAE), stage 2 (35 DAE), stage 3 (50 DAE), stage 4 (65 DAE), and stage 5 (80 DAE).
Chemical Analysis
Initial moisture content, protein, crude fat, ash, and crude fiber were determined in culinary banana peels at five stages of maturity following the methods described in the Association of Official Analytical Chemists (AOAC).[Citation11] The carbohydrate and starch contents were estimated following the anthrone method.[Citation12] The amylose content was determined with the method of Sadasivam and Manikam[Citation13] and the sugar content was quantified by the phenol-sulphuric acid method.[Citation14] The reducing sugar content was estimated by the Nelson-Somogyi method.[Citation15] The amount of non-reducing sugars was determined by subtracting the amount of reducing sugars from the amount of total sugars in the sample. Cellulose content was estimated following the method of Sadasivam and Manikam[Citation13] while lignin content was determined by Stafford.[Citation16] Determination of the pectin content was done following the method explained by Ranganna.[Citation17] The tannin content was determined by the Folin–Denis method.[Citation18] The total phenolic content was determined with the Folin–Ciocalteu (F.C.) colorimetric method.[Citation19] Total flavonoid content (TFC) of the extracts was determined following the procedure of Sultana et al.[Citation20] The 2,2-diphenyl-1-picrylhydrazyl (DPPH) radical scavenging activity was measured with the method of Brand-Williams et al.[Citation21]
Estimation of Minerals
The concentration of micronutrients present in the culinary banana peel at different stages of maturity was examined with the help of inductively coupled plasma optical emission spectrometry (ICP-OES; Optima 2100 DV, Bridgeport, CT, USA) and following the methods of Naozuka et al.[Citation22]
Fatty Acid Profiling by Gas Liquid Chromatography (GLC)
Fatty acid profiling was done by GLC (CP-3800, Varian, Palo Alto, CA, USA). The non-reactive derivatives of fatty acids methyl esters were prepared by treating the samples with 0.4 N sodium (Na) methylate and shaken vigorously at water bath for 2–3 min at 65°C followed by addition of 1 mL carbon disulphide and again shaken for 1–2 min and filtered through activated charcoal. The filtrate constituted all methyl esters of fatty acids and were separated by chromatography (Varian) equipped with a flame ionization detector (FID) and an electron capture detector (ECD). The column temperature was 190°C and flow of the nitrogen carrier gas was maintained at 35 mL/min. Peaks were identified by comparison of retention times (Rts) to those of standard fatty acid esters.
Estimation of Phenolic Compounds by High-Performance Liquid Chromatography (HPLC)
The determination of major phenolic compounds present in the peel was analyzed using HPLC (Dionex, Ultimate 3000, Germany) equipped with an autosampler ultraviolet (UV) detection at 320 nm (modified Kumar et al.).[Citation23] An acclaimed 120–C18 column (5 µm, 120 Å) with a size of 4.6 × 250 mm at a constant flow rate of 1.5 mL/min using acidified water (pH 2.64) as solvent A and mixture of acidified water and acetonitrile in the ratio of 20:80 as solvent B was used throughout the experiments. The linear gradient elution timing was as follows: 100% A (0 min), 90–80% (10 min), 70–60% (20 min), 50–40% (30 min), and 30–20% (40 min). The stock solution of each standard (100 ppm) was prepared in 50% methanol-milli-Q water. The Rt and diode array detector (DAD) absorbance spectral matching were used for identification purpose. The data were analyzed using the software Chromeleon ver. 6.80.
Amino Acid Analysis by Amino Acid Analyzer
The amino acid compositions of peel was examined by hydrolyzing with 6 N HCl at 110°C for 24 h and measured by ion exchange chromatography using ninhydrin post-column derivatization. Samples equivalent to 5 mg of protein were placed in a 20 mL glass ampoule and 10 mL 6 N HCl was added to avoid the formation of clumps by placing the sample ampoule on dry ice. To remove the oxygen from the ampoule, nitrogen gas was flushed for 1 min followed by it sealing with parafilm and samples were kept in an oven at 110°C for 24 h for hydrolysis. After the acid hydrolysis was over, samples were allowed to equilibrate at room temperature, the neck of the ampoule was broken, and the samples were transferred to 25 mL volumetric flasks. The volume was made up to 25 mL with milli-Q water and thoroughly mixed and filtered through nitrogen free Whatman No. 1 filter paper. The aliquot (0.5 mL) was evaporated at 45–50°C and allowed complete dry, then 5 mL of milli-Q water was added and evaporated again. The cycle of the drying and evaporation process was repeated four times. Finally, the dried samples were dissolved in 2.5 mL of a Na citrate loading buffer (pH 2.2). Using a syringe-driven filter (0.45 μm) samples were kept in an auto sampler and standards (100 p mol) and samples were run in an automated amino acid analyzer (Model 119 CL, Beckman, Palo Alto, CA, USA).
Fourier Transform Infrared (FT-IR) Spectroscopy
Infrared (IR) spectra of samples were measured using KBr disk (ultra-thin pellets) method. The dry sample was ground and blended with KBr in a ratio of sample/KBr 1:4. The blend was pressed to obtain a pellet and introduced in the spectrometer (Nicolet Instruments 410 FT-IR equipped with KBr optics and a deuterated triglycine sulfate detector). Each spectrum was analyzed in the range of resolution from 400–4000 cm−1 with a resolution of 4 cm−1 and total of 64 scans were collected.
Microstructure Study by Scanning Electron Microscope (SEM)
The effect of maturity on the microstructure of culinary banana peels was studied and a small portion of the sample was placed in a metal stub using a two-sided adhesive tape and coated with a fine layer of gold using a sputter gold coater. Sample micrographs were observed at a magnification of 3000× at an accelerating voltage of 15 kV under a scanning electron microscope (JEOL JSM-6390LV, SEM, Oxford, UK).
X-Ray Diffraction (XRD)
The powder XRD patterns were measured using a Rigaku Miniflex instrument at room temperature using CuKα radiation (λ = 0.15418 nm) over the 2θ range of 5 and 50° with a scanning speed of 1.2°/min. The samples were vacuum-dried at 60°C before the assay.
Statistical Analysis
The statistical analysis of all data obtained from different experimental results was performed using data analysis software Origin 8.5. ANOVA and Fisher least significant difference (LSD) were used to calculate the significant difference. Experiments were carried out in three replicates for each analysis.
RESULTS AND DISCUSSION
The culinary banana peel taken for the present study was selected at five different stages of fruit maturation. The first stage at which the samples were collected for the study was at 20 DAE of inflorescence and continued at every 15 days at intervals up to 80 DAE. There was a total of five stages, viz. stage 1 (20 DAE), stage 2 (35 DAE), stage 3 (50 DAE), stage 4 (65 DAE), and stage 5 (80 DAE). As culinary bananas fall under the category of fruits–vegetables, it is not suitable to consume when over-ripened and, therefore, the sample collection was terminated after 80 DAE.
Proximate Composition
The proximate compositions of culinary banana peels at five different stages of maturity are presented in . The culinary banana peel at stage 1 holds more moisture compared to the matured stage peel. The moisture content at stage 1 was 62.98% which increased to 65.43% at stage 2 and from stage 3 onward it decreased from 60.65% (stage 3) to 57.06% at stage 4. There was a significant difference in the moisture content in all stages except for stages 3 and 4 (58.40%). From the results of decreasing moisture content, with respect to maturity, it clearly revealed that the dry matter content of the peel increased with the advancement of maturity. In our previous study of culinary banana pulp, the moisture content increased with the stages of maturity,[Citation24] which is opposite from the present finding. The plausible reason behind this may be that the moisture from the peel is transferring to the pulp and as a result, a decreasing trend in moisture content with maturity has been observed. Furthermore, several authors have also stated that carbohydrates are utilized during breathing and osmotic transfer from the peel to pulp, increasing the water content of the pulp which caused a variation in the osmotic pressure between the peel and the pulp.[Citation25] The finding of Emaga et al.[Citation5] in the case of different varieties of banana peel supports our results. The crude protein content of culinary banana peels ranged from 6.12 to 9.87% in all stages with a significant difference. Similarly, there was an increase in protein content with respect to maturity. But the protein content in the highly matured peel (stage 5) was recorded to be less than stage 4. The metabolism in living cells is regulated by proteins and various metabolic processes persist throughout the fruit developments which necessitate specific proteins in suitable amount at precise time and hence they are ubiquitous components of all living tissues. During fruit ripening, the breakdown and synthesis of protein occurs and amino acids are recycled, and during the beginning of ripening the actual concentration of protein increases.[Citation26] An increase in the crude protein content with increasing maturity has also been reported by Emaga et al.[Citation5] and Adisa and Okey[Citation27] in the case of banana peels. A slight decrease in the protein content at stage 5 may be attributed to the utilization of proteins in the gluconeogenesis.[Citation28]
TABLE 1 Proximate composition (% dry weight basis) of culinary banana peel at various stages of development
The crude fat content in the peel of the culinary banana recorded an increasing trend from stage 1 (1.96%) to stage 5 (3.94%) and it varied significantly. As the percentage of dry matter increased, with respect to maturity, the crude fat content also seems to follow the increasing trend.[Citation29] This may be due to the continuous synthesis of fatty acids during metabolism, and the lipid content also varies drastically. The increasing trend in the crude fat concentration with fruit development has been reported by various authors in the cases of different fruits, which supports the current findings.[Citation30] The amount of the ash content in the peel of culinary bananas varied with growth and maturity which increased from stage 1 (6.24%) to stage 4 (9.15%), and decreased slightly at stage 5 (8.42%). The changes in the ash content did not vary much among the stages of ripening. There was a significant difference among stage 1, 2, and 4, but among stage 2, 3, and 5, the ash content did not vary. Ash content, which is generally an inorganic material, is directly or indirectly associated with the absorption capacity of mineral salts at different developmental stages. The ash content in present study is comparatively less than the values reported (12.8%) by Emaga et al.,[Citation5] this may correlate to the absorption of mineral salt by the plant and soil condition of North East India. The crude fiber content of the culinary banana peel increased as maturity proceeds and varied from 15.97% at stage 1 to 25.65% stage 4, which again, dropped slightly to 21.23% at stage 5. The values of crude fiber found in the present study is on the higher side which suggests that the culinary banana peel can be a good source of fiber and can help in alleviating digestion problems, for example, constipation, and improve general health and well-being.[Citation31] Apart from this, the culinary banana peel can also be a potential source for making poultry and cattle feed due to it being an excellent source of fiber.[Citation32] The increase in fiber content at the matured stage over the tender stage might be due to an increase in soluble and insoluble dietary fractions.[Citation24] Hence, the culinary banana peel may also be added to the diet which is resistant to enzymatic digestion.[Citation33] The banana peel is an excellent source of carbohydrates, with its content varying from 23.30–37.07% (stage 1–5). The highest amount was recorded at stage 3, which, thereafter, decreased with maturity. This variation might be due to the degradation of starch at different developmental stages.[Citation34] The carbohydrate content in the present study is comparatively less as compared 59% carbohydrates present in the Musa sapientunm peel,[Citation31] and this variation may be attributed to the variety used in the present study.
The fully matured stage significantly affected the starch and amylose content in culinary banana peels (). The starch content varied from 4.84–15.88% and amylose content ranged from 0.89–3.97% in all stages. Both starch and amylose recorded in the highest amount at stage 3 and decreased at stage 5 with minimum amount of 4.84% starch and 0.89% amylose. The decreasing trend of starch with advancement in maturity has also been reported by Emaga et al.[Citation5] in the case of banana peels. The reducing trend in starch content with maturity may correlate to the accumulation of carbohydrates during maturation which causes the hydrolysis of starch and sugar storage during maturation. Various enzymes involved in the starch degradation during ripening are amylase, glycosidase, phosphorylase, invertase, and sucrose synthase, etc., which further help in the accumulation and formation of soluble sugars.[Citation35] As reported by James et al.,[Citation36] amylose consists of 20–30% of native starch present in the fruit which supports our current findings.
TABLE 2 Starch, amylose and sugar content (% dry weight basis) of culinary banana peel at various stages of development
During maturation, the sugar contents of the culinary banana gradually increased. Total soluble sugars (TSS; 1.76–4.09%), reducing sugar (0.66–2.09%), and non-reducing sugar (1.32–3.63%) increased from stage 1 to stage 5. The increase in the sugar content evinced the degradation of starch to sugar with maturity.[Citation24] TSS and reducing sugars did not show a significant difference between stages 1 and 2, but thereafter it varied, whereas non-reducing sugars varied with respect to maturity. According to the reports of Emaga et al.,[Citation5] the major TSS found in the peel of bananas are mainly glucose and fructose with a slight amount of sucrose. In the present study, the amount of non-reducing sugar studied was higher than the reducing sugars. Therefore, the culinary banana peel may be a better source of fructose than glucose, as fructose is a non-reducing sugar. The increasing trend of all sugars with advancement in maturity is in line with the report of Adisa and Okey.[Citation27]
The culinary banana peel is a rich source of cellulose () which varied significantly, but toward the end of maturity the cellulose remains almost constant with no significant difference among the stages. The lowest amount of cellulose was recorded at stage 1 (6.54%) and the highest was at stage 4 (16.85%). Cellulose, a homopolymer of glucose, is an abundant source of polymers and it was confirmed that the culinary banana peel can potentially be used in bio-polymers.[Citation9] Our results are in line with the values of cellulose content in plantain peels at different ripening stages reported by Emaga et al.[Citation37] Lignin is the next most abundant polymer after cellulose and is an important constituent of the plant which provides mechanical support to the cell wall. The results reported in revealed that lignin varied significantly from 2.87–4.97% among the stages. With increase in maturity of the banana, the lignin content also gradually increased. This increasing trend of lignin may correlate to the lignifications of cell wall constituents which result in an increase in other dietary fiber fractions.[Citation38] The culinary banana peel contains hemicelluloses in the ranges of 2.98–5.90% from stage 1 to stage 5 (). Hemicelluloses are heteropolymers of polysaccharides and play an important biological role in the strengthening the cell wall by interacting with cellulose and lignin.[Citation39] It was observed after stage 3 that the hemicelluloses started decreasing and there was no significant difference between stages 4 and 5. This fluctuation may be because of the cell biosynthesis, with respect to ripening, and during the early stages of fruit development the cell expansion and elongation occurs. The growth of any fruits and vegetables begin with the cell wall loosening and consist of a cellulose scaffold embedded in a matrix of polysaccharides, which are classified as pectins and hemicelluloses. The growing cell wall is dynamically modified by enzymes that change the structure of pectins and hemicelluloses, thereby altering their interactions with each other and with cellulose. Growth cessation is correlated with reduced expression of genes that promote wall loosening and changes in the matrix polysaccharides that lead to a less extensible cell wall.[Citation40] Pectin, the heteropolysaccharide found in the primary cell wall, is a soluble dietary fiber and is widely used in the food, pharmaceutical, and cosmetic industries.[Citation41] The amount of pectin content in the culinary banana peel did not vary much and their amount was limited in the range of 1.23–3.52% in all stages (). The gradual increase in pectin content up to stage 4 might be due to less of an interaction between the pectin and the other cellular components, and as a consequence, the pectin was more available for extraction. On the other hand, the decrease at stage 5 may be due to the degradation of pectin under the action of pectic enzymes, such as polygalacturonase (PG), pectin methyl esterase (PME), or pectate lyase (PL). The increase of the pectin content up to a certain stage and then a decrease was also observed by Lohani et al.[Citation42]An astringent and bitter plant polyphenolic compound that binds and precipitates proteins and other organic compounds, including amino acids and alkaloids, are known as tannins. The result () shows that the culinary banana peel has its maximum tannin amount during early developmental stage and it varied from 6.76% (maximum at stage 2) to 4.46% (minimum at fully matured stage 5). The decrease in the tannin content with the advancement of growth reduces the astringency property. The astringency property gets reduced as the culinary banana attains maturity, and this property is related to insolubilization and polymerization of polyphenols with other constituents of pulp.[Citation24] The tannins content of the peel, which act against the availability of proteins in the rumen, decreases with ripening as a consequence of a migration of the polyphenols from the peel toward the pulp and the phenolic oxidative degradation by polyphenol oxidases and peroxidases.[Citation43]
TABLE 3 Cellulose, lignin, hemicelluloses, pectin, and tannin content (% dry weight basis) of culinary banana peel at various stages of development
The culinary banana peel is an excellent source of polyphenols, and is generally involved in defense against radiation or aggression by pathogens.[Citation44] The polyphenols content in the peel was higher when the fruit was young and decreased with maturity (). It varied significantly in the ranges of 590.18–1567.84 mg gallic acid equivalent (GAE)/100 g dry matter from stage 1 to stage 5. Polyphenols may contribute to the bitterness, astringency, color, flavor, odor, and oxidative stability,[Citation45] and are an important group of antioxidants, having the ability to absorb free radicals.[Citation46] The plausible explanation behind this variation has been explained by Kiyoshi and Wahachiro,[Citation47] they state that during the early ripening stage, 60% of the polyphenolic compounds have a molecular weight above 2 × 10⁵. With advancement in ripening, this 60% of polyphenols with a higher molecular weight above 2 × 10⁵ disappears slowly, resulting in a decrease in astringent property. On further ripening, only those 40% of polyphenols with a molecular weight below 2 × 10⁵ remain, and the polyphenols content decreased which are in line with our results. The decreasing trend of polyphenols in the banana peel with growth is also reported by Sundaram et al.[Citation48] Flavonoids, the most potent antioxidative compounds of the plant phenolics, potentially occurred during the early stages of the culinary banana peel development (). The maximum amount was recorded at stage 1 (1137.26 mg catechin/100 g dry matter) and gradually decreased with a minimum value at stage 5 (835.10 mg catechin/100 g dry matter). Many flavonoids are found to have strong antioxidants and being capable of effectively scavenging the reactive oxygen species (AOS) because of their phenolic hydroxyl groups.[Citation49] As maturity progressed, the biosynthesis of flavonoids occurs which is regulated by coordinated transcriptional control of the enzymes resulting in the decreasing level of flavonoids with respect to maturity.[Citation50]
TABLE 4 Total polyphenols, flavonoids of culinary banana peel at various stages of development
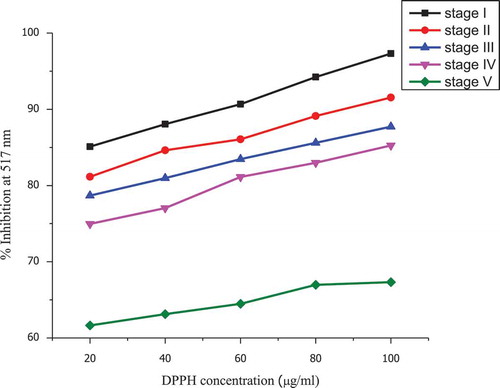
Maturity significantly affected the radical scavenging activity of the culinary banana peel (). The scavenging activity of the peel studied against different concentrations of DPPH revealed that with an increase in the concentration to DPPH from 20–100 μg/mL, the percentage inhibition also increased. The highest percentage inhibition (up to 97.31%) was found at the early developmental (stage 1) and the minimum percentage was noticed at stage 5 (up to 79.32%). Generally, when fruits attain maturity, the scavenging activity of fruits is found to decrease which may be because fruit ripening is an oxidative phenomena.[Citation51] As reported by Jimenez et al.,[Citation52] during ripening, the formation of oxygen and an accumulation of hydrogen peroxide are increased which increases the lipid peroxidation and protein oxidation. When a fruit attains the ripened stage, the AOS promotes the oxidation which causes the general deterioration of cellular metabolism.[Citation53]
FIGURE 1 DPPH radical scavenging activity of culinary banana peel at various developmental stages.
Mineral Content
The mineral content of the peel, see , revealed that the culinary banana peel is a potential source of micronutrients. Among all the micronutrients, potassium (K) was the most abundant and ranged from 35,025.81–47,869.09 mg/kg with a significant variation among the stages. The lowest amount was recorded at stage 5, and highest being at stage 3. Studies reported by Emaga et al.[Citation5] and John and Marchal[Citation54] revealed that K content in banana peel was highest among other micronutirents. Following K, the second highest amount of micronutrients found was phosphorus (P) and varied significantly in the ranges of 2831.58–4321.88 mg/kg. The highest amount was recorded at stage 2, and then decreased with maturity. Magnesium (Mg) was also recorded in a high amount and ranged from 1381.23–2140.38 mg/kg, with a significant variation among the stages. The highest amount of Mg was recorded at stage 3, and slowly decreased with the advancement in fruit growth. The insertion of Mg into the porphyrin structure is the first step of chlorophyll biosynthesis,[Citation55] as Mg is the central atom of the chlorophyll molecule. The Na content varied significantly from 365.23–653.85 mg/kg in all stages of development. The iron (Fe) content was recorded in between 18.69–30.32 mg/kg and the highest amount was at stage 4. Similarly, zinc (Zn) was within the ranges of 16.47–22.93 mg/kg and the highest value was found at stage 4. The trace elements like manganese (Mn) and copper (Cu) was found in the least amounts among all of the other minerals. The maximum amount of Mn (15.96 mg/kg) and Cu (1.14 mg/kg) was found at stage 4. In general, K, Mg, Ca, P, Fe, and Zn concentrations increased with the advancement of fruit development and then decreased at stage 5. The drop in the Mg and Ca content of cell walls at the fully matured stage, that may be because of the binding of Ca in the tissue (softening of tissue) just before ripening.[Citation55] The large variation in all of the micronutrients observed during fruit development may be attributed to preferential absorbance, and this may be due to the cultivar and/or soil, climate, agricultural practice, and the quality of water for irrigation.[Citation56] Most of the minerals are very crucial in many of the enzymes activities, protecting the cells from attacks by free radicals, the regulation of glucose homeostasis, etc.[Citation31] The results revealed that the culinary banana peel contains a higher amount of mineral salts comparing to the fruit[Citation24] and hence, the culinary banana peel could be a good feed material for cattle and poultry.[Citation57]
TABLE 5 Minerals in culinary banana peel (mg/kg) at various stages of development
Fatty Acid Composition
The results of fatty acid compositions of the culinary banana peel () varied significantly with its development. Both saturated (lauric, myristic, palmitic, stearic) and unsaturated (oleic, linoleic, linolenic) fatty acids were predominant during the early developmental stages. Lauric acid (3839.64–8134.32 mg/kg) and myristic acid (1034.63–2463.97 mg/kg) were the most abundant during the early developmental stage. While palmitic (27,349.21–35,630.63 mg/kg) and stearic (26,334.97–37,763.74 mg/kg) acids first increased with maturity and then gradually decreased with advancement in growth. Oleic (47,890.19–78,687.25 mg/kg), linoleic (20,076.48–30,904.58 mg/kg), and linolenic (19,634.05–27,385.26 mg/kg) acids were recorded at their maximum during stage 2 of the fruit development, and gradually decreased with maturity. The unsaturated fatty acids present in plants possess a great nutritional importance to animals. Linoleic acid has nutritional benefits due to its metabolism at tissue levels which produce hormone-like compound prostaglandins.[Citation58] The role of α-linolenic acid has been reported in disease prevention.[Citation59] It is well known that fatty acid profiles determine the quality of oil in terms of nutritional value, and the results of the present study revealed that banana peels are rich in polyunsaturated essential fatty acids, therefore, having high a nutritional importance.
TABLE 6 Fatty acids in culinary banana peel (mg/kg) at various stages of development
Polyphenols Analysis by HPLC
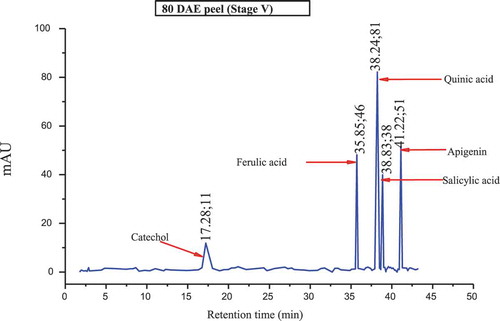
The major polyphenols found in the culinary banana peel at various developmental stages are illustrated in –. Toward the early developmental stage, most of the polyphenols were found in an abundant amount and with the advancement in growth the amount of polyphenols gradually decreased, and at stage 5 most of the polyphenols studied were not present. The analysis of phenolic compounds revealed that hydroquinone, catechol, ferulic acid, quinic acid, salicylic acid, quercetin, and apigenin were present throughout the fruit growth, while polyphenols like resorcinol, chlorogenic acid, p-coumaric acid, and naringin were found in trace amounts during the early stage and slowly disappeared with fruit growth. Results revealed that the culinary banana peel has a high antioxidant capacity attributed to a large amount of polyphenolic compounds. Polyphenols are considered significant sources of health-promoting bioactives in the human diet.[Citation60] The composition of polyphenols, which varied with fruit maturity, is contributed to properties such as the astringency and color of fruit. The decreasing trend of polyphenols with increase in fruit development has also been reported on different fruits like eggplant, blueberry, maqui, etc.[Citation60]
FIGURE 2a HPLC chromatograms of polyphenols in 20 DAE (stage I) matured culinary banana peel.
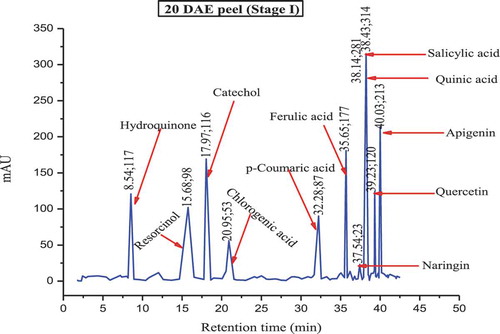
FIGURE 2b HPLC chromatograms of polyphenols in 35 DAE (stage II) matured culinary banana peel.
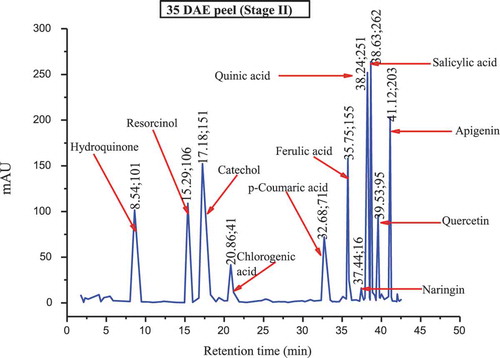
FIGURE 2c HPLC chromatograms of polyphenols in 50 DAE (stage III) matured culinary banana peel.
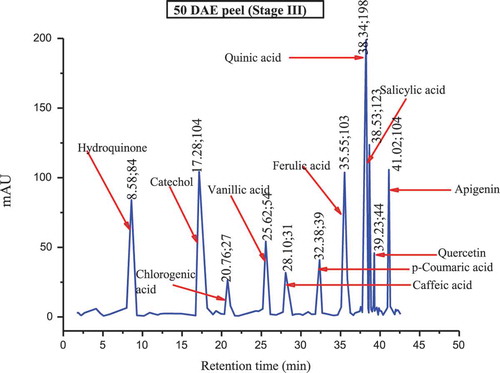
FIGURE 2d HPLC chromatograms of polyphenols in 65 DAE (stage IV) matured culinary banana peel.
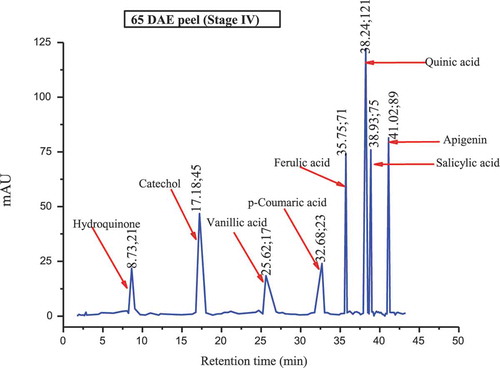
FIGURE 2e HPLC chromatograms of polyphenols in 80 DAE (stage V) matured culinary banana peel.
Amino Acid Analysis
Amino acid compositions of the culinary banana peel at various stages of fruit development is presented in . The culinary banana peel may be considered as a good source of amino acids, as most of the 18 amino acids studied are present at the various developmental stages, the maximum quantity was observed at stage 4 and decreased at stage 5. Tryptophan (0.46–1.32 g/100 g protein), valine (0.03–0.28 g/100 g protein), leucine (0.01–0.27 g/100 g protein), phenylalanine (0.02–0.13 g/100 g protein), histidine (0.71–1.99 g/100 g protein), and argenine (0.06–0.25 g/100 g protein) were major essential amino acids that were present throughout growth, while methionine (0.08–0.16 g/100 g protein), isoleucine (0.12–0.17 g/100 g protein), tyrosine (0.02–0.06 g/100 g protein), and lysine (0.17–0.26 g/100 g protein) were recorded in trace amounts. Some other non-essential amino acids that were found were aspartic acid (0.32–0.64 g/100 g protein), threonine (0.68–1.05 g/100 g protein), glutamic acid (0.32–0.63 g/100 g protein), proline (0.54–1.06 g/100 g protein), glycine (0.21–0.68 g/100 g protein), alanine (0.07–0.24 g/100 g protein), and cysteine (0.01–0.08 g/100 g protein) varied with growth and fruit development. The amount of amino acids recorded in the culinary banana peel is significantly higher than those found in the fruit pulp as reported in our previous work.[Citation24]
TABLE 7 Amino acids content in culinary banana peel (g/100 g protein) at various stages of development
FT-IR Spectroscopy
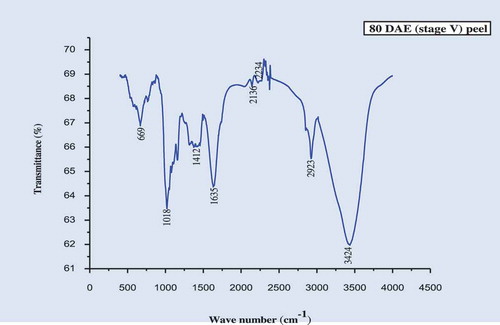
The IR spectra of the culinary banana peel were obtained in order to understand the variation in the nature of functional groups at different developmental stages. The spectra illustrated in – can be used to explain the functional groups. The IR-spectra of the peel at all five stages of development was more or less similar. The characteristic band observed, at 3424 cm−1 at stages 1, 2, 3, and 5 and at 3433 cm−1 at stage 4, may be attributed to carboxylic and hydroxyl functional groups and the absorption was caused by the stretching of free or H-bonded OH-groups.[Citation61] The sharp peak at 2923 cm−1 is due to –CH stretch for –CH2 and –CH3 bond stretching vibration on OH. Depending upon the various functional groups, this –CH stretching may vary. Therefore, this peak may or may not be altered during ripening. The prominent bands observed at 1644 cm−1 (stage I), 1635 cm−1 (stages 2, 3, and 5), and 1626 cm−1 (stage 4) represent the bending mode of the absorbed water[Citation62] which might be related to COO- stretching vibration in a carbohydrate group.[Citation63] Peaks observed at 1412–1447 cm−1 was attributable to the bending modes of -CH3.[Citation64] There was a sharp peak at around 1018 cm−1 in all five stages studied which may be attributed to C-O-C pyranose ring skeletal vibration stretching indicates presence of xylans associated with hemicelluloses. Further the intense band at this wavenumber proves higher cellulose content in peel throughout growth. At 589 cm−1 (stages 1 and 3), 580 cm−1 (stage 2), 598 cm−1 (stage 4), and 699 cm−1 (stage 5) are due to the entire anhydroglucose ring stretching vibrations.[Citation65]
FIGURE 3a FT-IR spectra of culinary banana peel at 20 DAE (stage I).
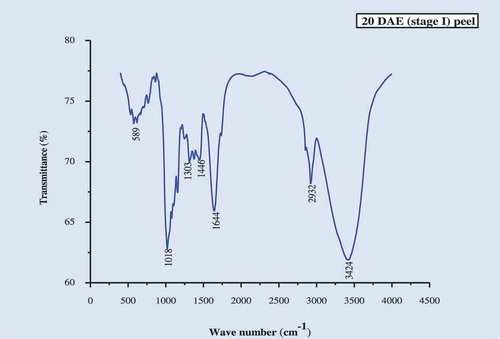
FIGURE 3b FT-IR spectra of culinary banana peel at 35 DAE (stage II).
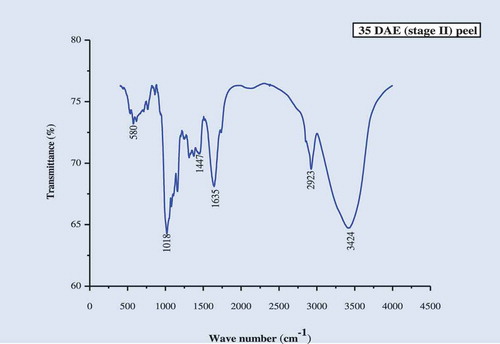
FIGURE 3c FT-IR spectra of culinary banana peel at 50 DAE (stage III).
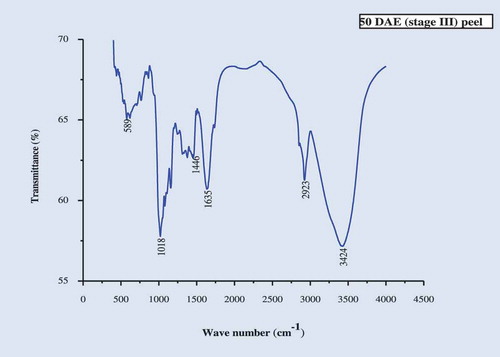
FIGURE 3d FT-IR spectra of culinary banana peel at 65 DAE (stage IV).
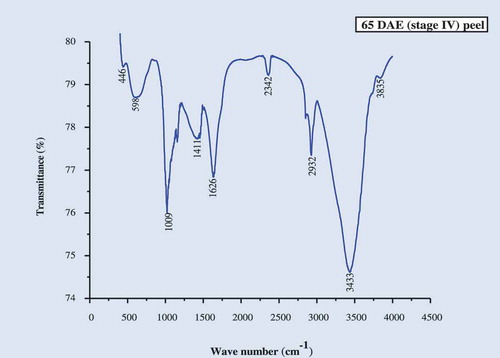
FIGURE 3e FT-IR spectra of culinary banana peel at 80 DAE (stage V).
Scanning Electron Microscope
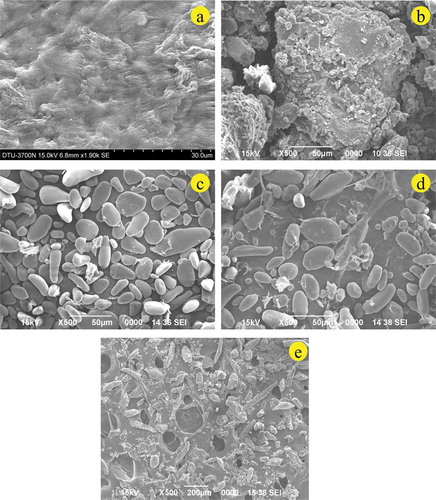
The changes in microstructure of the culinary banana peel with respect to growth and development was studied using SEM and illustrated in –. With the advancement of the maturity stage the microstructure of the peel drastically changed with irregular shapes and larger intercellular areas. The micrograph of the early development stage () looked hazy with no particular prominent structure, and with the progress of maturity (stage 2) some microstructures () were observed. The difference in microstructures is related to the variation in chemical compositions. SEM images at stages 3 and 4 clearly revealed the microstructure of starch and carbohydrates ( and ). With a further advancement of maturity at stage 5, the starch got degraded and converted into sugars ().
FIGURE 4 SEM micrographs of culinary banana peel A: 20 DAE (stage I); B: 35 DAE (stage II); C: 50 DAE (stage III); D: 65 DAE (stage IV); and E: 80 DAE (stage V).
XRD Pattern
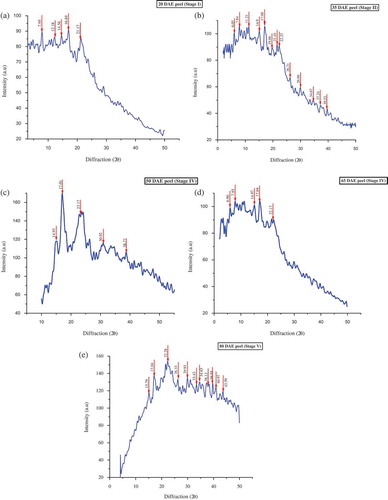
The culinary banana peel at was analyzed various stages of development for its crystalline nature as illustrated in –. All of the five diffractograms that were studied varied in their pattern, with respect to growth and development, but they all showed crystalline morphology at each stage. The diffractogram of the stage 1 peel showed five major peaks at 2θ values of 7.95, 12.18, 14.56, and sharp peaks at 16.84 and 21.17, indicating a crystalline region. The XRD pattern of the peel at stages 3 and 4 showed the presence of starch and the diffractograms observed were similar to those of starch. The reflection intensity at 6.90, 7.85, 14.93, 17.01, 23.17, and 30.92 may be attributed to the presence of a C-type of starch in the culinary banana peel. The values of 2θ at 17.01 show the characteristic peak of B-type starch and peak appeared at 23.17 is accredited to the characteristics of A-type starch. Thus, the starch present in the culinary banana peel can be classified as C-type which is a mixture of A and B types.
FIGURE 5 XRD diffraction pattern of culinary banana peel A: 20 DAE (stage I); B: 35 DAE (stage II); C: 50 DAE (stage III); D: 65 DAE (stage IV); and E: 80 DAE (stage V).
CONCLUSION
The present study was focused on evaluating the effect of fruit maturation on biochemical and functional compounds in the peel at various stages. The results revealed the culinary banana peel is a potential source of many functionally important nutritional and bioactive compounds. The starch present in the peel is of C-type, as confirmed by XRD. Phenols, flavonoids, and scavenging activity were at their maximum toward the early developmental stage. K was the most abundant mineral present in all stages, followed by phosphorous and Mg. Fatty acids, viz. linoleic and linolenic, were more dominant in the peel compared to the pulp. The peel was found to have 18 amino acids, both essential and non-essential, where tryptophan, valine, leucine, and histidine were dominant. FT-IR analysis confirmed the presence of various functional groups and indicated the complex nature of the culinary banana peel. SEM clearly evinced that the microstructure of the peel changes drastically, and the degradation of starch and other compounds occurred at the fully matured stage. The crystalline nature of the peel at all stages was also confirmed by XRD. Hence, the present study favorably justifies that the culinary banana peel has enormous potential for commercial application as a source of nutritional and functional compounds which can add a higher value to this locally important crop.
FUNDING
The financial support was received from Ministry of Defense and the Government of India, and is duly acknowledged.
Additional information
Funding
Related Research Data
REFERENCES
- Zhang, P.; Whistler, R.L.; BeMiller, J.N.; Hanaker, B.R. Banana Starch: Production, Physicochemical Properties, and Digestibility—A Review. Carbohydrate Polymers 2005, 59(4), 443–458.
- Wanlapa, S.; Wachirasiri, K.; Sithisam-ang, D.; Suwannatup, T. Potential of Selected Tropical Fruit Peels As Dietary Fiber in Functional Foods. International Journal of Food Properties 2015, 18(6), 1306–1316.
- Khawas, P.; Das, A.J.; Dash, K.K.; Deka, S.C. Thin-Layer Drying Characteristics of Kachkal Banana Peel (Musa ABB) of Assam, India. International Food Research Journal 2014, 21(3), 1011–1018.
- Khawas, P.; Dash, K.K.; Das, A.J.; Deka, S.C. Drying Characteristics and Assessment of Physicochemical and Microstructural Properties of Dried Culinary Banana Slices. International Journal of Food Engineering 2015, 11(5), 667–678.
- Emaga, T.H.; Andrianaivo, R.H.; Watheletet, B.; Tahnago, J.T.; Paquot, M. Effects of the Stage of Maturation and Varieties on the Chemical Composition of Banana and Plantain Peels. Food Chemistry 2007, 103(2), 590–600.
- Essien, J.P.; Akpan, E.J.; Essien, E.P. Studies on Mould Growth and Biomass Production Using Waste Banana Peel. Bioresource Technology 2005, 96(13), 1451–1455.
- Ashraf, A.M.; Maah, J.M.; Yusoff, I. Batchwise Biosorption of Sn2+ Ions by Using Chemically Treated Banana Peel. Research Journal of Biotechnology 2012, 7(3), 81–87.
- Emaga, T.H.; Robert, C.; Ronkart, S.N.; Wathelet, B.; Paquot, M. Dietary Fiber Components and Pectin Chemical Features of Peels During Ripening in Banana and Plantain Varieties. Bioresource Technology 2008, 99(10), 4346–43454.
- Khawas, P.; Deka, S.C. Isolation and Characterization of Cellulose Nanofibers from Culinary Banana Peel Using High-Intensity Ultrasonication Combined with Chemical Treatment. Carbohydrate Polymers 2016, 137, 608–616.
- Nguyen, T.B.T.; Ketsa, S.; Van Doorn, W.G. Relationship Between Browning and the Activities of Polyphenol Oxidase and Phenylalanine Ammonia Lyase in Banana Peel During Low Temperature Storage. Postharvest Biology and Technology 2003, 30(2), 187–193.
- A.O.A.C. Association of Official Analytical Chemists Official Methods of Analysis of the Association of Official Analytical Chemists, 18th Ed; AOAC International: Washington, DC, 2010.
- Hodge, J.E.; Hofreiter, B.T. Carbohydrates. In Methods in Carbohydrate Chemistry; Whistler R.L.; Miller, J.N.B.; Ed.; Academic Press: New York, NY, 1962; 17–22.
- Sadasivam, S.; Manickam, A. Biochemical Methods, 3rd Ed; New Age International Publishers: New Delhi, India, 2008.
- Dubois, M.; Gilles, K.A.; Hamilton, J.K.; Rebers, P.A.; Smith, F. Colorimetric Method for Determinations of Sugar and Related Substances. Analytical Chemistry 1956, 28(3), 350–356.
- Somogyi, M. Notes on Sugar Determination. Journal of Biological Chemistry 1952, 195, 19–23.
- Stafford, H.A. Differences Between Lignin Like Polymer Formed by Peroxidation of Eugenol and Ferulic Acid in Leaf Section of Phleum. Plant Physiology 1960, 35(1), 108–114.
- Ranganna, S. Handbook of Analysis and Quality Control for Fruit and Vegetable Products, 2nd Ed.; Tata McGraw-Hill Publishing Ltd.: New Delhi, India, 2008.
- Schanderi, S.H. Method in Food Analysis; Academic Press: New York, NY, 1970.
- Bray, H.G.; Thorpe, W.V. Analysis of Phenolic Compounds of Interest in Metabolism. Methods in Biochemical Analysis 1954, 1, 27–52.
- Sultana, B.; Anwar, F.; Asi, M.R.; Chatha, S.A.S. Antioxidant Potential of Extracts from Different Agro Wastes: Stabilization of Corn Oil. Grasas y Aceites 2008, 59(3), 205–217.
- Brand-Williams, W.; Cuvelier, M.E.; Berset, C. Use of a Free Radical Method to Evaluate Antioxidant Activity. LWT–Food Science and Technology 1995, 28(1), 25–30.
- Naozuka, J.; Vieira, C.E.; Nascimento, N.A.; Oliveira, V.P. Elemental Analysis of Nuts and Seeds by Axially Viewed ICP OES. Food Chemistry 2011, 124(4), 1667–1672.
- Kumar, N.; Bhandari, P.; Singh, B.; Gupta, A.P.; Kaul, V.K. Reversed Phase-HPLC for Rapid Determination of Polyphenols in Flowers of Rose Species. Journal of Separation Science 2008, 31(2), 262–267.
- Khawas, P.; Das, A.J.; Sit, N.; Badwaik, L.S.; Deka, S.C. Nutritional Composition of Culinary Musa ABB at Different Stages of Development. American Journal of Food Science and Technology 2014, 2(3), 80–87.
- Fernandes, K.M.; Carvalho, V.D.; Cal-Vidal, J. Physical Changes During Ripening of Silver Banana. Journal of Food Science 1979, 44(4), 1254–1255.
- Singh, R.R.; Sharma, R.M. Structure, Cellular Components, and Composition of Fruits and Vegetables. In Postharvest Technology of Fruits and Vegetables; Verma, L.R.; Joshi, V.K.; Eds.; Indus Publ. Co.: New Delhi, India, 2000; 76–93.
- Adisa, V.A.; Okey, E.N. Carbohydrate and Protein Composition of Banana Pulp and Peel as Influenced by Ripening and Mold Contamination. Food Chemistry 1987, 25(2), 85–91.
- Goswami, B.; Borthakur, A. Chemical and Biochemical Aspects of Developing Culinary Banana (Musa ABB) “Kachkal. ” Food Chemistry 1996, 55(2), 169–172.
- Kaiser, C.; Wolstenholme, B.N. Aspects of Delayed Harvest of “Hass” Avocado (Persea Americana Mill.) Fruit in Cool Subtropical Climate. I. Fruit Lipid and Fatty Acid Accumulation. Journal of Horticultural Science and Biotechnology 1994, 69(3), 437–445.
- Siddika, A.; Md, A.; Khatun, S.; Khan, M.M.H.; Pervin, F. Changes in Contents of Some Chemical Compositions and Activities of Hydrolytic and Oxidative Enzymes of Coccinia Cordifolia L. Fruits. Journal of Bioscience 2013, 21, 35–41.
- Anhwange, B.A. Chemical Composition of Musa Sapientum (Banana) Peels. Journal of Food Technology 2008, 6(6), 263–266.
- Adeniji, T.A.; Barimalaa, I.S.; Tenkouano, A.; Sanni, L.O.; Hart, A.D. Antinutrients and Heavy Metals in New Nigerian Musa Hybrid Peels with Emphasis on Utilization in Livestock Production. Fruits 2008, 63(2), 65–73.
- Dhingra, D.; Michael, M.; Rajput, H.; Patil, R.T. Dietary Fibre in Foods: A Review. Journal of Food Science and Technology 2012, 49(3), 255–266.
- Sakyi-Dawson, E.; Asamoah-Bonti, P.; Annor, G.A. Biochemical Changes in New Plantain and Cooking Banana Hybrids at Various Stages of Ripening. Journal of the Science of Food Agriculture 2008, 88(15), 2724–2729.
- Cordenunsi, B.R.; Lajolo, F.M. Starch Breakdown During Banana Ripening: Sucrose Synthase and Sucrose Phosphate Synthase. Journal of Agricultural and Food Chemistry 1995, 43(2), 347–351.
- James, M.G.; Denyer, K.; Myers, A.M. Starch Synthesis in the Cereal Endosperm. Current Opinion in Plant Biology 2003, 6(3), 215–222.
- Emaga, T.H.; Bindelle, J.; Agneesens, R.; Buldgen, A.; Wathelet, B.; Paquot, M. Ripening Influences Banana and Plantain Peels Composition and Energy Content. Tropical Animal Health and Production 2011, 43(1), 171–177.
- Punna, R.; Paruchuri, U.R. Effect of Maturity and Processing on Total, Insoluble, and Soluble Dietary Fiber Contents of Indian Green Leafy Vegetables. International Journal of Food Science and Nutrition 2004, 55(7), 561–567.
- Scheller, V.H.; Ulvskov, P. Hemicelluloses. Annual Review of Plant Biology 2010, 61, 263–289.
- Cosgrove, J.D. Plant Cell Growth and Elongation. In Encyclopedia of Life Sciences. Wiley Online Library. John Willey & Sons: New York, NY, 2014. DOI:10.1038/npg.els.0001688.
- Pilnik, W. Pectin—A Many Splendored Thing. In Gums and Stabilizers for the Food Industry 5; Phillips, G.O.; Williams, P.A.; Wedlock, D.J.; Eds.; IRL Press: Oxford, UK, 1990; 209–222.
- Lohani, S.; Trivedi, P.K.; Nath, P. Changes in Activities of Cell Wall Hydrolases During Ethylene-induced Ripening in Banana: Effect of 1-MCP, ABA, and IAA. Postharvest Biology and Technology 2004, 31(2), 119–126.
- Bugaud, C.; Alter, P.; Daribo, M.O.; Brioullet, J.M. Comparison of the Physicochemical Characteristics of a New Triploid Banana Hybrid, FLHORBAN 920, and the Cavendish Variety. Journal of the Science of Food and Agriculture 2009, 89, 407–413.
- Ashraf, A.M.; Maah, J.M.; Yusoff, I.; Mahmood, K.; Wajid, A. Study of Antioxidant Potential of Tropical Fruits. International Journal of Bioscience, Biochemistry, and Bioinformatics 2011, 1(1), 53–57.
- Pandey, K.B.; Rizvi, S.I. Plant Polyphenols As Dietary Antioxidants in Human Health and Disease. Oxidative Medicine and Cellular Longevity 2009, 2(5), 270–278.
- Delfanian, M.; Kenari, R.E.; Sahari, M.A. Antioxidant Activity of Loquat (Eriobotrya Japonica Lindl.) Fruit Peel and Pulp Extracts in Stabilization of Soybean Oil During Storage Conditions. International Journal of Food Properties 2015, 18(12), 2813–2824.
- Kiyoshi, M.; Wahachiro, T. Change in Polyphenol Compound in Banana Pulp During Ripening. Food Preservation Science 2003, 29(6), 347–351.
- Sundaram, S.; Anjum, S.; Dwivedi, P.; Rai, G.K. Antioxidant Activity and Protective Effect of Banana Peel Against Oxidative Hemolysis of Human Erythrocyte at Different Stages of Ripening. Applied Biochemistry and Biotechnology 2011, 164(7), 1192–1206.
- Cao, G.; Sofic, E.; Prior, R.L. Antioxidant and ProOxidant Behaviour of Flavonoids: Structure Activity Relationships. Free Radical Biology and Medicine 1997, 22(5), 749–760.
- Choi, S.H.; Ahn, J.B.; Kim, H.J.; Im, N.K.; Kozukue, N.; Levin, C.E.; Friedman, M. Changes in Free Amino Acid, Protein, and Flavonoid Content in Jujube (Ziziphus Jujube) Fruit During Eight Stages of Growth and Antioxidative and Cancer Cell Inhibitory Effects by Extracts. Journal of Agricultural and Food Chemistry 2012, 60, 10245–10255.
- Gull, J.; Sultana, B., Anwar, F.; Naseer, R.; Ashraf, M.; Ashrafuzzaman, M. Variation in Antioxidant Attributes at Three Ripening Stages of Guava (Psidium Guajava L.) Fruit from Different Geographical Regions of Pakistan. Molecules 2012, 17(31), 65–3180.
- Jimenez, A.; Creissen, G.; Kular, B.; Firmin, J.; Robinson, S.; Verhoeyen, M.; Mullineaux, P. Changes in Oxidative Processes and Components of the Antioxidant System During Tomato Fruit Ripening. Planta 2002, 214(5), 751–758.
- Del Rio, L.A.; Pastori, G.M.; Palma, J.M.; Sandalio, L.M.; Sevilla, F.; Corpas, F.J.; Jiménez, A.; López-Huertas, E.; Hernández, J.A. The Activated Oxygen Role of Peroxisomes in Senescence. Update on Biochemistry. Plant Physiology 1998, 116, 1195–1200.
- John, P.; Marchal, L. Ripening and Biochemistry of the Fruit. In Bananas and Plantains; Gowen, S.; Ed.; Chapman and Hall: London, 1995; 434–467.
- Marschner, H. Mineral Nutrition of Higher Plants, 2nd Ed; Academic Press: New York, NY, 1995; 278–290.
- Rop, O.; Sochor, J.; Jurikova, T.; Zitka, O.; Skutkova, H.; Mlcek, J.; Salas, P.; Krska, B.; Babula, P.; Adam, V.; Kramarova, D.; Beklova, M.; Provaznik, I.; Kizek, R. Effect of Five Different Stages of Ripening on Chemical Compounds in Medlar (Mespilus Germanica L.). Molecules 2010, 16(1), 74–91.
- Herbert, D-H.; Carlos, B-F.; Augusto, R-B. Effect of Two Levels of Ripe Banana Peel on Milk Production by Dairy Cattle. Agronomía Costarricense 1998, 22(1), 43–49.
- Ramadan, M.F.; Morsel, J.T. Neutral Lipids Classes of Black Cumin (Nigella Sativa L.) Seed Oils. European Food Research and Technology 2002, 214(3), 202–206.
- Simmonds, N.W. Bananas, 2nd Ed; Longmans: London, UK, 1966.
- Gibson, L.; Rupasinghe, V.H.P.; Charles, F.F.; Eaton, L. Characterization of Changes in Polyphenols, Antioxidant Capacity, and Physicochemical Parameters During Low Bush Blueberry Fruit Ripening. Antioxidants 2013, 2, 216–229.
- Thirumavalavan, M.; Lai, Y.-L.; Lee, J.-F. Fourier Transform Infrared Spectroscopic Analysis of Fruit Peels Before and After the Adsorption of Heavy Metal Ions from Aqueous Solution. Journal of Chemical and Engineering Data 2011, 56, 2249–2255.
- Sun, J.X.; Xu, F.; Sun, X.F.; Xiao, B.; Sun, R.C. Physicochemical and Thermal Characterization of Cellulose from Barley Straw. Polymer Degradation and Stability 2005, 88(3), 521–531.
- Fan, D.; Ma, W.; Wang, L.; Huang, J.; Zhao, J.; Zhang, H.; Chen, W. Determination of Structural Changes in Microwaved Rice Starch Using Fourier Transform Infrared and Raman Spectroscopy. Starch/Stärke 2012, 64(8), 598–606.
- Zeng, J.; Li, G.; Goa, H.; Ru, Z. Comparison of A and B Starch Granules from Three Wheat Varieties. Molecules 2011, 16, 10570–10591.
- Sanchez-Rivera, M.M.; Flores-Ramirez, I.; Zamudio-Flores, P.B.; Gonzalez-Soto, R.A.; Rodriguez-Ambriz, S.L.; Bello-Perez, L.A. Acetylation of Banana (Musa Paradisiaca L.) and Maize (Zea Mays L.) Starches Using a Microwave Heating Procedure and Iodine As Catalyst: Partial Characterization. Starch/Starke 2010, 62, 155–164.