
abstract
Hydrolysates with antioxidant and antihypertensive activities were obtained from sarcoplasmic proteins of canned sardine by-product and proteases extracted from Brewer’s spent yeast. Using response surface methodology, hydrolysis time and temperature were selected to achieve the maximum bioactivity. Hydrolysates produced using the substrate/enzyme ratio 1:0.27 (mg/U), 7 h and 50ºC, presenting an angiotensin I-converting enzyme-inhibitory activity of 164 µg protein/mL and an antioxidant activity of 293 μM TE/mL. Experimental results agreed with predicted values within a 95% confidence interval. Within this work the simultaneous valorisation of two agro-industrial by-products was successfully achieved.
Introduction
Sardine (Sardina pilchardus) is the main species caught off the Portuguese cost. The vast majority of it is used in the canned sardine industry. Its by-products include head, tail, viscera, and muscle around the head. Although this waste is an excellent source of proteins, it is usually processed into low market-value products, namely, fish meal and fertilizers. Therefore, improving the value of this underutilized by-product is of major interest.[Citation1] One potential application is the production of sardine protein hydrolysates (SPH) with improved physicochemical, functional, and sensorial properties when compared with the intact proteins.[Citation2,Citation3] Additionally, SPH may contain bioactive peptides with a broad spectrum of pharmaceutical, cosmetic, and food industry applications.[Citation4–Citation6] The biological properties of sardine bioactive peptides, and their use as antioxidant, antihypertensive, antithrombotic, immunomodulatory, antimicrobial agents are now a major field of study as reviewed recently by various authors.[Citation1] To date SPH have been produced by (1) in vitro enzymatic hydrolysis (Alcalase,[Citation2,Citation7–Citation11] Protamex,[Citation8] Flavourzyme[Citation8]); (2) autolytic process using endogenous enzymes (crude enzyme extract from sardine viscera);[Citation7,Citation10,Citation11] (3) microbial fermentation (crude enzyme preparations from Bacillus licheniformis NH1;[Citation10,Citation11] Aspergillus clavatus ES1,[Citation10,Citation11] Bacillus pumilus A1,[Citation12] Bacillus mojavensis A21);[Citation12] (4) simulated gastric digestion (pepsin,[Citation13] trypsin,[Citation9] chymotrypsin;[Citation10] trypsin from skipjack tuna (Katsuwonus pelamis) spleen,[Citation14] hepatopancreas of cuttlefish (Sepia officinalis).[Citation7] Enzymatic hydrolysis is the most widely used method, although the high cost of enzymes can make this an expensive process. Additionally, optimization of variables such as type of protease, pH, temperature, time, substrate concentration, and enzyme-to-substrate ratio are required to influence the extent of hydrolysis and the functionalities of the final SPH.[Citation15] Response surface methodology (RSM) has been successfully used to investigate the effect of these independent variables, alone and in combination, on enzymatic processes.[Citation15]
Brewer’s spent yeast (BSY; Saccharomyces pastorianus) is the second major by-product from brewing industry and is usually used as a feed supplement after heat inactivation.[Citation16] However, before thermal inactivation it can be an excellent source of proteases, which can be used to obtain protein hydrolysates with optimum activity at pH 6.[Citation17] In this work, sarcoplasmic sardine proteins extracted from canned sardine by-products were used as substrate to obtain hydrolysates. These proteins are soluble in water, present isoelectric point around 5.0–5.5, and have low molecular weight (40–70 kDa).[Citation18,Citation19] Protein hydrolysis was performed using proteases extracted from BSY. The optimum time and temperature conditions required to produce SPH with both antioxidant and angiotensin I-converting enzyme-inhibitory (ACE-I) activities were studied. Hydrolysis was monitored by chromatography and electrophoresis. No previous studies were found describing the use of proteases extracted from BSY for SPH production. Furthermore, as far as the authors are aware, this is the first work where RSM methodology is used to optimize the best hydrolysis conditions to obtain in tandem two biological properties in SPH, antioxidant and ACE-I activities. This work contributes to obtain added-value for two industrial by-products.
Material and methods
Standards and reagents
Acetonitrile high-performance liquid chromatography (HPLC) grade, trifluoroacetic acid (TFA); Folin-Ciocalteu phenol reagent; 2,4,6-trinitrobenzenesulfonic acid (TNBS); L-leucine; iron (III) chloride hexahydrate; potassium ferrcyanide; 2,4,6-tripyridyl-s-triazine (TPTZ); commercial angiotensin-I-converting enzyme (ACE; EC 3.4.15.1, 5.1 U/mg); molecular weight standards from 14 to 97 kDa for sodium dodecyl sulphate gel polyacrylamide electrophoresis (SDS-PAGE) separations; bovine serum albumin (BSA); and 6-hydroxy-2,5,7,8-tetramethylchroman-2-carboxylic acid (Trolox) were obtained from Sigma-Aldrich (St. Louis, MO, USA). The ultrafiltration membranes 10 kDa were purchased from Millipore (Sigma-Aldrich) and o-aminobenzoylglycyl-p-nitro-phenylalanylproline (o-ABz-Gly-Phe(NO2)-Pro) was purchased from Bachem Feinchemikalien (Bubendorf, Switzerland).
Equipment
The reverse-phase (RP)-HPLC analyses were carried out using an analytical HPLC system (Jasco, Tokyo, Japan) equipped with a quaternary low pressure gradient HPLC pump (Jasco PU-1580), a degasification unit (Jasco DG-1580-53 3-line degasser), an autosampler (Jasco AS-2057-PLUS), a MD-910 Multiwavelengh detector (Jasco) and a 7125 Rheodyne injector valve (California, USA). Data acquisition was accomplished using Borwin Controller software, version 1.50 (JMBS Developments, Le Fontanil, France). The SDS-PAGE separations were achieved in a Multiple Gel Casters Hoefer® (Holliston, MA), Rect., Mightly Small For 8 × 9 cm Gels Hoefer® apparatus, coupled with a UniEquip Unipack 2000 electric source (UniEquip, Munich, Germany). Spectrophotometric analyses were carried out using a BMG LABTECH’s SPECTROstar Nano-microplate, cuvette ultraviolet-visible (UV/Vis) absorbance reader (Offenburg, Germany). Fluorimetric analyses were carried out using a fluorescence microplate reader (FLUOstar Optima, BMG Labtech GmbH). Samples were freeze-dried with a Telstar freeze dryer, Cryodos-80 model (Terrassa, Spain).
By-products
Flesh sardine by-product including head, scale, skin, blood, bone, viscera, and muscle tissue was provided by the Portuguese company Conservas Ramirez (Matosinhos, Portugal). Approximately 1 kg of this by-product was placed on ice during the transportation to the laboratory and prepared in the same day under refrigerated conditions. BSY (Saccharomyces pastorianus) was supplied as slurry by the brewing industry Unicer (Leça do balio, Portugal). This by-product was collected in transparent glass bottles, transported to the laboratory under refrigerated conditions and stored at 4ºC until preparation procedure (1 day maximum).
Preparation of the sardine sarcoplasmic protein extracts (SPE)
The whole muscle (ordinary and dark) removed manually from sardine by-product was used for extraction of sarcoplasmic proteins, according to the method of Ren et al.[Citation18] with slight modifications. The sardine muscle tissue was washed twice with deionized water and mixed with 0.2 M phosphate buffer pH 6.0, ratio of 1:3 (w/v). The mixture was homogenized using an Ultra-Turrex grinder, 2 min in an ice bath. Then, the homogenate was heated at 85ºC for 20 min to inactivate endogenous enzymes and subsequently centrifuged at 16,000 × g for 20 min, at 4°C. The upper lipid phase was removed manually and discarded; the supernatant was collected and filtered through a Whatman No. 4 filter paper. The final clear supernatant was coded as sardine SPE. The pH of this extract (pH 6.25) was adjusted to pH 6.0 by adding 0.2 N HCl, with constant agitation. The protein concentration of SPE, determined by Lowry method,[Citation20] was 2.40 mg/mL. This extract was keep at –20ºC until used; the storage time was not more than 1 month.
Extraction of BSY proteases
Saccharomyces cell wall was destroyed under refrigerated conditions to minimize enzyme denaturation and obtain a protease rich extract. First, the biomass was washed three times with 0.2 M phosphate buffer pH 6.0 at a ratio 1:3 (w/v) and centrifuged at 5000 × g, 5 min, 4ºC, between each wash. Afterwards, cell wall was destroyed with glass beads at a ratio 1:1:1 (biomass: phosphate buffer pH 6: glass beads; w/v/w) by vortexing 10 times (1 min each) with 1 min cooling intervals on ice. Glass beads were removed and the homogenate was centrifuged at 12,000 × g, 40 min, 4ºC. The resulting clear supernatant was freeze-dried, resuspended in the same buffer (25% of the initial volume) and concentrated using a UF membrane with cut-off of 10 kDa. The protease activity of BSY extract, performed according to Cupp-Enyard,[Citation21] was 0.725 U/mL. BSY proteases were keep at –20ºC until used.
Enzymatic hydrolysis
SPE (containing 2.40 mg protein/mL) was hydrolyzed by BSY proteases (0.725 U/mL) using a substrate/enzyme ratio of 1:0.27 (mg/U) and pH 6. For example, considering a reaction volume of 1 mL, for each 500 µL of SPE (substrate), 450 µL of BSY proteases were added; the remaining volume of 50 µL was 0.2 M sodium phosphate buffer, pH 6.0. Triplicate hydrolysis were performed, using 2 mL eppendorf tubes, in a shaking incubator with constant agitation (200 rpm) at different temperatures and times, according to the experimental model described below. Control [S+E] was the mixture of SPE and BSY proteases before hydrolysis. Inactivation of proteases to stop reaction was performed by heating at 95ºC for 15 min.[Citation22] The hydrolysates were cooled on ice and centrifuged at 3000 × g at 4ºC for 10 min. The clear supernatants, containing soluble peptides and coded as H1 to H13, were collected and stored at –20ºC for further analysis.
Hydrolysis rate (HR %)
RP-HPLC using the chromatographic conditions described by Ferreira et al.[Citation23] were used to follow protein degradation during hydrolysis. The column was a Chrompack P 300 RP (polystyrenedivinylbenzene copolymer, 8 µm, 300Å, 150 × 4.6 mm i.d.; Middleburg, The Netherlands). HR % was based on the measurement of protein fraction that remains intact, for this purpose the peak area of the protein fraction that eluted between 24 and 33 min was measured. The peak area of [S+E] protein fraction before hydrolysis was the maximum intact protein. The following equation was applied:
Protein recovery (PR %) and percentage of peptides formed
PR % was calculated as the amount of protein, determined by Bradford[Citation24] method, in the hydrolysate in comparison with the initial amount of protein, using the following equation:
Additionally, the percentage of peptides formed in the hydrolysates was measured by subtracting the protein content evaluated by Bradford method[Citation24] to the total protein including peptides evaluated by Lowry method,[Citation20] using the following equation:
For both assays, a calibration curve was performed with 2 mg/mL BSA and samples were analysed in triplicate.
Degree of hydrolysis (DH %)
DH % was determined by measuring the increase in free amino groups, using a picrylsulfonic acid solution (TNBS), according to Hsu et al.,[Citation25] α-amino acid group was expressed in terms of L-leucine and the DH % was determined as follows:
where (Lt) was the amount of R-amino acid released at time (t); (L0) was the amount of R-amino acid in original SPE, and (Lmax) was the maximum amount of R-amino acid in SPE obtained after acid hydrolysis. For (Lmax) determination, SPE (500 µL) was mixed with 4.5 mL of 6 N HCl and the hydrolysis was run at 100°C for 24 h. Then, final acid-hydrolyzed sample was filtered through Whatman paper no. 1 to remove the non-hydrolyzed fragments and the supernatant was neutralized with 6 N NaOH before amino acid determination.
Ferric reducing ability (FRAP)
The measurement of the FRAP was performed based on Jansen and Ruskovska[Citation26] procedure, slightly modified. Briefly, 25 μL of sample/standard/control (pure water) and 200 µL of working FRAP reagent were pipetted in the microplate in triplicate. After that, the reaction mixture was incubated for 90 min at 37°C, under constant agitation (200 rpm). The absorbance was measured at 600 nm. Trolox was used as a standard at 50–500 μM to generate a calibration curve (average R2 = 0.9929). Results were expressed as mean values ± standard deviations as µM TE (Trolox equivalent)/mL SPH.
Reducing power method
Reducing power was measured according to the assay reported by Almeida et al.[Citation27] slightly modified. Briefly, 250 µL of SPH samples/control (pure water) were mixed with 250 µL of sodium phosphate buffer (200 mM, pH 6.6) and 250 µL of potassium ferricyanide 1% (w/v). The mixture was incubated at 50ºC for 20 min, and 250 µL of cold TCA 10% (w/v) was added to stop the reaction. Eppendorfs were centrifuged at 650 rpm, 10 min. Then, 500 µL of supernatant was incubated with 500 µL of deionized water and 100 µL of ferric chloride 0.1% (w/v). After 10 min reaction, the absorbance was measured at 700 nm. Reducing power values were expressed as µg/mL.
Angiotensin-converting enzyme-inhibitory (ACE-I) activity
Angiotensin-converting enzyme-inhibitory (ACE-I) activity was measured using the fluorimetric assay of Sentandreu and Toldrá[Citation28] with the modifications reported by Quiros et al.[Citation29] ACE inhibitory percentage (I %) was calculated using the equation:
where B is the fluorescence of the ACE solution without the inhibitor (SPH); A is the fluorescence of the tested sample of SPH; and C is the fluorescence of experimental blank, o-ABz-Gly-Phe(NO2)-Pro dissolved in 150 mM Tris-base buffer (pH 8.3), containing 1.125 M NaCl. The percent inhibition curves (using a minimum of five determinations for each sample peptide concentration) were plotted versus peptide concentration to estimate the mean IC50 value, which is defined as the concentration required to decrease the ACE activity by 50%.[Citation29]
SDS-PAGE
Proteolytic degradation of sardine sarcoplasmic proteins was monitored by SDS-PAGE analysis. Separation gels consisted of a 4% polyacrylamide stacking gel and a 15% polyacrylamide resolving gel and were performed according to Laemmli[Citation30] protocol. Molecular weight proteins were phosphorylase β (97 kDa), BSA (66 kDa), ovalbumin (45 kDa), carbonic anhydrase (30 kDa), trypsin inhibitor (20 kDa), and lysozyme (14 kDa). Coomassie brilliant blue R-250 was used. The protein pattern separated on SDS-PAGE was estimated for its molecular weight by plotting the logarithm of molecular weight of the protein standards against relative mobility (Mr).
SPH amino acid composition
SPH presenting highest FRAP and ACE-I activities was lyophilized and amino acid analysis was performed after hydrolysis with 6 M HCl at 110ºC for 24 h. Derivatization and gas chromatography mass spectrometry (GC/MS) carried out according to Pérez-Palacios et al.[Citation31] Amino acid composition was expressed as grams per 100 g of protein.
Experimental design, modeling, and optimization of hydrolysis conditions
A central composite design (CCD) was built for optimization of the best hydrolysis conditions to obtain simultaneously in tandem two biological properties in SPH, antioxidant and ACE-I activities. The CCD variables under analyse were time (X1) and temperature (X2) at ranged levels of time intervals (0.40; 1.50; 4.25; 7.00 and 8.00 h) and five temperatures (20, 25, 38, 50, and 55ºC), in a total of 13 runs with five center points. CCD consisted of a complete 22-factorial design as cubic points, with four axial points at a distance of α = 1.414 from the design centre and five centre points. The response used in experimental designs was the HR % (Y1), antioxidant activity evaluated by FRAP assay (Y2), and ACE-I activity (Y3). The optimal values of response Y were obtained by solving the regression equation and by analysing the response surface and contour plots using the predictive equations of RSM. Then, the accuracy of the models was tested by conducting a set of experiments using the critical values optimized; the t-test was conducted to compare the responses under optimized conditions with those predicted by models. The statistical analyses were performed by using the software Design Expert trial version 7 (Stat-Ease Inc., Minneapolis, MN, USA).
Statistical analysis
The data obtained for others assays were done by using SPSS statistical software, version 20.0 (SPSS Inc., Chicago, IL, USA). One-way analysis of variance and Duncans’ test was performed to determine the significant differences at the 5% probability level. A Pearson’s correlation was also used to search for correlations between the parameters under study; 1% level was considered to be significant. The t-test was conducted to compare the responses prepared under optimized conditions with those predicted by models.
Results and discussion
Preliminary experiments were conducted by univariate method to study the pH variation during hydrolysis, as well as, the influence of substrate/enzyme ratio (1:0.10, 1:0.15, 1:0.20, 1:0.25, and 1:0.30 [mg/U]) on hydrolysis of SPE. Reactions were performed at constant temperature (37ºC), while stirring at 200 rpm for 4 h. When the initial pH was 6 it remained in the range of 5.8 to 6.5 during the entire hydrolysis period. For this reason it was decided not adjust pH during SPE hydrolysis. From an industrial point-of-view, hydrolysis carried out without any pH adjustment is economically desirable.[Citation21] Regarding to substrate/enzyme ratio, 1:0.10 (mg/U) and 1:0.15 (mg/U) gave a significantly lower HR %, whereas no significant differences were found (p > 0.05) on the HR % obtained from hydrolysis using 1:0.250 and 1:0.30 mg/U. As a result, the ratio 1:0.27 mg/U was chosen, as it is the same reported by Bougatef et al.[Citation11]
The RP-HPLC profiles of sarcoplasmic proteins plus BSY proteases [S+E] without hydrolysis, and two different SPH, one presenting HR = 9.3 % (25ºC, 1.50 h), and another presenting HR = 83% (50ºC, 7.00 h) are shown in . The RP-HPLC chromatograms are divided into three fractions: “Less hydrophobic peptides” (eluted between 4 and 12 min); “hydrophobic polypeptides” (eluted between 12.1 and 23.9 min) and “proteins” (eluted between 24 and 33 min). HR % determination was based on the measurement of “proteins” fraction before and after hydrolysis.
Figure 1. The RP-HPLC profiles of A: sarcoplasmic proteins plus BSY proteases [S+E] without hydrolysis; B: SPH presenting HR = 9.3 % (25ºC, 1.50 h); and C: SPH presenting HR = 83% (50ºC, 7.00 h). RP-HPLC chromatograms are divided into three fractions: “less hydrophobic peptides” (eluted between 4 and 12 min); “hydrophobic polypeptides” (eluted between 12.1 and 23.9 min) and “proteins” (eluted between 24 and 33 min). Hydrolysis rate (HR%) determination was based on the measurement of “proteins” fraction before and after hydrolysis.
![Figure 1. The RP-HPLC profiles of A: sarcoplasmic proteins plus BSY proteases [S+E] without hydrolysis; B: SPH presenting HR = 9.3 % (25ºC, 1.50 h); and C: SPH presenting HR = 83% (50ºC, 7.00 h). RP-HPLC chromatograms are divided into three fractions: “less hydrophobic peptides” (eluted between 4 and 12 min); “hydrophobic polypeptides” (eluted between 12.1 and 23.9 min) and “proteins” (eluted between 24 and 33 min). Hydrolysis rate (HR%) determination was based on the measurement of “proteins” fraction before and after hydrolysis.](/cms/asset/aaf3e0e1-d9fa-4e23-8e85-88a1eb86edb1/ljfp_a_1176036_f0001_oc.jpg)
Optimization of hydrolysis conditions
Optimization of the variables affecting the antioxidant and antihypertensive activity of hydrolysates was carried out using a statistical design, by CCD. The experiments were performed in a random manner at different combinations of temperature (X1) and time (X2). The HR % (Y1), FRAP (Y2), and ACE-I activity (Y3) of SPH obtained by BSY proteases were used as responses factors for CCD (). Regression analyses were performed to fit the response functions. The parameters of the Eqs. (6–8) were explained by a quadratic model for each response and are presented as follows:
Table 1. Results from experimental design by central composite for evaluation the effects of hydrolysis temperature and time conditions on hydrolysis rate, FRAP, and ACE-I activity.
where Y is the predicted response; X1 the uncoded value of variable temperature (ºC) and X2 the uncoded value of variable time (h). Adequacy and significance of the quadratic model was evaluated by analysis of the variance (ANOVA) by means of Fisher’s f-test. The quadratic models were validated by two diagnostic residuals, the squared correlation coefficient (R2) and the predictive squared correlation coefficient (Q2). Values of R2 > 0.75 and Q2 > 0.60 indicate adequacy of models.[Citation32] The R2 for checking the fitness of model was very good (relatively close to 1), indicating that models explained 98.6, 98.4, and 95.3% of the variation on the HR, FRAP, and ACE-I activity of sardine sarcoplasmic proteins, respectively. The Q2-values were, respectively, 0.9738, 0.9516, and 0.9804 for the three responses, indicating the goodness of the model. The “Adeq Precision” was higher than 4 (as desirable) for the three responses, indicating an adequate signal-to-noise ratio. The statistical analysis also showed that the “lack of fit” was not significant (p > 0.05), which confirmed the adequacy of model to describe the experimental data and for the prediction of the three studied parameters. The independent variable X1 had a significant effect on Y1, Y2, and Y3 (p < 0.05); X2 had significant effect on Y1 and Y2 (p < 0.05), but not on Y3. The interactions between X1.X2 influenced Y2 and Y3 (p < 0.05).Therefore, this model proved to be powerful for navigating the design space and describes the dependence of HR %, FRAP, and ACE-I activity on temperature and time.
Analysis of response surfaces
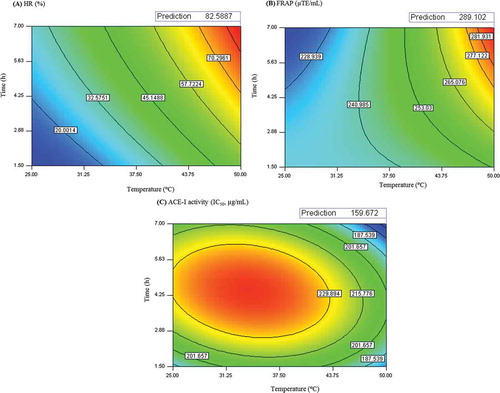
Contour plots were employed to study the influence of temperature (ºC) and time (h) on HR %, FRAP and ACE-I activity. HR % increased with the increasing of time and temperature (Contour plot A, ). The minimum predicted value of HR % (7.4%) was observed at 25ºC and 1.50 h, while the maximum predicted value of HR % (83%) was observed at 50ºC and 7.00 h. Extensive time of hydrolysis and high temperatures also enhanced the FRAP value of SPH (counter plot B of ). The minimum predicted FRAP value was 217 µM TE/mL, observed at 25ºC and 7.00 h; whereas the maximum predicted FRAP value was 289 µM TE/mL found at 50ºC and 7.00 h. Similar behavior was observed for HR % and FRAP, thus the extension of proteolysis is favorable to enhance the antioxidant properties of SPH. Concerning to ACE-I activity, the IC50 increased near to the centre point design and decreased for higher temperature and extensive time of hydrolysis (counter plot C, ). Lower IC50 value (160 µg/mL), which means higher ACE-I activity was observed when hydrolysis was performed at 50ºC and 7.00 h.
Figure 2. Counter plots for interaction effects of temperature (ºC) and time (hour) on; (A) hydrolysis rate (%), (B) antioxidant activity determined by FRAP assay, and (C) ACE-I activity of SPH. Optimum point was identified on the response surface.
Validation of the RSM model
The optimal hydrolysis conditions to produce a SPH with the highest FRAP and minimum IC50 was generated following desirability approach. Thus, the optimal conditions to obtain maximum antioxidant and ACE-I activity were hydrolysis temperature of 50ºC and hydrolysis time of 7.00 h. Under these conditions, the predicted antioxidant activity was 289 µM TE/mL and the IC50 was 160 µg protein/mL. The desirability analysis in identifying the optimal conditions by the RSM was 99.2%. Results showed that there is no statistically significant difference between the experimental and estimated values within a 95% confidence interval. Thereby, the adequacy of the models in predicting the optimum hydrolysis conditions for SPH production using proteases from BSY was confirmed.
Characterization of SPH obtained under optimum conditions
Comparison of antioxidant activity of [S+E] mixture before hydrolysis and of SPH obtained under optimum conditions was performed by FRAP and by reducing power, since both methods have been widely used to screen antioxidant activity of protein hydrolysates. The FRAP value of [S+E] mixture before hydrolysis was 146 µM TE/mL, whereas for SPH it increased to 291 µM TE/mL. This value is comparable to that exhibited by protein hydrolysates derived from threadfin bream surimi by-products (221 µM TE/mL).[Citation33] With respect to reducing power, [S+E] mixture before hydrolysis presented 1210 µg/mL, whereas SPH presented 1312 µg/mL. These results were comparable to those obtained for bigeye tuna protein hydrolysates, which ranged between 948 and 12500 µg/mL.[Citation34]
The ACE-I activity of [S+E] mixture before hydrolysis was IC50 604 µg/mL, whereas SPH presented an IC50 of 164 µg/mL, which is comparable to the IC50 described in literature for other fish protein hydrolysates. Matsui et al.[Citation35] describe IC50 of 260 µg/mL for sardine hydrolysates prepared using 0.3% Alcalase® at pH 9, 50ºC for 17 h and Cinq-Mars and Li-Cha[Citation15] reported a Pacific hake fillet hydrolysate with IC50 of 165 µg/mL, by incubation with 3.0% Protamex® at pH 6.5, 40ºC for 125 min.
Electrophoresis was performed to characterize the larger fragments resulting from proteolysis. SDS-PAGE of control sample (S+E) showed bands in the range of 51 to 12 kDa (). These fractions are in agreement with the SDS-PAGE patterns of sardine sarcoplasmic proteins described by other authors.[Citation36,Citation37] The most abundant bands were 51, 47, 45 kDa (probably actin), 41-39 kDa a doublet band (probably from creatine kinase and aldolase), and 39-41 kDa band probably from glyceraldehyde-3-phosphate dehydrogenase. Additional bands were found at 17 and 15 kDa.[Citation37] The last one could be from myoglobin, as observed by Chaijan et al.[Citation3] Finally, two protein bands, at 13 and 12 kDa could be parvalbumins.[Citation37] Some myofibrillar proteins (90 kDa band) were also extracted. SDS-PAGE analysis indicates that under prolonged time and increased temperature of hydrolysis, 50ºC, 7.00 h, sardine sarcoplasmic proteins were extensively hydrolyzed. These results are in agreement with the results from assays that evaluate the extension of hydrolysis or the peptides formation, since this SPH presented HR % of 83, DH% of 14, PR % of 86 and % of peptides formed 63%.
Figure 3. SDS-PAGE profiles of sarcoplasmic proteins extract (SPE) plus Brewer’s spent yeast (BSY) proteases [S+E] without hydrolysis and sardine protein hydrolysates (SPH). A total of 8 µL of sample was applied to each well. Legend: Lane BSA shows bovine soro albumin (66 kDa); lane MW shows molecular weight of standard markers (14–97 kDa); lane S (substract) shows SPE in the absence of the BSY proteases; lane E (enzyme) shows BSY proteases in the absence of SPE; lane [S+E] shows SPE and BSY proteases extract without hydrolysis (control). Lane A shows SPH with HR = 29% (25ºC, 7.00 h); lane B shows SPH with HR = 83% (50ºC, 7.00 h); lane C shows SPH with HR = 41% (38ºC, 4.25 h).
![Figure 3. SDS-PAGE profiles of sarcoplasmic proteins extract (SPE) plus Brewer’s spent yeast (BSY) proteases [S+E] without hydrolysis and sardine protein hydrolysates (SPH). A total of 8 µL of sample was applied to each well. Legend: Lane BSA shows bovine soro albumin (66 kDa); lane MW shows molecular weight of standard markers (14–97 kDa); lane S (substract) shows SPE in the absence of the BSY proteases; lane E (enzyme) shows BSY proteases in the absence of SPE; lane [S+E] shows SPE and BSY proteases extract without hydrolysis (control). Lane A shows SPH with HR = 29% (25ºC, 7.00 h); lane B shows SPH with HR = 83% (50ºC, 7.00 h); lane C shows SPH with HR = 41% (38ºC, 4.25 h).](/cms/asset/45e38b4f-95f0-4b2f-a22c-63dc5186ee7c/ljfp_a_1176036_f0003_b.gif)
Low-molecular-weight peptides are widely recognized as presenting higher antioxidant and ACE-I activities, but the amino acid composition of peptides is also a crucial aspect. ACE-I peptides usually contain a proline residue at the carboxyl terminal end, whereas amino acids such as tyrosine, tryptophan, histidine, methionine, and lysine have been known to exhibit antioxidant activity.[Citation4] Amino acid analysis of SPH revealed that it is rich in glutamic acid, glutamine, aspartic acid an alanine, which accounted for 18.01, 12.41, 10.48, and 8.98% of the total amino acids, respectively. It also presents relatively high content of hydrophobic amino acids, such as proline (3.14%), leucine (5.58%), glycine (4.20%), isoleucine (2.20%), phenylalanine (3.16%), and valine (4.23%) and contained amino acids that exhibit antioxidant activity, such as, tyrosine (2.04%), histidine (5.80%), methionine (2.22%), and lysine (2.58%); tryptophan was not determined due to the acidic hydrolysis conditions.
Conclusions
Sardine sarcoplasmic proteins were hydrolysed by the proteases extracted from BSY to obtain hydrolysates with antioxidant activity and ACE-I activity. Hydrolysates produced using the substrate/enzyme ratio 1:0.27 (mg/U), 7 h and 50ºC presented an antioxidant activity of 290 μM TE/mL and an ACE-I activity (IC50) of 164 µg protein/mL. These experimental FRAP and IC50 values agreed with the predicted values (289 μM TE/mL and 160 µg protein/mL, respectively) within a 95% confidence interval, suggesting a good fit between the models and the experimental data. Thus, RSM was an efficient statistical tool in the optimization of hydrolysis conditions. SPH presents relatively high content of hydrophobic amino acids, such as proline, leucine, glycine, isoleucine, phenylalanine and valine, and amino acids that exhibit antioxidant activity, such as, tyrosine, histidine, methionine, and lysine. Further work should be done to test antioxidant activity of this hydrolysate in vivo, as well as isolate and identify the specific peptides that are responsible for these bioactive properties.
Funding
This work received financial support from project UID/QUI/50006/2013–POCI/01/0145/FEDER/007265 with financial support from FCT/MEC through national funds and co-financed by FEDER, under the Partnership Agreement PT2020. One of the authors (E.F. Vieira) wishes to thank the Fundação Ciência Tecnologia grant SFRH/BD/81845/2011. To all financing sources the authors are greatly indebted.
Additional information
Funding
Related Research Data
References
- Ferraro, V.; Carvalho, A.P.; Piccirillo, C.; Santos, M.M.; Castro, P.M.; Pintado, M.E. Extraction of High Added Value Biological Compounds from Sardine, Sardine-Type Fish and Mackerel Canning Residues—A Review. Materials Science & Engineering. C, Materials for Biological Applications 2013, 33, 3111–3120.
- Souissi, N.; Bougatef, A.; Triki-Ellouz, Y.; Nasri, M. Biochemical and Functional Properties of Sardinella (Sardinella Aurita) by-Product Hydrolysates. Food Technology and Biotechnology 2007, 45, 187–194.
- Chaijan, M.; Benjakul, S.; Visessanguan, W.; Faustman, C. Characterisation of Myoglobin from Sardine (Sardinella Gibbosa) Dark Muscle. Food Chemistry 2007, 100, 156–164.
- Nazeer, R.A.; Deeptha, R. Antioxidant Activity and Amino Acid Profiling of Protein Hydrolysates from the Skin of Sphyraena Barracuda and Lepturacanthus Savala. International Journal of Food Properties 2013, 16, 500–511.
- Zhang, L.; Liu, Y.; Lu, D., Han, J.; Lu, X.; Tian, Z.; Wang, Z. Angiotensin Converting Enzyme Inhibitory, Antioxidant Activities, and Antihyperlipidaemic Activities of Protein Hydrolysates from Scallop Mantle (Chlamys Farreri). International Journal of Food Properties 2015, 18, 33–42.
- Bhat, Z.F.; Kumar, S.; Bhat, H. Bioactive Peptides of Animal Origin: A Review. Journal of Food Science and Technology 2015, 52(9), 5377–5392.
- Barkia, A.; Bougatef, A.L.I.; Khaled, H.B.; Nasri, M. Antioxidant Activities of Sardinelle Heads and/or Viscera Protein Hydrolysates Prepared by Enzymatic Treatment. Journal of Food Biochemistry 2010, 34, 303–320.
- Kechaou, E.S.; Dumay, J.; Donnay-Moreno, C.; Jaouen, P.; Gouygou, J-P.; Bergé, J-P.; Amar, R.B. Enzymatic Hydrolysis of Cuttlefish (Sepia Officinalis) and Sardine (Sardina Pilchardus) Viscera Using Commercial Proteases: Effects on Lipid Distribution and Amino Acid Composition. Journal of Bioscience and Bioengineering 2009, 107, 158–164.
- Morales-Medina, R.; Tamm, F.; Guadix, A.M.; Guadix, E.M.; Drusch, S. Functional and Antioxidant Properties of Hydrolysates of Sardine (S. Pilchardus</i>) and Horse Mackerel (T. Mediterraneus) for the Microencapsulation of Fish Oil by Spray-Drying. Food Chemistry 2016, 194, 1208–1216.
- Bougatef, A.; Nedjar-Arroume, N.; Ravallec-Plé, R.; Leroy, Y.; Guillochon, D.; Barkia, A.; Nasri, M. Angiotensin I-Converting Enzyme (ACE) Inhibitory Activities of Sardinelle (Sardinella Aurita) by-Products Protein Hydrolysates Obtained by Treatment with Microbial and Visceral Fish Serine Proteases. Food Chemistry 2008, 111, 350–356.
- Bougatef, A.; Nedjar-Arroume, N.; Manni, L.; Ravallec, R.; Barkia, A.; Guillochon, D.; Nasri, M. Purification and Identification of Novel Antioxidant Peptides from Enzymatic Hydrolysates of Sardinelle (Sardinella Aurita) by-Products Proteins. Food Chemistry 2010, 118, 559–565.
- Khaled, H.B.; Ktari, N.; Ghorbel-Bellaaj, O.; Jridi, M.; Lassoued, I.; Nasri, M. Composition, Functional Properties and in Vitro Antioxidant Activity of Protein Hydrolysates Prepared from Sardinelle (Sardinella Aurita) Muscle. Journal of Food Science and Technology 2014, 51, 622–633.
- Benhabiles, M.S.; Abdi, N.; Drouiche, N.; Lounici, H.; Pauss, A.; Goosen, M.F.A.; Mameri, N. Fish Protein Hydrolysate Production from Sardine Solid Waste by Crude Pepsin Enzymatic Hydrolysis in a Bioreactor Coupled to an Ultrafiltration Unit. Materials Science and Engineering: C 2012, 32, 922–928.
- Klomklao, S.; Benjakul, S.; Visessanguan, W.; Kishimura, H.; Simpson, B.K. Proteolytic Degradation of Sardine (Sardinella Gibbosa) Proteins by Trypsin from Skipjack Tuna (Katsuwonus Pelamis) Spleen. Food Chemistry 2006, 98, 14–22.
- Cinq-Mars, C.D.; Li-Chan, E.C. Optimizing Angiotensin I-Converting Enzyme Inhibitory Activity of Pacific Hake (Merluccius Productus) Fillet Hydrolysate Using Response Surface Methodology and Ultrafiltration. Journal of Agricultural and Food Chemistry 2007, 55, 9380–9388.
- Ferreira, I.M.P.L.V.O.; Pinho, O.; Vieira, E.; Tavarela, J.G. Brewer’s Saccharomyces Yeast Biomass: Characteristics and Potential Applications. Trends in Food Science & Technology 2010, 21, 77–84.
- Hecht, K.A.; O’Donnell, A.F.; Brodsky, J.L. The Proteolytic Landscape of the Yeast Vacuole. Cell Logist 2014, 4, e28023.
- Ren, J.; Zhao, M.; Shi, J.; Wang, J.; Jiang, Y.; Cui, C.; Kakuda, Y.; Xue, S.J. Optimization of Antioxidant Peptide Production from Grass Carp Sarcoplasmic Protein Using Response Surface Methodology. LWT–Food Science and Technology 2008, 41, 1624–1632.
- Batista, I.; Pires, C.; Nelhas, R. Extraction of Sardine Proteins by Acidic and Alkaline Solubilisation. Food Science and Technology International 2007, 13, 189–194.
- It’s Fast, I.s.E. and I.T. Blue, Determination of Total Protein by the Lowry Method Using the BioTek Instruments’ ELx808 Microplate Reader, 2006.
- Cupp-Enyard, C. Sigma’s Non-Specific Protease Activity Assay—Casein as a Substrate. Journal of Visualized Experiments: JoVE 2008, 19, 899.
- Himonides, A.T.; Taylor, A.K.D.; Morris, A.J. Study of the Enzymatic Hydrolysis of Fish Frames Using Model Systems. Food and Nutrition Sciences 2011, 2, 575–585.
- Ferreira, I.M.P.L.V.O.; Eça, R.; Pinho, O.; Tavares, P.; Pereira, A.; Cecília Roque, A. Development and Validation of an HPLC/UV Method for Quantification of Bioactive Peptides in Fermented Milks. Journal of Liquid Chromatography & Related Technologies 2007, 30, 2139–2147.
- Bradford Protein Assay. Bio-protocol Bio101: e45. http://www.bio-protocol.org/e45 2011 (accessed on 20th November 2011).
- Hsu, K.-C. Purification of Antioxidative Peptides Prepared from Enzymatic Hydrolysates of Tuna Dark Muscle by-Product. Food Chemistry 2010, 122, 42–48.
- Jansen, E.; Ruskovska, T. Comparative Analysis of Serum (Anti)oxidative Status Parаmeters in Healthy Persons. International Journal of Molecular Sciences 2013, 14, 6106–6115.
- Almeida, I.M.C.; Barreira, J.C.M.; Oliveira, M.B.P.P.; Ferreira, I.C.F.R. Dietary Antioxidant Supplements: Benefits of Their Combined Use. Food and Chemical Toxicology 2011, 49, 3232–3237.
- Sentandreu, M.Á.; Toldrá, F. A rapid, Simple and Sensitive Fluorescence Method for The Assay of Angiotensin-I Converting Enzyme. Food Chemistry 2006, 97, 546–554.
- Quiros, A.; del Mar Contreras, M.; Ramos, M.; Amigo, L.; Recio, I. Stability to Gastrointestinal Enzymes and Structure-Activity Relationship of Beta-Casein-Peptides with Antihypertensive Properties. Peptides 2009, 30, 1848–1853.
- Laemmli, U.K. Cleavage of Structural Proteins During the Assembly of the Head of Bacteriophage T4. Nature 1970, 227, 680–685.
- Pérez-Palacios, T.; Melo, A.; Cunha, S.; Ferreira, I.M.P.L.V.O. Determination of Free Amino Acids in Coated Foods by GC–MS: Optimization of the Extraction Procedure by Using Statistical Design. Food Analytical Methods 2014, 7, 172–180.
- Mandenius, C.F.; Brundin, A. Bioprocess Optimization Using Design-of-Experiments Methodology. Biotechnology Progress 2008, 24, 1191–1203.
- Yongsawatdigul, J.; Hemung, B.-O. Structural Changes and Functional Properties of Threadfin Bream Sarcoplasmic Proteins Subjected to pH-Shifting Treatments and Lyophilization. Journal of Food Science 2010, 75, C251–C257.
- Yang, P.; Ke, H.; Hong, P.; Zeng, S.; Cao, W. Antioxidant Activity of Bigeye Tuna (Thunnus Obesus) Head Protein Hydrolysate Prepared with Alcalase. International Journal of Food Science & Technology 2011, 46, 2460–2466.
- Matsui, T.; Matsufuji, H.; Seki, E.; Osajima, K.; Nakashima, M.; Osajima, Y. Inhibition of Angiotensin I-Converting Enzyme by Bacillus Licheniformis Alkaline Protease Hydrolyzates Derived from Sardine Muscle. Bioscience, Biotechnology, and Biochemistry 1993, 57, 922–925.
- Ladrat, C.; Verrez-Bagnis, V.; Noël, J.; Fleurence, J. In Vitro Proteolysis of Myofibrillar and Sarcoplasmic Proteins of White Muscle of Sea Bass (Dicentrarchus Labrax L. ): Effects of Cathepsins B, D and L. Food Chemistry 2003, 81, 517–525.
- Wiriyaphan, C.; Chitsomboon, B.; Yongsawadigul, J. Antioxidant Activity of Protein Hydrolysates Derived from Threadfin Bream Surimi Byproducts. Food Chemistry 2012, 132, 104–111.