
ABSTRACT
Effect of high-pressure treatment (300–600 MPa) and flour-to-water ratio (1:1, 1:2, 1:3, and 1:4) on functional, rheological, thermal, and structural properties of whole wheat flour dough were investigated. The particle size distribution, especially Dv90 (90% of the volume distribution), was significantly reduced by the pressure treatment. The damaged starch content increased significantly with the applied pressure and water content. The damaged starch absorbed more water, and subsequently increased the water holding capacity. Thermal transitions and mechanical property of pressure-treated samples were measured by differential scanning calorimetry, and rheometry, respectively. The peak viscosity, hot paste viscosity, and final viscosity decreased significantly with increasing pressure intensity. Hardness increased with the increasing pressure level while stickiness decreased at similar conditions. Fourier-transform infrared spectroscopy showed changes in the amide I region of the wheat protein. The sodium dodecyl sulfate polyacrylamide gel electrophoresis further indicated changes in the protein subunits that occurred after pressurization.
Introduction
Wheat (Triticum aestivum) is one of the major grains in the world with an estimated production of 733 MT in 2014/15.[Citation1] Wheat grain contains three parts: the endosperm containing mostly starch and proteins, the germ composed mostly of lipids and proteins, and the bran containing mostly dietary fiber.[Citation2] Commercially, wheat flour is produced according to its end use/application. For example, bread making white flour differs considerably from the whole wheat flour (WWF), and the difference arises on the selection of wheat cultivar, milling, and chemical composition. The major difference between the two is that the white bread flour is produced only of the endosperm, whereas the WWF includes the germ and bran. Dietary fiber intake from bran/WWF consumption has various health benefits, including prebiotic effects, weight management, type II diabetes, glucose regulation, and risk reduction of coronary heart diseases.[Citation3,Citation4] However, the bran absorbs a significant amount of water to achieve an acceptable dough quality, and additionally, lowers the bread quality by lowering the concentration of gluten and starch in the dough. Therefore, it is anticipated that WWF dough behaves differently from the commercial white wheat flour in their rheological properties and quality performance.
High-pressure (HP) processing is a non-thermal processing technology that has been employed successfully for the gelatinization or modification of starch and a structural change in protein. Effects of HP processing on wheat dough system (gluten, gliadins, glutenin, starch, and wheat bran) have been studied extensively.[Citation5–Citation8] Swelling of starch occurred during HP treatment with retention of granule integrity which led to infer that HP treatment modify starches microstructure and viscoelastic properties differently from the thermal treatment.[Citation9] Application of a moderate pressure level (50–250 MPa/1–4 min) could not gelatinize the wheat starch completely,[Citation10] and it clearly indicated that the gelatinization happened only at, and above, a critical pressure.[Citation8] Such critical pressure depends on the type of starch and its composition, water content, holding time, and many other factors. The amount of water has strong influence on gelatinization of starch, and subsequently, the microstructure of dough. While working with HP treatment (0.1–600 MPa/5 min) of wheat dough at selected moisture contents (33 and 56% w/w), McCann[Citation8] observed a partial or complete loss of starch crystalline structure at a pressure range of 400 to 600 MPa with a moisture content of 56%, whereas the crystallinity did not change for a dough having moisture content of 33%. Aggregation of gluten detected at and above 400 MPa for both moisture contents.
The effect of HP on protein structures is very close to thermal denaturation of proteins. Nevertheless, the underlying mechanisms of pressure treatment on proteins differs from the thermal treatment; the HP treatment occurred with a change of volume that leads to a high packing density of molecules in a reduced volume.[Citation11] HP cannot affect primary and secondary structures of proteins, whereas it can easily disrupt the quaternary and tertiary structures of proteins and increase the reactivity of SH groups.[Citation12,Citation13] HP imparted a weakening effect of gluten at a moderate pressure (200 MPa), but it strengthened when temperature and pressure increased significantly (800 MPa, 60°C) by formation of disulphide bonds in the gluten network.[Citation6,Citation7]
Based on all those facts, it is interesting to examine the effect of HP treatment on the WWF dough, and its subsequent changes in functional, structural, rheological and thermal properties at different flour-to-water (F/W) ratios. It is anticipated that the HP treated WWF dough may impart value-added texture properties throughout their storage, and furthermore, the process could provide an alternative to avoid the use of chemical additives and hydrocolloids in baked goods produced from the low bread making performance cereals. Therefore, the objectives of this work were to study the effect of HP (300–600 MPa) on the particle size distribution (PSD), structural, thermal, and rheological properties of WWF dough at various F/W ratios and to apprehend the relative contribution of starch and protein in the flour matrix under HP processing on dough properties.
Materials and methods
Materials and sample preparation
WWF (13.4% moisture, 12.1% protein and gluten, 7.3% all dry basis; Falling number 520) was procured from Kuwait Flour Mills. WWF doughs were prepared by mixing required amount of flour and water in a Hobart dough mixer (N50; OH, USA) for about 15 min. The F/W (w/w) was maintained at various ratios 1:1, 1:2, 1:3, and 1:4. Dough samples were divided into small batches (20 g), hand molded, and packed in low-density polyethylene bags (Whirl-Pak®, USA), sealed and kept for 1 h at 25 ± 1°C for the hydration before HP treatment. The F/W ratio was selected based on Farinographic water absorption data (F/W = 1/0.7) to develop an optimal dough.
HP treatment
The HP treatment was carried out with the use of a laboratory-scale equipment (QFP 2 L-700 Avure Technologies, OH, USA), a pressure vessel 100 mm in diameter and 254 mm in height. Samples were treated at selected pressures (300–600 MPa) for 10 min. Water was used as the pressure-transmitting medium. The initial temperature of the water was 26°C, which was sharply increased to 38°C due to the adiabatic effect during pressurization of 600 MPa. The compression rate was 4.2 MPa/s while the decompression rate was 40 MPa/s. Pressure, time, and temperature were controlled by a computer program attached to the HP unit. After HP treatment, samples were freeze-dried (FD), ground to powder and stored in sealed container for further use. All the pressure treatments were performed in duplicate.
Physiochemical properties
The moisture, crude fat and crude protein (N × 5.83) contents of WWF and FD WWF (as dry basis) were determined by AACC method.[Citation14] Total starch and damaged starch content were determined enzymatically using the Total Starch Assay Kit (Megazyme, Ireland)[Citation15] and damaged starch (DS) assay kit (Megazyme, Ireland), respectively. The α-amylase activity was measured according to the method described by Perten.[Citation16] All the determinations were carried out in triplicate.
Water holding capacity (WHC), water solubility index (WSI), and sediment volume fraction
The WHC and sediment volume fraction of WWF and FD WWF (with and without pressure treatment) were determined at 25°C following the centrifugal techniques.[Citation17] The WHC was expressed as the volume of water held in mL per g dry matter of sample analyzed. After centrifugation, the total height HT of the sample and the height of the sediment HS were measured and the effective volume fraction, Φ, occupied by the WWF particles was expressed as:
The WSI was calculated as the dry residue weight to original dry sample weight multiplied by 100. All measurements were performed in triplicates.
PSD using light scattering
The particle-size distribution of the HP-treated FD WWF samples were measured by laser light scattering using a Malvern Mastersizer 3000 instrument (Malvern Instruments Ltd., Worcestershire, UK) with Hydro EV Flexible volume wet dispersion. The PSDs, i.e., particle size at 10% (Dv10), 50% (Dv50), and 90% (Dv90) of the volume distribution were calculated from the instrument software. The measurement was carried out in triplicate.
Pasting properties
The pasting profiles of HP-treated FD WWFs were measured in triplicate with a Brabender Micro Visco-Amylo-Graph (Brabender, Duisburg, Germany) as described elsewhere.[Citation18] Viscosity is measured in Brabender units (BU). The peak viscosity (PV), hot paste viscosity (HPV), cold paste viscosity (CPV), and their derivative parameters breakdown viscosity (difference between the PV and the HPV), setback viscosity (difference between the final viscosity and the viscosity attained after the first holding period), pasting temperature and peak time were obtained from the instrument software (Viscograph version 2.3.7).
Extension measurement
The extension tests (extensibility, energy and resistance to maximum extension, Rmax) were conducted on an extensograph (Model 860001, Brabender, Duisburg, Germany) following the AACC method[Citation14].
Texture measurement
The texture measurement of dough was carried out using a TA-XT2 Plus Texture Analyzer (Stable Micro-Systems, Surrey, UK) at 25◦C following the method described by Ahmed and Thomas.[Citation19] From the force versus time plot, the firmness was calculated as the maximum resistance to the penetration of the cylinder at 20 mm depth and is presented as the maximum force. Dough stickiness tests were measured using the SMS/Chen-Hoseney dough stickiness rig (A/DSC) and a 25 mm perspex cylinder probe (P/25P) following our earlier work.[Citation19] The dough stickiness measures the positive maximum force (g); the positive area under the curve (g.s) measures the “work of adhesion.”
Rheological measurement
Oscillatory rheological measurements of control and HP-treated samples at selected F/W ratios were carried out using a Discovery Hybrid Rheometer HR-3 (TA Instruments, New Castle, DE, USA). Samples were placed in a 1500-µm gap between two stainless steel parallel plates (plate diameter 40 mm), and sample edges were covered with a thin layer of silicone oil. Oscillatory shear measurements were performed in the frequency range of 0.1 to 10 HZ in the linear viscoelastic region at 25. Following an initial equilibration of samples for 5 min at 25, ramp heating was carried out at 5/min to an endpoint of 95 at a constant frequency of 1 Hz. All rheological measurements were carried out in duplicate and parameters (elastic modulus [G′] and viscous modulus (G″) and complex viscosity, ƞ*) were obtained directly from the software (TRIOS Software v2.3.1.1477, TA Instruments, New Castle, DE, USA).
Electrophoresis
Wheat proteins (with/without treatment) were extracted according to the method of Li et al.[Citation20] for non-reduced protein fractions with slight modifications. Protein patterns of samples were analyzed by sodium dodecyl sulfate-polyacrylamide get electrophoresis (SDS-PAGE). Samples (15 µg protein) were loaded onto polyacrylamide gels comprising a 12% running gel and a 4% stacking gel and subjected to electrophoresis at a constant current of 15 mA/gel using a Mini Protein III unit (Bio-Rad Laboratories, Inc., Richmond, CA, USA). After electrophoresis, the gel was stained with 0.02% (w/v) Coomassie Blue R-250 in 50% (v/v) methanol and 7.5% (v/v) acetic acid and further destained with 50% (v/v) methanol and 7.5% (v/v) acetic acid.
Fourier transform infrared (FTIR) spectroscopy
The FTIR spectra of the WWF samples were obtained by using a Nicolet iS5 FT-IR Spectrometer (Thermo Scientific, Madison, WI, USA) over a wavelength range of 400–4000 cm−1 equipped with an OMNIC operating system software (Version 9.0, Thermo Scientific, Madison, WI, USA). Powder samples were covered on the surface in contact with attenuated total reflectance (ATR) on a multi-bounce plate of Zn-Se crystal at 25°C. Each spectrum was collected from an average of 32 scans and the results were reported as mean values.
Differential scanning calorimetric (DSC) measurement
Thermal analysis was carried out by DSC (TA Q 2000, TA Instruments, New Castle, DE, USA). The DSC was calibrated with indium and sapphire for temperature and heat capacity calibration. The samples (10–12 mg) were run from –20 to 160°C at a 10°C/min heating/cooling ramp in heating/cooling cycles in a nitrogen atmosphere (flow rate 50 mL/min) to detect thermal transitions. Among tested F/W ratios, only 1:3 produced distinct thermal transitions, and, therefore, the F/W ratio of 1:3 had been used in this work. Instrument software (version 4.5A, TA Instruments, New Castle, DE, USA) was used to calculate thermal properties.
Scanning electron microscopy (SEM)
The microstructure and particle dimension of the HP treated FD wheat flour samples were examined through a SEM (JEOL, JSM-5410LV, Tokyo, Japan). Each sample was coated with gold in a sputter coater (Structure Probe, West Chester, PA) before being scanned and photographed at various magnifications (250×, 1500×, and 4000×). Particle size was measured by the software attached to the instrument which allows for detailed (particle length and breadth) measurements. About 50 particles were selected randomly for the particle size measurement.
Statistical analysis
Results were expressed as mean of triplicate determinations ± standard deviation. Statistical significance was determined using the Minitab Statistical Software (Version 16; Minitab Corp., USA). Differences at p < 0.05 were considered to be significant.
Results and discussion
Physicochemical properties
The protein, crude fat, ash, and crude fiber contents of WWF were 12.16 ± 0.09, 1.65 ± 0.14, 0.62 ± 0.07, and 2.68 ± 0.10%, respectively, and those values remain unchanged after HP-treatment. The total starch content marginally increased from 71.05 ± 0.36 to 71.72 ± 0.12 after HP-treatment at 600 MPa. The DS content increased significantly with intensity of pressure, and increasing F/W ratios from 1:2 to 1:4. The maximum values achieved when the sample was treated at 600 MPa for 10 min (≈10% to 20.5, 22.6, and 28.8 for F/W ratio of 1:2, 1:3, and 1:4, respectively). The mechanism is not clear. However, it is believed that the composition and architecture of starch granules regulate their susceptibility to physical damage as a function of applied pressure. There is a possibility of breakdown of some starch granules during ordering-deordering process during pressure-assisted gelatinization. The increase in DS followed a linear relationship with applied pressure (Eq. [Citation2]).
Since DS is susceptible to attack of α-amylase, and, therefore, the falling number value of WWF dropped significantly from 560 to 341s when the dough was exposed at 600 MPa for 10 min. This value further confirmed increase in starch damage during pressure treatment.
WHC, WSI, and sediment volume fraction
The WHC of WWF increased linearly with the increasing of pressure levels and F/W ratio. The sample containing F/W ratio of 1:4 and pressurized at 600 MPa attained the maximum WHC (about 232%; ). Such a significant increase in WHC has been associated with DS. Furthermore, damaging facilitates swelling of starch granules because of the destruction of the forces which prevent granules from swelling in water.[Citation21] A linear equation can describe the relationship between WHC and DS for selected F/W ratios and pressure level (Eq. [Citation3]).
Table 1. Effect of pressure treatment on functional properties of whole wheat flour at selected F/W ratio.
Additionally, surface area increase caused by reducing the particle size after pressurization could be another reason for a significant increase in WHC. Both F/W ratio and the pressure level significantly influenced the WSI. At F/W ratio of 1:4 and at 600 MPa, the leaching was almost double as compared to the untreated as well as the sample having F/W ratio of 1:1. It indicates that the leaching was pronounced by availability of more water and increased surface area which occurred after HP treatment. The sediment volume fraction (ɸ) provides the particles occupancy after centrifugation, and it mostly estimates the effective volume fraction of the particles. The ɸ value increased with pressure level, whereas F/W ratio had the least effect except for the sample of F/W ratio of 1:4 where a pronounced increase was recorded.
PSD
The PSD of WWF samples are presented in . The control samples exhibited trimodal size distributions which is supported by earlier report.[Citation22] The 90% particle sizes (Dv90) of untreated flour were distributed within the size range of 252–282 μm, whereas the Dv50 and Dv10 were ranged from 28 to 31 and 5 to 6 μm, respectively. HP-treatment significantly reduced the Dv50 and the Dv90 from 31 to 15 μm and 281 to 93, respectively (). The F/W ratio influenced only the Dv90 whereas Dv50 remain unchanged. Such observations are in agreement with earlier report of Guo et al.[Citation23] However, contrary to our observation, those authors reported a dramatic increase in particle size at 600 MPa. It is believed that excessive pressure application could probably weaken the structure of starch gels, and breakdown/damage of those cells occurred, resulting in the decrease of the particle size. Guo et al.[Citation23] observed the starch granules damage at 600 MPa through SEM.
Table 2. Particle size distribution of HP-treated whole wheat flour sample.
Table 3a. Pasting properties of high-pressure processed whole wheat flour (F/W ratio 1:2).
Rheological properties
Pasting properties
To elucidate the effect of pressure treatment, pasting properties of the WWF sample at F/W ratio of 1:2 were evaluated (Table 3). The PV decreased systematically with increasing the pressure intensity, and the abrupt decrease was recorded at above 500 MPa (164 BU at 600 MPa). The peak time and temperature had little effect on the applied pressure, whereas the paste temperature increased at similar conditions. McCann et al.[Citation8] observed a similar result while working with wheat flour containing 56% moisture content, and those authors found that the loss of PV by as much as 70% at 600 MPa. HP-treated WWF had a significant (p < 0.05) decrease in HPV, CPV, BDV, and FV compared to untreated sample. The drop in these parameters could be associated with progress of wheat starch gelatinization. The BDV decreased from 488 to 23 BU, which indicates that pressure-modified gel network is more heat stable compared to control sample.[Citation24] Furthermore, a lower BD and SB values of HP-treated samples indicates stronger starch aggregations and lower retrogradation tendency over the untreated WWF sample. A significant drop in pasting parameters at a pressure level of 600 MPa has been earlier reported by Guo et al.[Citation24] for lotus seed starch.
Extension measurement
The extensibility (E) of the dough decreased significantly after 30 min. A representative data (F/W ratio = 1:1) presented in . The extensibility of the control sample decreased from 132 to 36 mm after a pressure treatment of 600 MPa, and the maximum resistances (Rmax) increased from 375 to 1638 BU at a similar condition. The energy requirement increased with toughening of the dough. It clearly indicates that the viscoelasticity of the dough (mainly gluten network) gradually reduced with pressurization, and exhibits solid-like behavior.
Table 3b. Effect of high-pressure processing on extensograph and textural parameters of whole wheat flour dough.
Texture measurement
The textural hardness increased from 0.99 to 7.34 N, respectively, with increasing pressure. A good linear correlation was established between textural hardness (H) and Rmax (Eq. [Citation4]). The dough stickiness also diminished with increasing pressure (). It has been advocated that the increased hardness of gluten is due to number of disulphide bonds stabilizing the gluten structure in wheat products which further increases with time, temperature, and pressure.[Citation6] Similar observation has been reported by Kieffer et al.
Oscillatory rheological measurement
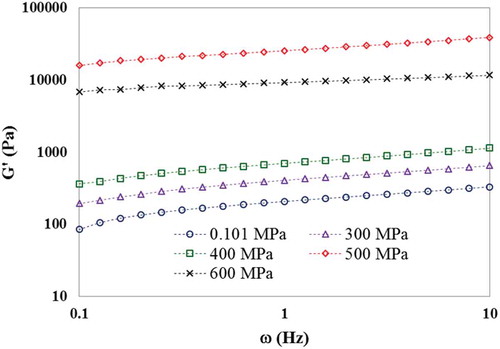
The elastic modulus, G′ of WWF doughs (F/W = 1:1; untreated and HP-treated) as a function of frequency is illustrated in . The G′ increased with the intensity of pressure, in particular, at and above 500 MPa, where the increase was more pronounced than the untreated sample. Similar increment in G′ was reported between 450 and 600 MPa for wheat and tapioca starches.[Citation25] It indicates that a critical level of pressure is required for a complete gelatinization of starch and structure development The increase in solid-like characteristic (G′ > G″) with pressure intensity was evident from the decrease of the slope of the equation G′ versus ω. The slope dropped from 0.25 to 0.10 when the pressure was increased from 0.1 to 600 MPa. It can be argued that the abrupt increase in the mechanical rigidity at and above 500 MPa could be attributed to a combined effect of incomplete starch gelatinization and protein aggregation. Similar increase in mechanical rigidity of gluten protein under HP has been reported.[Citation7] McCann et al.[Citation8] advocated that the pressure treatment in the range of 500 to 600 MPa of wheat flour dough produced shorter protein strands with discontinuous gluten protein networks. Furthermore, they could not form a cohesive network due to extensive protein aggression produced by HP. At above 500 MPa, the material started to undergo stress on structure, and subsequently a drop in the mechanical rigidity.
Figure 1a. Effect of pressure on mechanical rigidity of whole wheat flour dough (F/W ratio 1:1) at 25°C.
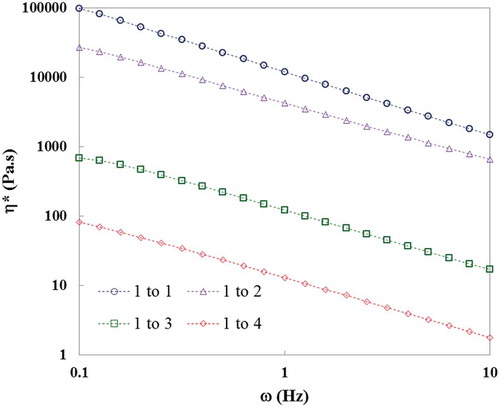
The frequency sweep of WWF dough pressurized at 500 MPa at selected F/W ratios is illustrated in . Untreated sample with F/W ratio of 1:4 was not fit for the rheological measurement because of its dilution. However, after pressurization, the sample (sol) transformed to gel, and the complex viscosity increased significantly. It can be seen that the gel strength is a function of F/W ratio, and at the highest concentration (F/W ratio of 1:1) the gel strength attained its peak value. A higher η* value at higher concentrations (F/W ratios 1:1 or 1:2) indicates an increase in molecular interactions and a strengthening of structure with increasing pressure. A similar observation has been reported by Alvarez et al.[Citation26] on HP treatment of chickpea flour dough.
Figure 1b. Effect of flour-to-water (F/W) ratio on viscoelastic behavior of WWF dough at 500 MPa and measured at 25°C.
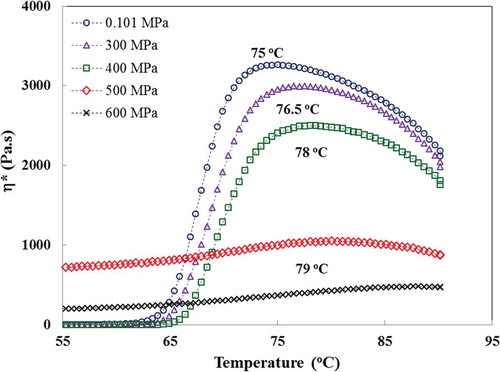
Non-isothermal heating patterns of WWF dough are illustrated in . At the beginning of heating (25 to 55), the η* did not change much, whereas a sharp increase in the η* occurred thereafter, due to swelling of starch granules and initiation of starch gelatinization. Finally, it achieved the peak value of η* at a temperature known as the peak gelatinization temperature (Tp). Starch gelatinization involves granule swelling and release of starch material that results in the increasing viscosity. After HP-treatment, the Tp value shifted to a higher magnitude until the gelatinization is completed. At 600 MPa, no gelatinization peak was detected due to complete gelatinization of starch, and the rheogram was almost flat. This observation is supported by the DSC measurement. Furthermore, these Tp values can be compared with the peak temperature recorded from the microviscoamylograph. However, the F/W ratio used for both measurements was different, and therefore, the values showed a significant difference between the peak values obtained from two independent measurement (87–91◦C, VAG over 75–79, RM).
Figure 1c. Temperature ramp on pressure treated wheat flour dough (F/W ratio 1:2) at the heating rate of 5°C/min.
Structural properties
SDS-PAGE
A significant differences in the band intensity between the high molecular weight (≥55 KDa) and the low molecular weight (≤45 KDa) gluten-subunits were observed with the pressure intensity (). This could be due to modification of covalent bonds, i.e., disulphide bonds and non-covalent bonds at 600 MPa, which evolved denaturation, aggregation, and gelation of proteins.[Citation27] Furthermore, Apichartsrangkoon et al.[Citation6] reported that the pressure treated gluten is less soluble in SDS due to loss of protein bands at 600 and 800 MPa.
Figure 2a. SDS-PAGE profile of wheat flour sample as affected by pressure treatment.
FTIR
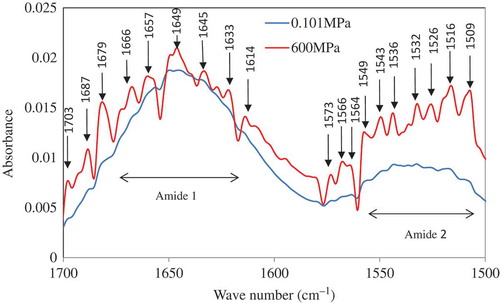
FTIR spectra of wheat protein showed two absorption bands: amide I (1600–1700 cm−1) and amide II (1500–1600 cm−1). These bands originated from stretching vibrations of the C=O bond and bending vibrations of the N–H bond, respectively.[Citation28] The amide I band is the sum of overlapping components bands including α-helices (1660–1648 cm−1), α-helices turn (1630 cm−1), β-sheets (1641–1612 cm−1, 1640–1626 cm−1, 1697–1670 cm−1), β-turns (1684–1662 cm−1), and randomly coiled (1650–1640 cm−1) conformations. After HP-treatment, significant structural conversion and reorganization occurred especially for the sample treated at 600 MPa (). Discrete valleys were observed in the amide I region of the protein, at 1681–1687 cm−1 (β-sheets), 1675 cm−1 (β-sheets), 1659–1666 cm−1 (turns), 1645–1659 cm−1 (α-helices), 1654 cm−1 (α-helices), 1645–1649 cm−1 (random coils), and 1633 cm−1 (β-sheets). Shifts of intensity (increase in depth of valleys) between high frequency bands (1681–1654 cm−1) and low frequency bands (1645–1649 cm−1) might be attributed to pressure-assisted changes in the hydrogen bonding patterns.
Figure 2b. A comparison of FTIR spectra between untreated and pressure treated whole wheat flour sample.
Thermal properties
Thermal scanning of WWF samples (F/W 1:3) exhibited two endothermic peaks: Tp1: (63–66◦C), and Tp2 (107–117◦C). The Tp1 ascribes the gelatinization of starch, whereas the Tp2 could be the fusion of amylose-lipid complexes formed in the course of the starch gelatinization[Citation29] or due to protein denaturation as indicated by Ahmed et al.[Citation30] The Tp1 decreased marginally from 66.3 to 63 when the pressure was increased from 0.1 to 500 MPa. The associated enthalpy decreased with pressure intensity (5.5 to 0.16 J/g). The wheat starch was gelatinized completely at 600 MPa. The Tp2 reduced from 117 to 106 after the pressure treatment.
SEM
The SEM of control and pressurized samples indicate that continuous structure of starch granules are embedded in the matrix structure of proteins (). Starch granule shapes could be visualized in two distinct structures: ones with lenticular/disc shape and the others smaller with spherical shape, which is in agreement with previous reports on two populations of A- and B-type of starch granules.[Citation31] Untreated samples showed smooth surfaces of granules, which became rough, and the disc shape of starch granules was converted to irregular shape above 400 MPa. However the continuous matrix became disaggregated and the starch granules were clearly identified as individual structure. At 600 Mpa, large cavities were detected in the sample. The increase in cavity size demonstrated that a HP-treatment might have destroyed the integrity of starch granules and produced homogeneous channels between starch granules and other connection parts.
Figure 3. SEM micrographs of whole wheat flour samples (F/W ratio 1:2): A and B: Control; C: 400 MPa; D: 500 MPa; E and F: 600 MPa.
Conclusion
HP-treatment of WWF was significantly influenced by the F/W ratio, and the intensity of pressure applied. It clearly demonstrates that a critical pressure level of 500 MPa is required to observe significant changes in functional, thermal and structural properties of wheat flour dough. HP-treatment accelerates DS and reduces the particle size significantly. Rheometric, thermal, and texture data of the pressure-treated dough are complementary to each other. The collapse of the structure was visualized by the microscopic observation. The change in protein bands and microstructure of wheat flour was supported by the electrophoretic pattern and the FTIR spectroscopy. Overall, HP treatment of WWF is a complex process where both starch and protein play important roles in the breaking and developing of structure. In future studies, the HP process could be extended by incorporating temperature to elucidate more structural modification of wheat flour dough at lower pressure. The pressure treated flour could be incorporated to other ingredients to develop functional foods.
References
- FAO Cereal Supply and Demand Brief. http://www.fao.org/worldfoodsituation/csdb/en/(assessed on November 22, 2015).
- Marquart, L.; Jacobs JrD.R, .; McIntosh, G.H.; Poutanen, K.; Reicks, M. Whole Grains and Health; John Wiley and Sons, Blackwell Publishing Professional, Ames, Iowa, USA, 2008.
- Kendall, C.W.; Esfahani, A.; Jenkins, D.J. The Link Between Dietary Fibre and Human Health. Food Hydrocolloids 2010, 24, 42–48.
- Okarter, N.; Liu, R.H. Health Benefits of Whole Grain Phytochemicals. Critical Reviews in Food Science and Nutrition 2010, 50, 193–208.
- Douzals, J.P.; Marechal, P.A.; Coquille, J.C.; Gervais, P. Microscopic Study of Starch Gelatinization Under High Hydrostatic Pressure. Journal of Agricultural and Food Chemistry 1996, 44, 1403–1408.
- Apichartsrangkoon, A.; Ledward, D.A.; Bell, A.E.; Brennan, J.G. Physicochemical Properties of High Pressure Treated Wheat Gluten. Food Chemistry 1998, 63, 215–220.
- Kieffer, R.; Schurer, F.; Köhler, P.; Wieser, H. Effect of Hydrostatic Pressure and Temperature on the Chemical and Functional Properties of Wheat Gluten: Studies on Gluten, Gliadin and Glutenin. Journal of Cereal Science 2007, 45, 285–292.
- McCann, T.H.; Leder, A.; Buckow, R.; Day, L. Modification of Structure and Mixing Properties of Wheat Flour Through High-Pressure Processing. Food Research International 2013, 53, 352–361.
- Stolt, M.; Oinonen, S.; Autio, K. Effect of High Pressure on the Physical Properties of Barley Starch. Innovative Food Science & Emerging Technologies 2000, 1, 167–175.
- Bárcenas, M.E.; Altamirano-Fortoul, R.; Rosell, C.M. Effect of High Pressure Processing on Wheat Dough and Bread Characteristics. LWT–Food Science and Technology 2010, 43, 12–19.
- Knorr, D.; Heinz, V.; Buckow, R. High Pressure Application for Food Biopolymers. Biochimica et Biophysica Acta (BBA)-Proteins and Proteomics 2006, 1764, 619–631.
- Boonyaratanakornkit, B.B.; Park, C.B.; Clark, D.S. Pressure Effects on Intra- and Intermolecular Interactions Within Proteins. Biochimica et Biophysica Acta (BBA)-Protein Structure and Molecular Enzymology 2002, 1595, 235–249.
- Rivalain, N.; Roquain, J.; Demazeau, G. Development of High Hydrostatic Pressure in Biosciences: Pressure Effect on Biological Structures and Potential Applications in Biotechnologies. Biotechnology Advances 2010, 28, 659–672.
- AACC. Approved Methods of the AACC, 10th Ed; American Association of Cereal Chemists: St. Paul, MN, 2000; Methods 08-01, 30-25, 44-15A, 46-10, 54-10, 54–21.
- AOAC International. Official Methods of Analysis of AOAC International, 17th Ed; AOAC International: Washington, DC, 2000.
- Perten, H. Application of the Falling Number Method for Evaluating Alpha-Amylase Activity. Cereal Chemistry 1964, 41, 127–140.
- McConnell, A.A.; Eastwood, M.A.; Mitchell, W.D. Physical Characteristics of Vegetable Foodstuffs That Could Influence Bowel Function. Journal of the Science of Food and Agriculture 1974, 25, 1457–1464.
- Ahmed, J.; Al-Jassar, S.; Thomas, L.A. Comparison in Rheological, Thermal, and Structural Properties Between Indian Basmati and Egyptian Giza Rice Flour Dispersions As Influenced by Particle Size. Food Hydrocolloids 2015, 48, 72–83.
- Ahmed, J.; Thomas, L. Effect of β-Glucan Concentrate on the Water Uptake, Rheological and Textural Properties of Wheat Flour Dough. International Journal of Food Properties 2015, 18, 1801–1816.
- Li, M.; Zhu, K.X.; Wang, B.W.; Guo, X.N.; Peng, W.; Zhou, H.M. Evaluation the Quality Characteristics of Wheat Flour and Shelf-Life of Fresh Noodles As Affected by Ozone Treatment. Food Chemistry 2012, 135, 2163–2169.
- Tester, R.F. Properties of Damaged Starch Granules: Composition and Swelling Properties of Maize, Rice, Pea and Potato Starch Fractions in Water at Various Temperatures. Food Hydrocolloids 1997, 11, 293–301.
- Kim, W.; Qin, Y. Effect of Heating Temperature on the Particle Size Distribution in Waxy Wheat Flour. Journal of Cereal Sciences 2014, 59, 228–233.
- Guo, Z.; Zeng, S.; Lu, X.; Zhou, M.; Zheng, M.; Zheng, B. Structural and Physicochemical Properties of Lotus Seed Starch Treated with Ultra-High Pressure. Food Chemistry 2015, 186, 223–230.
- Karim, A.A.; Norziah, M.H.; Seow, C.C. Methods for the Study of Starch Retrogradation. Food Chemistry 2000, 71, 9–36.
- Bauer, B.A.; Knorr, D. The impact of pressure, temperature and treatment time on starches: pressure-induced starch gelatinisation as pressure time temperature indicator for high hydrostatic pressure processing. Journal of Food Engineering 2005, 68, 329–334.
- Alvarez, M.D.; Fuentes, R.; Olivares, M.D.; Cuesta, F.J.; Canet, W. Thermorheological Characteristics of Chickpea Flour Slurry As Affected by Moisture Content. Journal of Food Engineering 2014, 136, 9–18.
- Hendrickx, M.; Ludikhuyze, L.; Van den Broeck, I.; Weemaes, C. Effects of High Pressure on Enzymes Related to Food Quality. Trends in Food Science and Technology 1998, 9, 197–203.
- Byler, D.M.; Susi, H. Examination of the Secondary Structure of Proteins by Deconvolved FTIR Spectra. Biopolymers 1986, 25, 469–487.
- Eliasson, A.C. Interactions Between Starch and Lipids Studied by DSC. Thermochimica Acta 1994, 246, 343–356.
- Ahmed, J.; Ramaswamy, H.S.; Ayad, A.; Alli, I.; Alvarez, P. Effect of High-Pressure Treatment on Rheological, Thermal and Structural Changes in Basmati Rice Flour Slurry. Journal of Cereal Science 2007, 46, 148–156.
- Angold, R. Wheat Starch (Structural Aspects). In Bread; Social, Nutritional & Agricultural Aspects of Wheaten Bread; Spicer, A.; Ed., Elsevier Applied Science Publishers Limited: London, UK, 1975.