
ABSTRACT
The aim of this study was to quantify free fatty acid in cottonseed oil (Gossypium) variety by a chemometric approach using Fourier transform infrared spectroscopy. Calibration standards were prepared by gravimetrical mixing of oleic acid (0.1–40 g/100 g) in neutralized cottonseed oil containing <0.1% free fatty acids. Fourier transform infrared technique coupled with partial least square and principle component regression models were used to develop calibrations in the specific absorption region of carbonyl between 1690–1727 cm−1. On the basis of regression coefficient and evaluated free fatty acids results with comparison to titration method, partial least square was found to be more accurate than principle component regression calibration model. All the analyzed cottonseed oil varieties showed high content of free fatty acids in the range of 17.1–38.5%. The results of the present study indicated that Fourier transform infrared method in combination with partial least square or principle component regression could be used as a greener alternative to the standard titration method.
Introduction
Cotton is an important fiber crop of global significance grown in tropical and sub-tropical regions of more than 80 countries.[Citation1] Cultivation of cotton differs markedly from one country to another, depending on the degree of mechanization and seed varieties.[Citation2] Current estimates for world production are about 25 million tons per anum, accounting to 2.5% of the world’s arable land. Hence, the Republic of Pakistan, the United States, India, China, and Uzbekistan are the largest producers of cotton.[Citation3] Cotton is Pakistan’s main industrial crop grown on 15% of the country’s arable land. Pakistan is the fourth largest producer and third largest consumer of cotton, in addition to this largest exporter of cotton yarn in the world.
There are many cottonseed varieties in the world. It has been reported that there are two genetically distinct groups of cottonseed available, known as American and the Asiatic cotton.[Citation4] Cottonseed is a by-product of cotton and difficult to process due to its unique seed structure and high content of natural pigment. Cottonseed yields approximately 16% oil, and generally consists of 70% unsaturated fatty acids (18% monounsaturated, and 52% polyunsaturated), 26% saturated fatty acids, and 4% glycerol, although the quantity of the fatty acids in cottonseed oil vary over wide ranges.[Citation5]
Cottonseed deteriorates upon storage, with the result that the content of free fatty acids (FFAs) in the seed oil increased and the color of the oil in the seeds darkened. This increase in FFAs content is reflected in a higher refining loss during the processing of the crude oil and the darkened color of the oil reduces its desirability as an edible product.
FFA content is one of the most frequently determined quality indices during edible oil production, storage, and marketing. It is a measure of the extent to which hydrolysis has liberated fatty acids from their ester linkage with the parent triglyceride molecule.[Citation6] Edible oils undergo various processing steps to reduce FFA content.[Citation7] In general, FFAs are determined by the titration method. Although the titration method is sensitive, it involves toxic chemicals; furthermore, there are some chances of errors in determination of the end-point of dark colored or crude oils.[Citation8] To avoid these common problems, number of instrumental methodologies have been developed in the last few decades such as colorimetric,[Citation9] voltammetric,[Citation10] flow injection,[Citation11] gas and liquid chromatography,[Citation12,Citation13] and infrared spectroscopic.[Citation14] Compared to other instrumental techniques, infrared spectroscopy was found to be rapid, non-destructive, and an easy technique.
In the field of lipid chemistry, infrared spectroscopy with chemometric approach has been successfully applied for the determination of various parameters of oils and fats such as peroxide,[Citation15] trans fatty acids,[Citation16] adulteration,[Citation17] fatty acid composition,[Citation15,Citation18] fatty acid ratio,[Citation19,Citation20] classification and authentication,[Citation21] conjugated diene and triene,[Citation22] tocopherols,[Citation23] and FFAs.[Citation24,Citation25] The objective of this study was to quantify FFA content in crude oil present in different cottonseed varieties available in Pakistan by using single bounce-attenuated total reflection (SB-ATR) Fourier transform infrared (FTIR) spectroscopy with chemometric approach.
Material and methods
Reagents and samples
All reagents used were of analytical grade. Oleic acid (99%) and sodium hydroxide were purchased from Fluka Chemie GmbH (Buchs, Switzerland). Hexane and ethanol were obtained from Merck (Darmstadt, Germany). Seeds (~3 Kg) of cotton plants of various gossypium species were collected from Cotton Research Institutes of Agricultural Department, Tandojam, Hyderabad, Pakistan.
Moisture determination
Roughly 10 g of cottonseed was weighed in a tared Petri dish, placed in an oven, and dried at 105°C for 3 h. The Petri dish was removed from the oven and covered immediately. It was then cooled in a desiccator for 30 min containing efficient desiccant and weighed as reported in standard method.[Citation25]
Oil extraction
About 20 g of ground seed was soaked in 200 mL of n-hexane at 70°C, oil was extracted by Soxhlet apparatus following the American Oil Chemists Society (AOCS) method.[Citation25] For quantitative determination of oil from the seeds of various cottonseed species, the fixed oil was pooled and concentrated in a rotary evaporator (Buchi Rota vapor-RE 111), then placed in a vacuum oven at 105°C for 15 min, cooled in a desiccator, and refrigerated until further analysis.
FFAs content
FFAs content of the cottonseed oil was determined by standard titrimetric method following the AOCS method.[Citation25]
Preparation of FTIR calibration standards
A set of 10 calibration standards covering a FFAs range of 0.1 to 40 g/100 g were prepared by gravimetric addition of oleic acid to neutralized cottonseed oil containing <0.1% FFAs. Infrared spectra were acquired using a Thermo Nicolet 330 FTIR spectrometer (Thermo Nicolet Analytical Instruments, Madison, WI) equipped with a deuteratedtriglycine sulfate (DTGS) detector. An SB-ATR accessory with a removable ZnSe crystal was mounted in the sample compartment. The FTIR controlled by OMNIC software (version 7.2) and dataset was collected between 4000 and 650 cm−1 by co-addition of 32 scans at a resolution of 4 cm−1. The fresh background spectrum from the bare ATR crystal was recorded and subtracted from each standard or sample spectrum. The ATR crystal was carefully cleaned with n-hexane followed by acetone to remove any residues of previous samples.
Chemometric analysis
Chemometric analysis such as partial least squares (PLS) and principal component regression (PCR) were carried out using Turbo Quant (TQ) analyst 7.2 software package from Nicolet (Madison, WI, USA). The spectra of standard FFAs calibrations in combination with reference FFAs values were incorporated in the software to develop PLS and PCR calibrations in the range of 1727 to 1690 cm−1. To assess the capability of the models to fit the calibration data and to calculate the deviation of the models, root mean square error of calibration (RMSEC), root mean square error of cross-validation (RMSECV), and root mean square error of prediction (RMSEP) were used as previously described.[Citation22]
Results and discussion
Moisture and oil content
The low moisture content in any vegetable oil is beneficial in terms of storage stability and can be preserved for a longer periods. In the present study, the moisture content in all cottonseed varieties was determined in the range of 6.27–8.55%. The cottonseed varieties contain total oil content in the range of 12.01–14.55% with an average of 13.34%.
Quantification and classification using FTIR spectroscopy
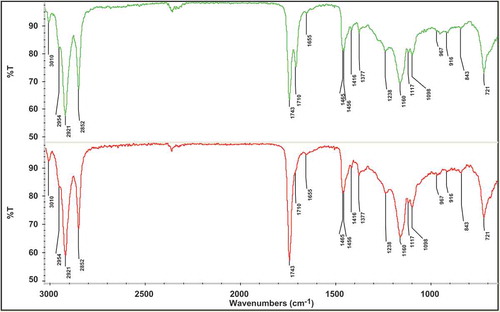
provides an idea about FTIR normal spectra of two cottonseed oils (low and high FFAs), arising from the absorption of functional groups present in the oils. The assignment of each peak and shoulder is given in the as reported earlier.[Citation27,Citation28] It can be seen that both cottonseed oil spectra are quite comparable and the spectral features can be correlated with the main components of edible oils specially triacylglycerol. On the other hand, there was a considerable difference between both spectra in terms of peak intensity, in particular at frequency of 1710 cm−1. For infrared quantification of FFAs, this peak is important and demonstrates the carbonyl region. For the determination of FFAs two models PLS and PCR were developed to calculate the level of FFAs in different cottonseed varieties. Generally TQ analyst software automatically selects the frequency regions (if the region of interest is unknown) for quantitation of different parameters of oil and fat; furthermore, the confirmation is made by observing the variations occur between the spectra. In the present study, the absorption of a FFAs band at 1710 cm−1 in the range of 1727–1690 cm−1 corresponding to carbonyl region of FFA was selected for the calibration purpose. Calibration standards were prepared in the range of 0.1–40 g/100 g to cover the wide range of FFAs.
Table 1. FTIR spectral regions of cottonseed oil.
Figure 1. FTIR spectra of cottonseed oil. A: containing high FFAs; and B: containing low FFAs.
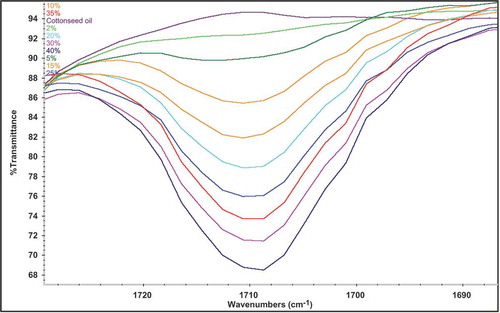
Multivariate calibration is different from univariate calibration in experimental data. The experimental data in univariate calibration consists of one variable rather than several variables in multivariate calibration. PLS and PCR are the most common multivariate used in chemometrics. In this study both PLS and PCR models were used to generate calibration. For the PLS and PCR models out of ten calibration standards, three of them were used as a validation points and seven used as a calibration points in both models (selected randomly by TQ software). In and , the x-axis shows the actual standard values (prepared) calibration standards and y-axis shows the calculated values (FTIR) predicted ones in the calibration and validation sets. shows the expanded form of calibration standards in the range of 1727–1690 cm−1. shows the quality parameters of developed PLS and PCR models which include R2, RMSEC, RMSEP, and performance index (PI). In both models, same spectral regions 1727–1690 cm−1 were selected, while slight change in the baseline type of PCR model was used. The baseline type selected for PCR model was two points with a fixed location point in order to get best values for R2. The factors used in the PLS model were automatically selected by the TQ software when method calibrated. The selection of factors from PLS model was based on the minimum predicted residual error of sum of squares (PRESS) value. Similarly, in the PCR model, three principle components (PCs) were selected by the TQ software. Both models represented higher R2 values (close to 1), in comparison PLS model showed superiority over PCR model in terms of lower RMSEC and RMSEP. The overall performance of both models was evaluated in terms of PI by the TQ software. It was observed that PLS model for FFAs determination showed higher PI in comparison to PCR model 98.9 versus 97.2.
Table 2. Prediction capabilities of PLS-FTIR and PCR-FTIR measurement model for the determination of FFA.
Figure 2. Plot of actual FFAs versus predicted FFAs by FTIR A: PLS model; and B: PCR model.
Figure 3. Oleic acid spiked group spectra of calibration standards.
presents results of FFAs in different cottonseed oil varieties as determined by AOCS titrimetric method and developed FTIR method based on the PLS and PCR approaches. All of the cottonseed varieties contained elevated levels of FFAs ranging from 17.1 to 38.5% on the basis of PLS results. The possible reason of higher FFAs in the oil is the deterioration of cottonseed upon the storage conditions, which results in the higher contents of FFAs in the seed oils. The PLS model showed comparable results to the titration method with small percentage relative difference as compared to PCR model results. It can be assumed that FTIR combined with chemometric especially PLS model offers the reliable and accurate alternate for the analysis of FFAs.
Table 3. FFAs content of cottonseed oil by titrimetric and FTIR (PLS and PCR).
Conclusion
The FTIR spectroscopic procedure has advantage over standard AOCS titrimetric method in terms of simplicity and speed of analysis for the quantification of FFAs in cottonseed oil. In the current study, the PLS and PCR models were applied to quantify FFAs, comparatively, the PLS model showed better results over the PCR model. The cottonseed varieties were stored for 7 months for the distribution to growers for germination, therefore, all cottonseed varieties showed higher FFA contents (>17%) in the extracted oils.
Conflict of interest
The authors declare that there are no conflicts of interest. Furthermore, the article does not contain any studies with human or animal subjects
References
- Agarwal, D.K.; Singh, C.P.; Shaikh, M.A.J.; Gayal, S.G. Cottonseed Oil Quality Utilization and Processing. Central Institute of Cotton Research and Technology Bulletin, 2003, 25, 1–16.
- Kohel, R.J.; Lewis, C.F. Cotton. American Society of Agronomy. Crop Society of America, Soil Science Society of America: Madison, WI, 1984.
- Wake, P.J.; Lynin, K.-O. Encyclopedia of Chemical Technology. John Wiley & Son: New York, NY, 2002.
- O’Brien, R.D.; Jones, L. A.; King, C.C.; Wakelyn, P.J.; Wan, P. J. Cottonseed Oil. In Bailey’s Industrial Oil and Fat Products, 6th Edition. Volume 2: Edible Oil and Fat Products: Edible Oils; Shahidi, F., Eds., Wiley, 2005, 279–280.
- O’Brien, R.D. Cottonseed Oil. In Vegetable Oils in Food Technology: Composition, Properties, and Uses; Gunstone, F.D.; Eds.; CRC Press: Taylor and Francis, 2002; 217–223.
- Bollworm, A.P. Eradication National Cotton Council Aug. Inform 2000, 820–839.
- Gregory, S.R.; Hernandez, E.; Savoy, B.R.; Smith, C.W.; Cothren, J.T. Cottonseed Processing, Cotton Origin History, Technology and Production. John Wiley & Sons: New York, NY, 1999; 793–823.
- Bland, J.M.; Conkerton, E.J.; Abraham, G. Triacylglyceride Composition of Cottonseed Oil by HPLC and GC. Journal of the American Oil Chemists’ Society 1991, 68, 840–843.
- Lowry, R.R.; Tinsley, I.J. Rapid Colorimetric Determination of Free Fatty Acids. Journal of the American Oil Chemists’ Society 1976, 53, 470–472.
- Takamura, K.; Fuse, T.; Arai, K.; Kusu, F.A. Review of a New Voltammetric Method for Determining Acids. Journal of Electroanalytical Chemistry 1999, 468, 53–63.
- Mariotti, E.; Mascini, M. Determination of Extra Virgin Olive Oil Acidity by FIA-Titration. Food Chemistry 2001, 73, 235–238.
- Hopia, A. Analysis of High Molecular Weight Autoxidation Products Using High Performance Size Exclusion Chromatography: II. Changes During Processing. LWT–Food Science and Technology 1993, 26, 568–571.
- Procida, G.; Ceccon, L. Gas Chromatographic Determination of Free Fatty Acids in Olive Mill Waste Waters. Analytica Chimica Acta 2006, 561, 103–106.
- Sherazi, S.T.H.; Mahesar, S.A.; Bhanger, M.I.; Van de Voort, F.R.; Sedman, J. Rapid Determination of Free Fatty Acids in Poultry Feed Lipid Extracts by SB-ATR FTIR Spectroscopy. Journal of Agricultural and Food Chemistry 2007, 55, 4928–4932.
- Maggio, R.M.; Kaufman, T.S.; Del, M.C.; Cerretani, L.; Bendini, A.; Cichelli, A.; Compagnone, D. Monitoring of Fatty Acid Composition in Virgin Olive Oil by Fourier Transform Infrared Spectroscopy Coupled with Partial Least Squares. Food Chemistry 2009, 114, 1549–1554.
- Sherazi, S.T.H.; Kandhro, A.; Mahesar, S.A.; Bhanger, M.I.; Talpur, M.Y.; Arain, S. Application of Transmission FT-IR Spectroscopy for the Trans-Fat Determination in the Industrially Processed Edible Oils. Food Chemistry 2009, 114, 323–327.
- Rohman, A.; Cheman, Y.B. The Use of Fourier Transform Mid Infrared (FT-MIR) Spectroscopy for Detection and Quantification of Adulteration in Virgin Coconut Oil. Food Chemistry 2011, 129, 583–588.
- Sherazi, S.T.H.; Talpur, M.Y.; Mahesar, S.A.; Kandhro, A.A.; Arain, S. Main Fatty Acid Classes in Vegetable Oils by SB-ATR Fourier Transform Infrared (FTIR) Spectroscopy. Talanta 2009, 80, 600–606.
- Mahesar, S.A.; Sherazi, S.T.H.; Kandhro, A.A.; Bhanger, M.I.; Khaskheli, A.R.; Talpur, M.Y. Evaluation of Important Fatty Acid Ratios in Poultry Feed Lipids by ATRFTIR. Vibrational Spectroscopy 2011, 57, 177–181.
- Talpur, M.Y.; Sherazi, S.T.H.; Mahesar, S.A.; Naz, S.; Kara, H. Impact of Frying on Key Fatty Acid Ratios of Canola Oil. European Journal of Lipid Science and Technology 2012, 114, 222–228.
- De Luca, M.; Terouzi, W.; Ioele, G.; Kzaiber, F.; Oussama, A.; Oliverio, F.; Tauler, R.; Ragno, G. Derivative FTIR Spectroscopy for Cluster Analysis and Classification of Morocco Olive Oils. Food Chemistry 2011, 124, 1113–1118.
- Mahesar, S.A.; Bendini, A.; Cerretani, L.; Bonoli, C.M.; Sherazi, S.T.H. Application of a Spectroscopic Method to Estimate the Olive Oil Oxidative Status. European Journal of Lipid Science and Technology 2010, 112, 1356–1362.
- Cheman, Y.B.; Ammawath, W.; Mirghani, M.E.S. Determining α-Tocopherol in Refined Bleached and Deodorized Palm Olein by Fourier Transform Infrared Spectroscopy. Food Chemistry 2005, 90, 323–327.
- Xiaobin, D.; Qinghua, L.; Daijun, S.; Xiumei, C.; Xiuzhu, Y. Direct FTIR Analysis of Free Fatty Acids in Ddible Oils Using Disposable Polyethylene Films. Food Analytical Methods 2015, 8, 857–863.
- Mahesar, S.A.; Sherazi, S.T.H.; Khaskheli, A.R.; Kandhro, A.A.; Sirajuddin. Analytical Approach for Free Fatty Acids Assessment in Oils and Fats. Analytical Methods 2014, 6, 4956–4963.
- Firestone, D. Official Methods and Recommended Practices of the American Oil Chemists Society. AOCS Press: Champaign, IL, 1989.
- Guillen, M.D.; Cabo, N. Relationships Between the Composition of Edible Oils and Lard and the Ratio of the Absorbance of Specific Bands of Their Fourier Transform Infrared Spectra and Role of Some Bands of the Fingerprint Region. Journal of Agricultural and Food Chemistry 1998, 46, 1788–1793.
- Silverstein, R.M.; Bassler, G.C.; Morrill, T.C. Spectrometric Identification of Organic Compounds. John Wiley & Sons: Chichester, UK, 1981.