
ABSTRACT
The present study aims at assessing a non-destructive optical method for determining the internal quality of mulberry juice. First, UV-IR spectra (300–1100 nm) were acquired for each sample with a spectral resolution of 2 nm. Then the calibration set, composed of 70 and 38 samples, was used as the validation set. Next, two types of pre-processing multiplicative scatter correction)MSC(and standard normal variate)SNV(were used before analysing the data with multivariate calibration methods of PLS and GA-PLS. The following results were obtained including the correlation coefficient (r) of 0.94, 0.89, 0.98, and 0.95 and root mean square error of validation (RMSEV) 1.31°Brix, 0.52, 0.014, and 0.014 for total soluble solid (TSS), titratable acidity (TA), ascorbic acid (AA), and total anthocyanin content (AC) of mulberry juice, respectively. After that, GA-PLS was applied to select the efficient spectral regions. Model using 31 variables and 15 factors presented and yielded the best prediction results. The best combinations of 21 spectral intervals among 40 intervals selected by GA-PLS also yielded good results with RMSEV = 0.03096, r = 0.96; RMSEV = 0.062, r = 0.98, RMSEV = 0.041, r = 0.98; RMSEV = 0.0006, r = 0.96 for TSS, AA, TA, and AC of mulberry juice, respectively. Finally, it was concluded that using the UV-IR measurement technique, spectral range (300–1100 nm), it was possible to assess the quality characteristics of mulberry juice.
Introduction
Horticultural plants have high intra and inter diversity and are very important for human diet as sources of vitamins, minerals, and dietary fibre. They become a significant part of human life moreover due to their medicinal and environmental uses as well as aesthetics and economic values. The stem, leaf, flowers, roots, and the fruits of vegetables and fruit crops have the highest potential of export.[Citation1–Citation4] Among tropical and subtropical fruit species, mulberry (Morus spp.) belongs to the genus Morus and the Moraceae family which is widely distributed in East, West and South East Asia, South Europe, South of North America, Northwest of South America, and some parts of Africa. Today, due to the nutrient value, the mulberry fruits are usually eaten both fresh and also utilized in various forms such as syrup, jam, pulp, ice-cream, and vinegar.[Citation5] Recent researches have revealed that mulberry fruits produce positive effects on human diet and health due to the help of its compounds such as the presence of fats and significant variation of fatty acids, ascorbic acid, minerals, phenols, and flavonoids,[Citation6] some organic acids,[Citation7] and anthocyanin content.[Citation8] However, the most important property of mulberry fruit for its pharmaceutical value is its antioxidant capacity.[Citation9] Ozgen et al.[Citation10] stated that mulberry fruit had essential effects in human health because of its antioxidant contents, and the acidity and sugar content are the other important internal attributes of mulberry fruit as well.
Evaluation of internal quality attributes of the agricultural products is one of most important operations in fruit post-harvest management. The evaluation method for assessment of nutritional material quality of fruit during ripening has to be simple, accurate, quick, and also non-destructive. One of that techniques is near-infrared (NIR) spectroscopy. During the last 40 years, NIR spectroscopy has been used in agricultural and other industries because it is a fast, low-cost, and non-destructive analytical technique. This method also does not need any sample preparation.[Citation11]
In food industry, some of the internal chemical parameters were applied to evaluate quality and analysis, such as ethanol, water, sugars, organic acids, phenolic compounds, and oxidation.[Citation12] Furthermore, spectroscopy can be applied in quality measurement using different wavelength regions, including Visible (Vis: 350–750 nm), Near-Infrared (NIR: 750–2500 nm), Full Range (FR: 350–2500 nm), and Mid-Infrared (MIR: 2500–25,000 nm). Among them, the application of visible and shortwave NIR (350–1100 nm) appears to be particularly promising, because the bands are ascribed to the third and fourth overtones of O-H and C-H stretching modes and the corresponding instrumentation is of low cost and portable enough for in-field measurement applications.[Citation13] Examples of the recent studies using Vis/SWNIR to measure the SSC and pH of fruits and fruit products included pomegranate,[Citation14] oranges,[Citation15] and rice.[Citation16]
Multivariate statistical methods, also called non-linear calibration model, are therefore needed to extract the information about quality of chemical characteristics which is latented in the NIR spectrum. One of the methods used was partial least square (PLS) model. However, Partial least square regression (PLSR) was developed and used to both calibration and predication samples. For example, Shao and He[Citation17] used Vis/NIR to predict the SSC and pH in bayberry juice. The data were analyzed with multivariate calibration methods of PLS. A model with a regression coefficient of 0.85, a standard error of prediction (SEP) of 0.40 g/100 ml, and a bias of −0.14 and 0.92, 0.19 g/100 ml and −0.50 for SSC and pH, respectively, showed a good prediction performance. Liu et al.[Citation18] investigated the feasibility of the NIR spectroscopy to assess SSC and pH of rice wines. A partial least squares model was constructed in order to predict SSC and pH of rice wines based on the transmission spectra. The correlation coefficient (r), standard error of prediction (SEP), and root mean square error of prediction (RMSEP) were 0.95, 0.16, and 0.17 for SSC and 0.94, 0.02, and 0.02 for pH, respectively.
The aim of the present research was to investigate the possibility of UV-IR spectroscopy in measuring the internal chemical parameters (such as total soluble solids (TSS), titratable acidity (TA), ascorbic acid (AA), and total anthocyanin content (AC)) of mulberry juice and to establish a relationship between spectral reflectivity and destructive parameters using multivariate calibration methods, such as PLS analysis.
Materials and methods
Sample preparation
Mulberry fruits (Morus nigra L.) were manually harvested from mature trees in Ramin Agriculture and Natural Resources University of Khuzestan (Mollasani, 31°N, 48°E, 35 km north east of Ahvaz, Iran). Fruits were immediately transported to the laboratory. Fresh fruits were squeezed in by a home juicer. The pulp-juice mixture of each fruit was filtered through cotton pads then centrifuged at 10,000 g for 10 min to remove the pulp. After that, they were stored in a −4°C temperature until analysis. The nutritional quality including total soluble solid (TSS), titratable acidity (TA), ascorbic acid (AA), and total anthocyanin content (AC) of Mulberry juice were studied using UV-IR spectroscopy analysis.
Reflectance measurements
The samples were stored in a refrigerator and transported to the laboratory to be retained at cold temperature (4°C ± 1°C) before NIR spectroscopy analysis. Reflectance measurement techniques have been successfully applied to measure agriculture product quality.[Citation19] In this research, a spectrometer (model, SPEKOL® 2000, made in USA) was used to collect spectra data from mulberry juice, which is designed to perform measurement within the spectral range of 190–1100 nm, and the resolution (wavelength accuracy ≤1 nm) of spectra was set to 2 nm during measurements. All the reflectance spectra of mulberry juice were measured in the lab under the room temperature (25°C). Each sample was scanned 10 times at the same place, with a spectrophotometer, and all spectrums were recorded. In total, 108 spectra of mulberry juice samples were obtained.
Destructive parameters
Analysis of composition
Total soluble solids (TSS) were determined by a hand refractometer device (model: MT03 Japan) and expressed as °Brix. The anthocyanin content was estimated following the procedure of Holecraft et al.[Citation20] Ascorbic acid of the juice was measured by titration with copper sulfate and potassium iodide based on the Barakat et al.[Citation21] procedure. Titratable acidity was measured according to the AOAC method.[Citation22]
Spectral per-processing
To get the optimal performance of NIR spectroscopy analysis, the spectral data was pre-processed prior to the calibration. Pre-processing of spectral data is a key part of spectral analysis to improve the accuracy of developing models. Pre-processing is usually conducted to furnish more parsimonious PLS models, by avoiding the presence of certain spectral trends before regression.[Citation23] In this study, to improve the performance of PLS model, multiplicative scatter correction (MSC) and standard normal variant (SNV) transformation which were found to be the best preprocessing technique and offered by most chemometrics software packages were applied on spectral data. Detail explanation about these preprocessing techniques was presented by Nicolai et al.[Citation11] The pre-treatments were implemented in Matlab software (MathWorks, Inc., Natick, Massachusetts, USA) and applied on spectral data.
Partial least squares (PLS) analysis
PLS, which is an efficient statistical regression technique, was introduced almost 30 years ago to overcome collinearity.[Citation24] As multivariate data analysis method, PLS has been widely employed in Vis/NIR spectroscopy analysis. PLS analysis can be performed to create the regression model leading to the content prediction of chemical components. In this method, simultaneously, the matrix of independent (X) and dependent (Y) variables is considered. After preprocessing of the spectra, PLS models were developed which related the UV-IR spectra and the TSS, AC, AA, and TA in each tested mulberry juice. In order to avoid overfitting of the models, the calibration models were formulated with cross-validation (leave one out cross-validation) according to the predictive residual error sum of squares (PRESS) statistic.[Citation18] The accuracy of NIR models for fruit quality prediction is usually described by the value of the r, the root mean square error of calibration (RMSEC) (Eq. 1), the RMSECV (Eq. 2) and bias (Eq. 3).[Citation25,Citation26] In this study, mulberry juice samples for modeling were split into a calibration (n = 70) set and a validation set (n = 38). A good model should have the lower RMSEC and RMSECV and higher correlation coefficient (r or R) or coefficient of determination (r2 or R2).
where n is the number of spectra, is the actual value,
the mean value,
is the calculated value, and
is the predicted value of the fruit juice attribute. The adequate wavelengths describing the feature of spectra TSS, TA, AC, and AA were determined by x-loading weights. PLS loading weights were specific to PLS and expressed by the information at each wavelength (X-variable) related to the variation in TSS, TA, AC, and AA (Y-variable). The loading weights were normalised, so that their lengths could be interpreted as well as their directions. Wavelengths (variables) with large loading weight values were important for the prediction of TSS, TA, AC, and AA (Y). The PLS was performed using Matlab.
GA-PLS
The genetic algorithm (GA) was applied to select the subset of n wavelength taken from the total spectral data set. The selection of variables for multivariate calibration can be considered an optimisation problem. Usually, a GA is used to implement an automated wavelength selection procedure to build multivariate calibration models and is a suitable method for selecting wavelengths for PLS, MLR, and ANN.[Citation27] Genetic algorithm optimisation combined with partial least squares regression is the most used method in NIR spectroscopic data sets, which combines the advantages of GA and PLS.[Citation28] The GA could find optimal values for several disparate variables associated with the calibration model. In this research, crossover with mutation was used and operated on a population of binary-encoded chromosomes, with each chromosome representing n candidate wavelengths. The probability of crossover, probability of mutation, and population sizes were 0.8, 0.15, and 500, respectively. A rank-based scheme for selection of parent chromosomes for the next generation was performed. To find the most effective wavelengths, the RMS error of prediction of model developed with PLS was used as a criterion of convergence judgment.[Citation27]
Results and discussion
Feature of Vis/NIR spectra
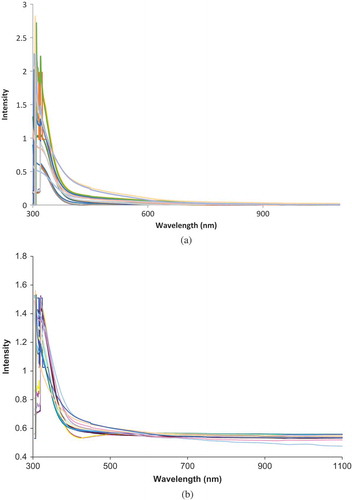
shows the original spectra of 17 mulberry juice samples. shows the result of multiplicative scatter correction as well as standard normal variant (SNV) pre-processing methods. These methods are appropriate for light scatter correction and reducing the effect of the changes of light path-length or concentration variation of juice samples.
Figure 1. Seventeen mulberry juice absorbance spectra before (a) and after (b) pre-processing methods.
Prediction result of PLS analysis for total soluble solid (TSS), titratable acidity (TA), ascorbic acid (AA), total anthocyanin content (AC)
PLS model was developed to predict TSS, TA, AC, and AA of mulberry juice with eight latent variables. The results of prediction and cross-validation are shown in . The correlation coefficient (rc) of 0.93, 0.96, 0.86, and 0.96 and root mean square error of calibration (RMSEC) for 1.26°Brix, 0.20, 0.48, and 0.018 and standard error of calibration (SEC) 0.036°Brix, 0.008, 0.011 and 0.0007 indicated that models made by PLSR could quantify TSS, TA, AA, and AC of mulberry juice, respectively. The results showed a good performance of using UV-IR spectroscopy and PLS analysis method for determination of the internal chemical parameters (TSS, TA, AA, and AC) of mulberry juice in this study. The prediction accuracy is higher than that reported by Shao and He[Citation17] who applied UV-IR spectroscopy to determine the SSC (r = 0.85) and pH (r = 0.92) in bayberry juice. It is also slightly better than that obtained by Schaare and Fraser[Citation29] with r of 0.94 for prediction SSC on kiwifruit. This result is the same as obtained by Liu et al.[Citation18] for assessing SSC of rice wines, that the correlation coefficient (r), standard error of prediction (SEP), and root mean square error of prediction (RMSEP) were 0.95, 0.16, and 0.17 for SSC, respectively. Urbano-Cuadrado et al.[Citation30] have developed a model for prediction of sugars in different types of wine using NIR reflectance spectroscopy. The correlation relationship between the observed and predicted values obtained in their research for TSS (the r value was 0.844) was less accurate than the correlation coefficient results in the present research (r = 0.93). Mat Nawi et al.[Citation31] developed PLS model to predicate SSC of sugarcane based on skin scanning using absorbance spectra data. The r and RMSEP values for predication model were 0.91 and 0.271 °Brix, respectively.
Table 1. Partial least-squares (PLS) calibration models for prediction of TSS, AA, AA and AC Mulberry using different calibration methods for selection of different wavelength regions.
GA-PLS model
The calibration involved deciding and selecting an optimal numbers of wavelengths used for model development. The results of GA-PLS model were presented in . A good model should only use variables presented better predictions with low RMSEC and RMSEV, high correlation coefficient, and small difference between RMSEC and RMSEV in relation to the full model. As in the interval PLS model, the data set was split into 40 intervals. The optimal combinations of 21 spectral intervals among 40 intervals which were selected by GA-PLS also yielded good results: RMSEC = 0.076, rc = 0.96, RMSEV = 0.03096, rv = 0.96; RMSEC = 0.053, rc = 0.89, RMSEV = 0.062, rv = 0.98; RMSEC = 0.014, rc = 0.97, RMSEV = 0.041, rv = 0.98; RMSEC = 0.0007, rc = 0.97, RMSEV = 0.0006, rv = 0.96 for TSS, AA, TA, and AC of mulberry juice, respectively. This result is the same as obtained by Xiaobo et al.[Citation28] for assessing SSC of “Fuji” apple based on GA-PLS model; RMSECV, RMSEC, rv, and rc were 0.3126, 0.1907, 0.9635, and 0.96361 for SSC, respectively. The present study also shows that the GA can be a good method for feature selection in spectral data sets. The results obtained on data set of TSS, AA, TA, and AC of mulberry juice demonstrate that the predictive ability of models obtained with the wavelengths selected by the GA algorithm is very often much better. The best TSS, AA, TA, and AC predictions were obtained from 15-factor model using the 31 variables selected by GA-PLS. shows the performance of the GA-PLS and PLS models for prediction of TSS, TA, AC, and AA.
Figure 2. Scatter plot between observed values and predicted UV-IR values for TSS (PLS (a), GA-PLS (b)), AA (PLS (c), GA-PLS (d), TA (PLS (e), GA-PLS (f)) and AC (PLS (g), GA-PLS (h)) in mulberry juice.
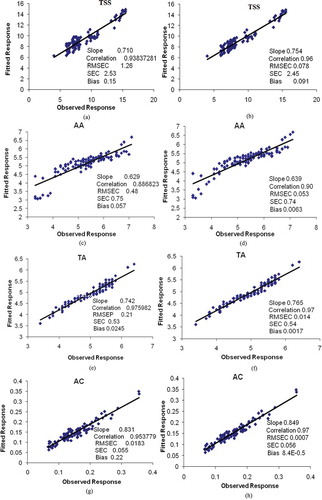
In all figures, the ordinate and abscissa axes represent the observed and the predicted values of the appropriate parameters, respectively. The correlation coefficient between the observed and predicted values of the parameters obtained (i.e., TSS and TA) using GA-PLS and PLS is higher than the results reported by previous research.[Citation28,Citation32,Citation33] As shown in , with the selected wavelengths using GA, PLS model gave better performance than full spectrum. These results are in agreement with previous research such as Gomez et al.[Citation34]
Figure 3. Spectral interval selection accomplished by GA-PLS for TSS.
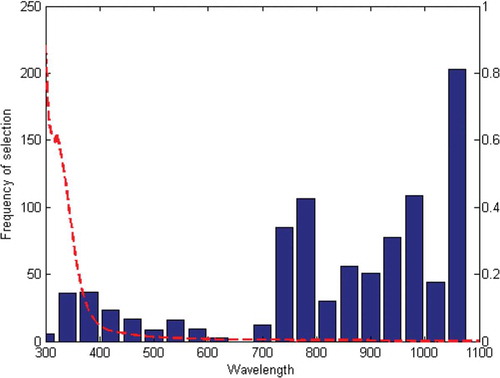
For TSS, the best combinations of selected explanatory interval were number 12, 13, 17, 18, and 20. These intervals were corresponded to 730–750, 770–790, 930–950, 970–990, and 1050–1070 nm in spectral regions, which is shown in . Also for AA, the best combinations of interval selected were number 12, 13, 15, 17, 18, 19, and 20. They were corresponding to 730–750, 770–790, 850–870, 930–950, 970–990, and 1050–1070 nm in spectral regions. Maurizio et al.[Citation35] examined the SSC of “Golden Delicious” and “Jonagold” with a wavelength range of 810–999 nm. Furthermore, GA-PLS was applied to the data set and resulted in the selection of three wavelengths for TA (930–950, 970–990, and 1050–1070) and four (770–790, 930–950, 970–990, and 1050–1070) for AC.
Effective wavelength for predicting TSS, TA, AC, and AA
Information about which wavelength contributes most to the prediction of the destructive internal parameters can be derived from the regression coefficients of the PLS model containing eight latent variables. An indication of the relative importance of the different wavelengths for prediction of a variable can be obtained from the produce between the regression coefficients and the standard deviation of the spectral. As this product term for the TSS, AA, TA, and AC is shown in , there are some strong peaks and valleys at certain wavelengths, such as 350–420, 420–500, and 500–600 in visible region, and also 740–800, and 950–1100 nm in NIR region related to TSS. This result is in agreement with Shao and He[Citation17] who have reported the wavelength around 650–680 and 970–990 nm was relatively the most important wavelengths for SSC prediction in bayberry juice.
Figure 4. Plot of the relative contribution of each wavelength of the predicted value of the TSS, TA, AA, and AC.
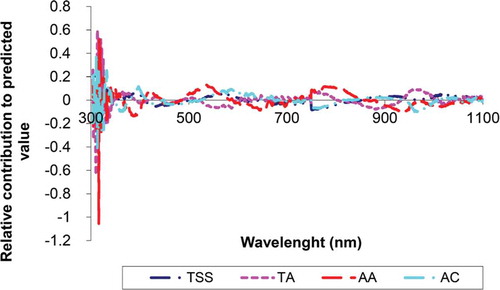
It can be perceived from that the wavelength regions of 399–500, 520–600, 750–800, 850–950, and 950–1000 nm are the most adequate for determination of TA of mulberry juice. While the wavelengths between 738 and 970 nm are due possible to the results of a 3rd and 2nd, the shared waveband of 910 and 970 nm for TA was produced by 2nd of overtone stretch of OH and 3rd overtone stretch of CH, respectively. This was referred by Golic et al.[Citation36] in their paper for the band assignments of the major water and sugar (O-H and C-H) in fruit juices by NIR/Vis spectroscopy. Thus, the 738, 970, and 910 nm might be the sensitive wavelengths for TSS and TA of mulberry juices, respectively. Furthermore, the water absorption bands are fairly broad with centres at approximately 970, 1200, 1450, 1950, and 2250 nm.[Citation37] Moreover, the optimum conditions for the sensing of AA were concluded to be around 400–600, 900–950, 750–930, and 1000–1100 nm. The region about 400–600 was found to be in agreement with the results obtained by Somers[Citation38] who declared that peaks in the visible region (450–640 nm) may represent the wine colour differences because 540 nm was related to the wine pigments (total anthocyanin). For the sensing of AC, the spectral ranges around 350–399, 450, 500–700, 750–800, and 940–1000 nm were relatively consistent.
Wavelengths around 450 and 900–940 nm TSS, TA and AC show relatively inverse relationship with AA. Furthermore, the shape of the curves around wavelengths range 500–680 nm for TSS, AA and AC compared with TA is almost identical except that they are each other’s mirror images. The inverse shape can be explained by fact that, for example, while the AC increases the TA decreases in wavelengths range 500–680 nm. Burdurlu et al.[Citation39] reported that ascorbic acid decomposes easily in acid solution. Saguy et al.[Citation40] observed that, at constant temperature, the rate of AA degradation in grapefruit increased steadily with increase of the TSS. In fact, the correlation between the TSS, AA and AC with TA curves in 500–680 nm are −0.58, −0.69, −0.76 conversely, and curve shapes in wavelengths ranges around 450–500 and 690–735 nm were roughly similar and curves have a positive correlation.
Conclusions
In this study, UV-IR as a low-cost alternative and non-destructive method was utilised for predication of the internal chemical parameters (TSS, TA, AA, and AC) of mulberry juice. The multivariate calibration methods of PLS was used to establish model between internal parameter and the absorbance spectra. An excellent precision was achieved with the correlation coefficient (r) of 0.94, 0.89, 0.98, and 0.95 and root mean square error of validation (RMSEV) 1.31°Brix, 0.52, 0.014, and 0.014 for TSS, AA, TA, and AC of mulberry juice, respectively. GA was also applied to select the efficient spectral regions. Model using 31 variables and 15 factors presented and yielded the best prediction results. The best combinations of 7 spectral intervals among 21 intervals which were selected by GA-PLS also yielded good results with RMSEV = 0.03096, r = 0.96; RMSEV = 0.062, r = 0.98, RMSEV = 0.041, r = 0.98; RMSEV = 0.0006, r = 0.96 for TSS, AA, TA, and AC of mulberry juice, respectively. Finally, it was concluded that by using the UV-IR measurement technique, spectral range (300–1100 nm), it is possible to assess the quality characteristics of mulberry juice. The present study also shows that the GA can be a good method for feature selection in spectral data sets.
Acknowledgements
The authors acknowledge the financial support provided by the Ramin Agriculture and Natural Resources University of Khuzestan.
References
- Kaczmarska, E.; Gawronski, J.; Dyduch-Sieminska, M.; Najda, A.; Marecki, W.; Zebrowska, J. Genetic Diversity and Chemical Characterization of Selected Polish and Russian Cultivars and Clones of Blue Honeysuckle (Lonicera caerulea). Turkish Journal of Agriculture and Forestry 2015, 39, 394–402.
- Mlcek, J.; Valsikova, M.; Druzbikova, H.; Ryant, P.; Jurikova, T.; Sochor, J.; Borkovcova, M. The Antioxidant Capacity and Macroelement Content of Several Onion Cultivars. Turkish Journal of Agriculture and Forestry 2015, 39, 999–1004.
- Ipek, A.; Yilmaz, K.; Sıkıcı, P.; Tangu, N.A.; Oz, A.T.; Bayraktar, M.; Ipek, M.; Gulen, H. SNP Discovery by GBS in Olive and the Construction of a High-Density Genetic Linkage Map. Biochemical Genetics 2016, 54, 313–325.
- Tsou, C.; Li, L.; Vijayan, K. The Intra-Familial Relationships of Pentaphylacaceae as Revealed by DNA Sequence Analysis. Biochemical Genetics 2016, 54, 270–282.
- Gundogdu, M.; Muradoglu, F.; GaziogluSensoy, R.I.; Yilmaz, H. Determination of Fruit Chemical Properties of Morus nigra L., Morus alba L. and Morus rubra L. by HPLC. Scientia Horticulturae 2011, 132, 37–41.
- Ercisli, S.; Orhan, E. Chemical Composition of White (Morus alba), Red (Morus rubra) and Black (Morus nigra L.) Mulberry Fruits. Food Chemistry 2007, 103, 1380–1384.
- Koyuncu, F. Organic Acid Composition of Native Black Mulberry Fruit. Chemistry of Natural Compounds 2004, 40(4), 367–369.
- Dugo, P.; Mondello, L.; Errante, G.; Zappia, G.; Dugo, G. Identification of Anthocyanins in Berries by Narrow-bore High Performance Liquid Chromatography with Electrospray Ionization Detection. Journal of Agricultural and Food Chemistry 2001, 49, 3987–3992.
- Pan, G.; Lou, C.F. Isolation of a 1-aminocyclopropane-1-carboxylate Oxidase Gene from Mulberry (Morus alba L.) and Analysis of the Function of this Gens in Plant Development and Stresses Response. Journal of Plant Physiology 2008, 165, 1204–1213.
- Ozgen, M.; Serce, S.; Kaya, C. Phytochemical and Antioxidant Properties of Anthocyanin-Rich Morus nigra and Morus Rubra Fruits. Scientia Horticulturae 2009, 119, 275–279.
- Nicolai, B.M.; Beullens, K.; Bobelyn, E.; Peirs, A.; Saeys, W.; Theron, K.I.; et al. Non-Destructive Measurement of Fruit and Vegetable Quality by Means of NIR Spectroscopy: A Review. Postharvest Biology and Technology 2007, 46, 99−118.
- Cen, H.; Bao, Y.; He, Y.; Sun, D.W. Visible and Near Infrared Spectroscopy for Rapid Detection of Citric and Tartaric Acids in Orange Juice. Journal of Food Engineering 2007, 82, 253–260.
- Walsh, K.B.; Guthrie, J.A.; Burney, J.W. Application of Commercially Available, Low-Cost, Miniaturized NIR Spectrometers to the Assessment of the Sugar Content of Intact Fruit. Australian Journal of Planet Physiology 2000, 27, 1175–1186.
- Khodabakhshiana, R.; Emadia, B.; Khojastehpoura, M.; Golzariana, M.R.; Sazgarniab, A. Nondestructive Evaluation of Maturity and Quality Parameters of Pomegranate Fruit by Visible/Near Infrared Spectroscopy. International Journal of Food Properties 2016 (just-accepted).
- Jamshidi, B.; Minaei, S.; Mohajerani, E.; Ghassemian, H. Prediction of Soluble Solids in Oranges Using Visible/Near-Infrared Spectroscopy: Effect of Peel. International Journal of Food Properties 2014, 18, 1460–1468.
- Lapchareonsuk, R.; Sirisomboon, P. Sensory Quality Evaluation of Rice Using Visible and Shortwave Near-Infrared Spectroscopy. International Journal of Food Properties 2015, 18, 1128–1138.
- Shao, Y.; He, Y. Nondestructive Measurement of the Internal Quality of Bayberry Juice Using Vis/NIR Spectroscopy. Journal Food Engineering 2007, 79, 1015–1019.
- Liu, F.; He, Y.; Wang, L.; Pan, H. Feasibility of the Use of Visible and Near Infrared Spectroscopy to Assess Soluble Solid Content and pH of Rice Wines. Journal Food Engineering 2007, 83, 430–435.
- Chia, K.S.; Rahim, H.A.; Rahim, R.A. Prediction of Soluble Solids Content of Pineapple via Non-Invasive Low Cost Visible and Shortwave near Infrared Spectroscopy and Artificial Neural Network. Biosystems Engineering 2012, 113(2), 158–165.
- Holcroft, D.M.; Gil, M.I.; Kader, A.A. Effect of Carbon Dioxide on Anthocyanins, Phenylalanine Ammonia Lyase and Glucosyltransferase in the Arils of Stored Pomegranates. Journal of the American Society for Horticultural Science 1998, 123(1), 136–140.
- Barakat, M.Z.; Shehab, S.K.; Darwish, N.; El-Zoheiry, A. A New Titrimetric Method for the Determination of Vitamin C. Analytical Biochemistry 1973, 53, 245–251.
- AOAC. Official Methods of Analysis. 16th ed.; Association of Official Analytical Chemists, Washington DC, U.S.A, 1984.
- Sorol, N.; Arancibia, E.; Bortolato, S.A.; Olivieri, A.C. Visible/Near Infrared-Partial Least-Squares Analysis of Brix in Sugar Cane Juice: A Test Field for Variable Selection Methods. Chemometrics and Intelligent Laboratory Systems 2010, 102, 100–109.
- Wold, S.; Trygg, J.; Berglund, A.; Antti, H. Some Recent Developments in PLS Modeling. ChemomIntell Lab Sys 2001, 58, 131–150.
- Liu, Y.; Sun, X.; Ouyang, A. Non-Destructive Measurements of Soluble Solid Content of Navel Orange Fruit by Visible-NIR Spectrometric Technique with PLS and PCA-BPNN. LWT-Food Science and Technology 2010, 43, 602–607.
- Bobelyn, E.; Serban, A.; Nicu, M.; Lammertyn, J.; Nicolai, B.M.; Saeys, W. Postharvest quality of apple predicted by NIRspectroscopy: Study of the Effect of Biological Variability on Spectra and Model Performance. Postharvest Biology A Technology 2010, 55, 133–143.
- Abdanan Mehdizadeh, S.; Minaei, S.; Hancock, N.H.; KarimiTorshizi, M.A. An Intelligent System for Egg Quality Classification based on Visible-Infrared Transmittance Spectroscopy. Information Processing in Agriculture 2014, 1, 105–114.
- Xiaobo, Z.; Jiewen, Z.; Yanxiao, L. Apple Color Grading based on Organization Feature Parameters. Pattern Recognition Letters 2007, 28: 2046–2053.
- Schaare, P.N.; Fraser, D.G. Comparison of Reflectance, Interactance and Transmission Modes of Visible-Near Infrared Spectroscopy for Measuring Internal Properties of Kiwifruit (Actinidiechinensis). Postharvest Biology and Technology 2000, 20, 175–184.
- Urbano-Cuadrado, M.; de Castro, M.D.L.; Perez-Juan, P.M.; Garcia-Olmo, J.; Gomez-Nieto, M.A. Near Infrared Reflectance Spectroscopy and Multivariate in Enology Determination or Screening of Fifteen Parameters in Different Types of Wines. Analytica Chimica Acta 2004, 527(1), 81–88.
- Mat Nawi, N.; Chen, G.L.; Jensen, T.; Abdanan Mehdizadeh, S. Prediction and Classification of Suger Content of Sugarcane Based on Skin Scanning Using Visible and Shortwave Near Infrared. Biosystem Engineering 2013, 115, 154–161.
- Mc-Glone, V.A.; Fraser, D.G.; Jordan, R.B.; Kunnemeyer, R. Internal Quality Assessment of Mandarin Fruit by Vis–NIR Spectroscopy. Journal of Near Infrared Spectroscopy 2003, 11, 323–332.
- Antonucci, F.; Pallottino, F.; Paglia, G.; Palma, A.; D’Aquino, S.; Menesatti, P. Non-Destructive Estimation of Mandarin Maturity Status through Portable VIS-NIR Spectrophotometer. Food and Bioprocess Technology 2010, 4(5), 809–813.
- Gomez, A.H.; He, Y.; Pereira, A.G. Non-Destructive Measurement of Acidity, Soluble Solids and Firmness of Satsuma Mandarin using Vis–NIR Spectroscopy Techniques. Journal of Food Engineering 2006, 77, 313–319.
- Maurizo, V.; Jager, A.D.; Putter, H.D.; et al. Non-destructive Determination of Soluble Solids in Apple Fruit by Near Infrared Spectroscopy. Postharvest Biology and Technology 1998, 14, 21–27.
- Golic, M.; Walsh, K.B.; Lawson, P. Short-Wavelength Near-Infrared Spectra of Sucrose, Glucose, and Fructose with Respect to Sugar Concentration and Temperature. Applied Spectroscopy 2003, 57, 139–145.
- Williams, P.C.; Norris, K.H. Qualitative Applications of Near-Infrared Reflectance Spectroscopy. Near-infrared Technology in the Agricultural and Food Industries 1987, 241–246.
- Somers, C. The Wine Spectrum: An Approach towards Objective Definition of Wine Quality; Wine titles: Adelaide, 1998; 50 p.
- Burdurlu, H.S.; Koca, N.; Karadeniz, F. Degradation of Vitamin C in Citrus Juice Concentrates during Storage. Journal of Food Engineering 2006, 74, 211–216.
- Saguy, I.; Kopelman, I.; Mizrahi, S. Effect of Nonenzymatic Browning in Grapefruit Juice Thermal and Concentration Process: Kinetics and Prediction. Journal of Food Processing and Preservation 1978, 2, 175–184.