
ABSTRACT
Several methods for the isolation and purification of cellulose from coffee silverskin (CS) were investigated using alkaline, hydrogen peroxide (HP), organosolvents, acetic acid, and their combinations. The process and cellulose were characterised by their yield, cellulose content, colour, alkaline resistance (R10), FTIR spectroscopy, X-ray diffractometry, and thermal stability. Whiteness index (WI), R10, crystallinity, thermal stability, yield, and cellulose content of the solids obtained after extraction were dependent on the extraction procedures. Alkaline ethanol-HP-acetic acid protocol resulted in a cellulosic sample with the highest thermal stability (13% weight loss (WL) in the temperature range of 280–360 °C) and a cellulose Iβ content with 70% crystallinity. These results showed the great potential of CS as a new source of cellulose.
Introduction
Coffee is one of the most consumed beverages and the second largest traded goods after crude oil in the world.[Citation1] Due to the high demand for this product, a considerable amount of residues are generated in the coffee industry. Coffee silverskin (CS), the thin tegument of the outer layer of green coffee beans, is one of the major agro-industrial side-products generated worldwide.[Citation2] Nowadays, CS is mainly used for fertiliser or composting, whereas the efficient utilisation of CS could be an alternative to its environmental disposal. CS has high antioxidant activity.[Citation3] Additionally, among the coffee residues, silverskin contains a high amount of total fibre (80%), with 16% soluble dietary fibre and 64% insoluble dietary fibre, followed by cherry husk and spent waste.[Citation4] The chief components of the fibrous tissues from the surface layers of CS are cellulose (23.8%) and hemicellulose (16.7%). Proteins and extractives are also present in significant amounts in this coffee waste.[Citation5] Owing to the quantity of annually generated silverskin, and due to its chemical composition, the use of CS as the primary source for producing cellulose fibres is promising. In lignocellulosic materials, cellulose is surrounded by a gel matrix composed of hemicelluloses, lignin, and other carbohydrate polymers; thus, it needs to be refined in order to become a consumer product.[Citation6] Hemicelluloses are amorphous polymers with different structures depending on plant species and cell types.[Citation7] On the other hand, lignin exists as a minor component in CS and demonstrates greater resistance than any other naturally occurring polymers due to strong intramolecular bonding.[Citation4]
Cellulose is widely used because of its multipurpose application in many areas including food, paper, and pharmaceutical industries. For instance, it has been used as fat replacer, fat-reducing agent during frying, volume enhancer, binder, bulking agent, and stabiliser in food industries. The characteristics of cellulose are generally believed to be governed by the properties of source plant and extraction technique.[Citation8] Cellulose is a long-chain polymer containing (1 → 4)-linked β-glucopyranosyl residues. Up to 100 cellulose chains are gathered together to form long thin elementary structures (fibrils) containing both crystalline and amorphous structures. Considering the large amount of CS produced every year, it is essential to improve the processes currently considered for their use and to test new processes to obtain value-added products. Intensive researches are being carried out on the development of environmentally friendly approaches, which generally involve the use of hydrogen peroxide (HP) and organic acids. It is well known that the reactivity of HP with lignin under alkaline condition is considerable.[Citation9] Furthermore, a wide variety of organic solvents, especially those with low molecular weight, including alcohols and organic acids have been proposed for the delignification of lignocellulosic materials, with the industrial interest on ethanol and methanol due to their relatively low cost.[Citation10] In addition, acetic acid has drawn particular attention because of its ability to achieve extensive and selective delignification in a single-step operation.[Citation11] In organosolv delignification, both lignin and hemicelluloses are attacked, leading to the formation of oligomers and the dissolution of a large proportion of these components to be further purified.[Citation12]
There has been no reported study on the utilisation of CS as a renewable cellulose source along with a full characterisation of the extracted cellulose. Therefore, the objective of this work was to investigate different cellulose isolation and purification procedures from CS, including treatments by chemicals like HP, alkaline, methanol, ethanol, acetic acid, and their combinations. Then, the yield, colour, cellulose content, alkaline resistance (R10), FTIR spectroscopy, X-ray diffractometry, and thermal stability of the extracted cellulosic materials were characterised.
Materials and methods
Materials
The silverskin from robusta variety coffee beans was provided by Multi-Café Company, located in Khorasan, Iran. In order to remove foreign materials and impurities such as dust, stones, and coffee residues, the CS was sieved, cleaned pneumatically, and washed with tap water three times. The CS was dried using an air-forced oven at 60°C, milled and sieved through a sifter with 0.3 mm aperture size. The dried powder was kept in polyethylene bags and in a cool and dry place prior to performing experiments. The chemicals were purchased from Merck (Darmstadt, Germany) and used as received without any further purification.
Chemical composition analysis
The amounts of moisture, ash, fat, and protein (N × 6.25) were determined based on AOAC[Citation13] standard methods. Soluble dietary fibre (SDF), insoluble dietary fibre (IDF), and total dietary fibres (TDF) were determined according to the AOAC[Citation13] standard method. Carbohydrate was determined by the remainder after determining the moisture, fat, protein, and ash contents.
Fat removal
Samples of CS were pretreated with n-hexane (1:4 w/v ratio) and allowed to stir gently for 48 h. Then, samples were filtered, 96% ethanol was added at the same ratio of n-hexane to the residues, and stirred for 12 h. The next step was carried out using the procedure described by Bligh and Dyer. [Citation14] Accordingly, samples were filtered and mixed with a blend of chloroform (1:1 w/v ratio) and methanol (1:2 w/v ratio). Subsequently, chloroform was added at a ratio of 1:1 w/v. After stirring for 30 s, distilled water was added (1:1 w/v ratio) and mixing continued for further 30 s. The de-waxed and defatted CS was desolventised and dried in an air-forced oven for 12 h at 45°C.
Cellulose extraction procedures
summarises the different protocols for extracting cellulose from CS applied in this work. The utilised protocols can be categorised as: alkaline treatment (sample A), coupling alkaline treatment with methanol (samples B) and ethanol (sample C) as organosolvent, one-step alkaline HP treatment, alkaline treatment followed by alkaline HP (sample E), alkaline organosolvents combined with HP treatments (samples F and G), and acetic acid treatment on samples D to G (samples H to K). The ratio of sample powder to reagents was 1:22 for all protocols, except for acetic acid treatment, which was kept constant at 1:10. The filtration was performed using Whatman No. 1 filter paper (GE Healthcare, Germany) and distilled water was used for the washing steps. All preparations were replicated at least three times.
Figure 1. The schematic diagram of different protocols performed to extract cellulose from coffee silverskin.
Cellulose content determination
The determination of CS cellulose content was carried out based on the method described by Brendel et al.[Citation15] Briefly, 2.0 mL of acetic acid (80% v/v) and 0.2 mL of concentrated nitric acid (69% v/v) were added to a screw-capped tube containing 100 mg CS and autoclaved for 20 min. After cooling, the residues were washed thrice with 2.5 mL of ethanol (99% v/v), twice with 2.5 mL deionised water, twice with 2.5 mL of ethanol, and finally twice with 2.5 mL acetone. After each washing step, the mixtures were centrifuged and the supernatant was discarded. The cellulose content was calculated as the weight percentage of solid residues to initial sample.
Weight loss
The weight loss (WL) of extractions was determined gravimetrically as the ratio of weight difference to the initial weight of the sample after oven drying and achieving a constant weight.
Alkaline resistance
Alkaline resistance (R10) of samples was determined according to the TAPPI standard method (No. T235 cm-09). Briefly, samples were submitted to 10% sodium hydroxide solution for 1 h at 25°C, and the carbohydrate content of extractives was determined by oxidation with potassium dichromate.[Citation16]
Colour parameters
The colour parameters of the samples were determined by CR-400 chroma meter (Konica Minolta Inc., Japan) in CIE-Lab colour space, in which L indicates lightness, a specifies hue on a green (-) to red (+) axis, and b shows hue on a blue (-) to yellow (+) axis. Whiteness index (WI) was calculated according to the following equation:[Citation17]
FTIR spectroscopy
The FTIR analysis of samples was performed using a Spectrum 100 spectrometer (Perkin-Elmer, USA). The 1 mg sample powders were mixed with 100 mg KBr in the 1:100 ratio, pelleted as discs, and their spectrum were scanned from 4000 to 400 cm−1. All scanned spectra were baseline-corrected and deconvoluted using the bundled software.[Citation6]
X-ray diffractometry
X-ray diffraction (XRD) pattern of samples was recorded using Bruker D8 Advance (Bruker AXS GmbH, Germany) operating at Cu-Kα wavelength, and target voltage and current of 1.541874 Å and 40 kV and 40 mA, respectively. The scans were performed in the diffraction angle (2θ) of 10–90º at a step size of 0.02º. The crystallinity was taken as the ratio of the sum of areas under the diffraction peaks to the total area under the curve.[Citation18]
Thermogravimetric analysis
The thermal characteristics of samples were determined using a Pyris Diamond TG/DTA thermogravimetric analyser (Perkin-Elmer, USA). Briefly, 3 mg of sample was transferred to aluminium pans and scanned from 25°Cto 500°C at 10°C/min heating rate and 20 mL/min N2 flow rate. [Citation6] In order to better understand the thermal stability of samples, we determined the temperature of the initial decomposition and the main decomposition, the area below the main decomposition temperature (AMDP), the extent of WL in the temperature range of 280–380°C, the area under the derivative curve (ADTG), and the slope of decomposition at 280°C.
Data analysis
All experiments were carried out at least in triplicate. The experimental data were analysed by one-way analysis of variance (ANOVA) at 95% confidence level and the means were compared using Tukey’s test of SPSS software version 17 (SPSS Inc., USA).
Results and discussion
The result of the proximate composition revealed that the moisture, fat, crude protein, ash, cellulose, and total carbohydrate content of CS samples were 8.2 ± 0.2% (dry basis), 2.7 ± 0.8%, 19 ± 1%, 5.7 ± 0.3%, 31 ± 2%, and 72.5 ± 0.5%, respectively. In addition, total carbohydrate consisted mostly of IDF (64.2 ± 0.3%) with 7.6 ± 0.7% SDF. The results were in good agreement with those reported by Borrelli et al.[Citation19] The composition data indicated that CS can be considered as a potent source of insoluble dietary fibre, especially cellulose.
Weight loss
The results of WL% of samples treated by different procedures are presented in . It was observed that the alkaline treatment of CS eliminated about 15% of extractives (sample A), but when it was combined with methanol and ethanol, the WL increased (p < 0.05) about 46% in both B and C samples. Generally, it is believed that alkaline treatment favours solubilisation of lignocellulosic components such as hemicelluloses, lignin, residual extractives, and ashes in lignocellulosic materials.[Citation7] Sridach[Citation10] found that methanol and ethanol (as pulping solvents) could facilitate the dissolution of lignin with higher efficiency for methanol.
Table 1. Influence of different treatment methods on the physicochemical properties of cellulose extracted from coffee silverskin.
After alkaline hydrogen peroxide (AHP) treatment, the WL value significantly increased in samples D to G. It is believed that reactive oxygen species such as the superoxide anion (O2−2), HP (H2O2), and the hydroxyl radical (OH˙) are able to damage biomolecules like proteins, lipids, and carbohydrates.[Citation20] Renard et al.[Citation17] compared three treatments including sodium chlorite in acidic conditions, sodium hypochlorite, and HP in alkaline conditions for bleaching of apple pomace. They found that AHP (2% H2O2 in 1 M NaOH) was the most satisfactory treatment with 43% yield. Fang et al.[Citation21] compared two procedures of alkali and AHP for the extraction of cellulose from rye straw. Their results showed that treatment of the straw with dilute alkaline solution at pH 11.5 in the absence of H2O2 yielded 85.9% residues, whereas it decreased to 46.6% in the presence of 2% H2O2. The final step, i.e. treatment with acetic acid in H2SO4 and peroxyacetic acid-catalysed system, further increased the WL of samples (). Abad et al.[Citation11] reported that high degrees of both lignin and hemicellulose removal were achieved in acetic acid-based pulping. In acetic acid treatments, acidolysis is the most important mechanism of lignin degradation. Jahan et al.[Citation22] investigated the effect of acetic acid with H2SO4 treatment on the hemicellulose dissolution of rice straw, and reported that the procedure facilitated the dissolution of lignin during alkaline extraction and peroxyacid treatment. They obtained high pulp yield with the optimum kappa number by acetic acid/peroxyacetic acid pulping. The results in express that the loss values were almost affected by the existence of alcohols, but not by their types in sequential procedures. The sequential procedures for the isolation of cellulose showed the highest loss values, especially in sample J.
Cellulose
summarises the total yield of cellulose. The yield of cellulose shows the content of residual cellulose after hemicelluloses, lignin, and other extractive removal using different chemical treatments. With increase in the step of extraction, the cellulose content increased in samples because of the removal of other components such as lignin, hemicelluloses, and amorphous cellulose. As the HP solution was used in the sequential treatment, the cellulose content (Cc) value of samples E to K increased from 59.0% to 85.5 %, which were higher than the CC values of samples A to D (38.0–50.4%) without HP or with a single stage of HP treatment. From these results, it could be concluded that alkaline treatments can remove some of the impurities and sequential treatment with alkaline ethanol/methanol -AHP-acetic acid-peroxy acetic acid can remove most of them and the maximum part of the residues in three-step treatments were cellulose. Sun et al.[Citation23] reported that the extraction of de-waxed wheat straw using 2% H2O2–2% NaOH solution for 5 h at 45°C and 50°C left 53.8% and 53.3% cellulose, respectively. Correia et al.[Citation24] reported an increase of 37.6% of cellulose in the cashew apple bagasse treated with 4.3% v/v AHP (pH=11.5, temperature=35°C, biomass loading= 10% w/v, time 24 h) compared with the original sample.
Alkaline resistance
Low molecular weight carbohydrates (hemicellulose and degraded cellulose) can be extracted from treated samples with sodium hydroxide. R10 is indicative of relative resistance to solubility in 10% sodium hydroxide solution, which provides information on the degradation of cellulose and loss or retention of extractable materials (i.e. degraded cellulose, short-chain glucan, and hemicellulose) during pulping and bleaching processes.[Citation25] After AHP delignification, the R10 value of samples D, E, F, and G varied from 88.3% to 93.0%, suggesting more efficiency in obtaining α-cellulose than samples A to C, prepared without AHP treatment. demonstrates that alkaline resistance was almost unaffected by the type of alcohols, whereas it was increased when multistep treatments were used. Also, the sequential treatments employed on samples I to K were the most efficient methods for removing non-cellulosic components from the fibres without any significant differences in their R10 values. Similarly, Abad et al.[Citation11] reported that NaOH treatment to some extent improved the alkaline resistance of Eucalyptus globules wood pulp.
Colour characteristics
Colour reveals the residues of the natural impurities, pigments, and lignin left in cellulose fibres. It is recognised that browning in plant tissues is generally caused by the oxidation of phenols and their subsequent polymerisation to dark-coloured pigments such as melanins and quinones.[Citation26] In CS, the phenolic compounds (mainly chlorogenic acids), which present in a total amount of 1.1 mg (expressed as chlorogenic acid per 100 g), react with polysaccharide components during roasting and form a mixture of dark polymers, namely melanoidins.[Citation19] In this regard, whiteness was calculated to provide a better picture of the overall colour of the treated samples. Statistical analysis of data showed that the effect of HP on CS bleaching performance was highly significant (p<0.01). As the HP solution was used, the WI value of samples D to K increased from 61% to 70%, which were higher than the WI values of samples A, B, and C without HP treatment (). There was a significant difference between WI of alkaline-alcoholic-treated samples and their counterparts coupled with HP, with the higher value observed for the later samples. The final stage of treatments further increased the WI, especially in sample H. The effect of bleaching with different treatments was also evaluated by the means of L*, a*, and b* colour parameters (). It was observed that the b* and a* values did not show a meaningful trend on increasing the steps of treatments. Based on the results of L* and WI parameters shown in , the highly bleached CS samples were D, which was treated by AHP and H treated by coupling acetic acid treatment with AHP solutions. The high electronegativity of two oxygen atoms produced from the dissociation of H2O2 makes it a powerful oxidising agent, so it can be successfully used to decolourise CS. HP is generally accepted and recognised to be safe. Renard et al. [Citation17] reported a study on bleaching dried apple pomace by sodium chlorite in acidic conditions, sodium hypochlorite, or HP in alkaline conditions. They demonstrated that the most acceptable treatment for the intensity and evenness of bleaching was HP. Šereš et al. [Citation27] decolourised sugar beet fibres with HP and showed that the L* value of the treated fibres at pH 11 was 74.2, which was 5 units higher than that of the control sample. Aider et al. [Citation26] bleached non-defatted brown flaxseed meal with dilute HP (3%) treatment. They reported that the value of L* value increased from 51.2 in the control to 75.0 in the treated sample, while the b* value decreased from 7.5 to 0.2.
FTIR analysis
FTIR has recently been found the most promising in cellulose research, since it presents a relatively easy method of obtaining direct information on chemical changes that occur during various chemical treatments of natural fibres.[Citation6] Infrared spectra of all cellulosic preparations are shown in . The intensity of vibration located at 707cm−1 increased in sequential treated samples with the highest intensity for both samples J and K (), which has been attributed to CH2 rocking vibration in cellulose Iβ.[Citation28] Using 2D FTIR spectroscopy, Salmén et al. [Citation29] reported that the peak around 710 cm−1 had a linear correlation with the amount of cellulose Iβ in the crystalline part of native cotton. It has been shown that cellulose consists of amorphous and crystalline domains, and the latter may consist of several types of polymorphs (namely Iβ, Iα, II, III, and IV cellulose) depending on the origin of cellulose and the type of chemicals used in their treatments.[Citation6] The vibrations located at the range of 1162–1166 cm−1 are assigned to the anti-symmetric bridge C-O-C stretching vibration and existed in the spectra of all treated samples.[Citation6] The band at 1617–1634 cm−1 presented in the spectrum of the control sample (data not shown) and its intensity enhanced in samples A to K, with the maximum intensity in sample K. This peak in all spectra corresponds to the adsorbed water. Also, it is ascribed to the stretching of hydrogen bonds and the bending of hydroxyl (OH) groups bound to the cellulose structure.[Citation30] A main absorbance region corresponded to the range of 3239–3558 cm−1, presented at spectra of all samples, while their intensity and broadness dramatically increased in samples E, H, I, J, and K. This frequency region indicating O-H-stretching vibrations occurred in hydrogen bonds or a contribution from an N-H-stretching mode. Also, the spectra for samples E, I to K, and H showed an additional peak at 3934 cm−1. Aromatic C-H vibrations generally occurred as weak absorptions in the range of 3000–3100 cm−1 and might be overlapped by the broad O-H-stretching band.[Citation31] The peaks in the range of 3239–3241 cm−1 were observed in the spectra of all treated samples and their intensities in samples E, I, J, and K were obviously more than in the other samples. It seems that the peak has been overlapped by some other peaks in a commercial sample. Peredo et al.[Citation32] attributed the peak positioned in 3334 cm−1 to the OH stretching. These results indicate that the cellulose component was not removed during the treatments carried out on the CS fibres and suggest more crystallinity and purity in samples E and H to K. There was no peak around 1428 cm−1 in the spectra of the treated samples, which corresponds to the C–O stretch and CH or OH bending in hemicelluloses.[Citation33] In addition, there was no peak at 1734 cm−1 in the FTIR spectra of all samples, which according to Rosa et al.[Citation31] is assigned to C = O of ketone due to hemicelluloses. A shoulder was observed around 2857cm−1 in the spectrum corresponding to the A to D, F, and G samples. It is ascribed to the presence of wax substances. The peak disappears upon further treatment of the CS, showing the removal of non-cellulosic materials.[Citation34]
Figure 2. FTIR spectra of the extracted cellulosic materials from coffee silverskin (samples A–K obtained by various procedures shown in )
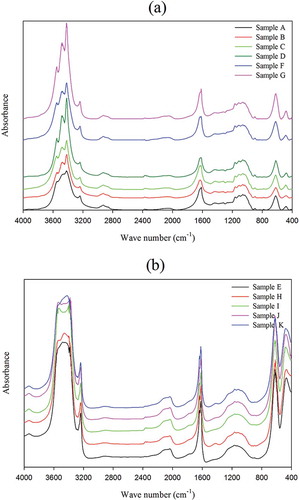
Figure 3. Evolution of peak height at 707 cm−1 as a function of extraction procedure.
XRD analysis
X-ray diffractometry was used to investigate the crystalline structure of samples. Cellulose is crystalline in nature due to hydrogen bonding interactions and Van der Waals forces between adjacent molecules contrary to hemicellulose and lignin, which have an amorphous structure.[Citation30] As shown in , the major crystalline peak for each sample occurred at around a diffraction angle (2θ) of 22º, which represents the cellulose crystallographic plane (2 0 0).[Citation31] The crystallinity index was determined for the various samples and the results are summarised in . Generally, by increasing the sequence of treatments on samples, higher crystallinity index was observed, indicating the progressive removal of amorphous non-cellulosic materials and the cellulosic substances with lower crystallinity. In addition, the crystallinity of cellulosic samples maintained after acidic treatment (final stage). Sample K showed the most crystalline preparation (70.0%) among other samples and the nearest one to the control (78.7%), followed by sample J. Dilute acid has no effect on the crystalline domains, but destroys the amorphous region of the fibre. During the hydrolysis process, hydronium ions penetrate the more available amorphous regions of cellulose and allow the hydrolytic cleavage of glycosidic bonds, which finally releases individual crystallites.[Citation34] Chauhan et al.[Citation35] observed a similar behaviour for microcrystalline cellulose from cotton rages extracted by acid hydrolysis. On the other hand, the alkaline-treated sample without alcohol treatment (sample A) showed the lowest crystallinity, followed by samples B and C, suggesting a higher amount of amorphous cellulose and non-cellulosic materials in these samples, which were not removed because of the mildness of treatments. In the literature, the crystallinity indices of potato tuber cellulose, rice straw cellulose, wood cellulose, and rice husk are reported to be 66%, 68%, 71%, and 59%, respectively.[Citation30,Citation36] It can be concluded that the procedures for the preparation of samples F to K are adequate to obtain cellulose from silverskin with high crystallinity. It is known that highly crystalline fibres could be more valuable in the reinforcement of composite packaging materials. Cellulose fibres with high crystallinity show greater stiffness and rigidity, and therefore strength. Hence, it was assumed that the potential mechanical properties and reinforcing capability of treated fibres increased after sequential treatments.[Citation30]
Figure 4. X-ray diffraction patterns of the extracted cellulosic materials from coffee silverskin (samples A–K obtained by various procedures shown in )
Thermal degradation
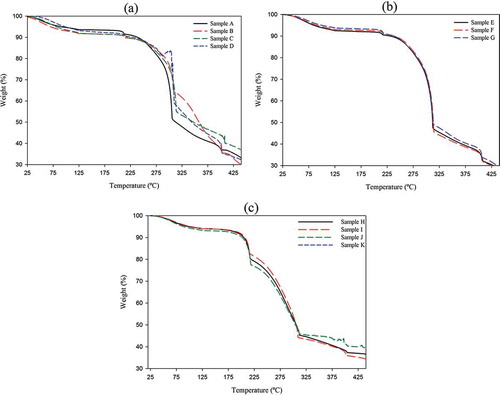
Thermogravimetric analysis (TGA) was measured to access the thermal stability of all treated CS fibres. The thermogram curves along with their derived parameters are presented as and , respectively. They corresponded to the WL of the sample upon continuous heating to 450ºC. An initial weight reduction of the fibres occurred up to about 205ºC regardless of their treatments, which is ascribed to the vaporisation of water because of the hydrophilic character of the lignocellulose fibres, and depends on the initial moisture content of the analysed sample.[Citation37] The thermal decomposition was initiated near the thermal regions of 231–226, 211–206, and 190–185ºC for A to D, E to G, and H to K samples, respectively (), indicated by increasing the sequence of treatments or at more severe treatment, the temperature in which these components started to degrade shifted to a lower temperature.[Citation31] Comparing the onset temperature of active pyrolysis of cellulose with hemicellulose, the latter was found to be less thermally stable.[Citation30] Based on the results, it was revealed that the purified samples of H to K had lower thermal stability at low temperature (initial decomposition temperature) than the others, reflecting that more damaged hemicelluloses existed as they underwent more severe conditions, which were pyrolysed at lower temperature. On the other hand, the pyrolysis of Avicel cellulose occurs at a temperature range of 280–360ºC. In this range, we observed that the extent of thermal WL decreased by an increase in the sequence of treatments and the lowest WL was found for sample K followed by J, while the highest WL occurred in sample B (). Also, the slope at the start of this range decreased on increasing the sequence of treatments from 1.61 in sample A to 0.46 in sample K, indicating the slower decomposition rate of cellulosic materials obtained from multistage treatments (). As can be seen in , the amounts of residues at temperature around 425ºC in H to K silverskin fibres were remarkably higher than the other samples with the highest value (about 40%) for the J sample. The weight fraction of material that still remained after heating above 400ºC is representative of the carbon content in the fibres.[Citation18] These results showed the residues that can endure high temperature maintained to a higher extent in samples from multistage treatments, which may be related to their higher crystallinity. The main decomposition temperature (TMDP) obtained from the derivative curves (DTG) of samples A to G was higher than 299ºC, while this parameter was below 241ºC for samples H to K, indicating TMDP of sample A to G, with less-severe treatments, may be related to amorphous cellulosic materials. The area under the main decomposition temperature peak (AMDP) in samples H to K was in the range of 76–80%, indicating that the high proportion of hemicelluloses has been degraded in these samples. The AMDP of the other prepared samples was lower than those of the H to K samples, especially in samples E, F, and G. The area under the derivative curve (ADTG) qualitatively determines the amount of the decomposed component. The ADTG of samples I, J, and K was lower than the other prepared samples (less than 68%), while the highest value was obtained in A to C samples, indicating the high thermal stability of samples with more severe extraction conditions related to the higher amount of crystalline cellulose. Sun et al.[Citation6] investigated the TGA curve of AHP-treated wheat straw sample and compared it with the TGA curve of a purified cellulosic sample extracted with 80% acetic acid–70% nitric acid (10 %v/v). They found that the TGA curves of both crude and purified celluloses started to decompose at 205°Cand 281°C, respectively, and the 50% WL from the decomposition temperature was observed at 313°C for crude cellulose and at 333°C for purified cellulose. They concluded that the purified cellulose had a higher thermal stability than the crude cellulosic sample. The results of TGA and DTG are in accordance with the FTIR and XRD results previously shown.
Table 2. Influence of different treatment methods on the thermal stability of cellulose extracted from coffee silverskin.
Figure 5. TGA curves of the extracted cellulosic materials from coffee silverskin (samples A–K obtained by various procedures shown in )
Conclusion
In the present work, isolation and purification of cellulose from CS by means of several environmental-friendly processes were studied. The four-step protocol of alkaline methanol-alkaline HP-acetic acid-peroxy acetic acid yielded the highest WL and R10, while the highest thermal stability and crystallinity index were obtained by alkaline ethanol-alkaline HP-acetic acid-peroxy acetic acid treatment. FTIR analysis agreed well with respect to the reduction of hemicellulose and lignin from CS after the extraction procedures, especially in sequentially treated samples. TG and DTG analyses showed lower total mass loss (ADTG), mass loss in the range of 280–360ºC, initial and main decomposition temperatures, slope of TG curve at 280ºC, and higher area under the main decomposition temperature peak (AMDP) for cellulose obtained from sequential treatments than those of single-step procedures, confirming the higher crystallinity of sequential treated samples. According to this research, cellulose with appropriate yield, WI, purity, crystallinity, and thermal stability could be extracted from CS using alkaline ethanol-alkaline HP-acetic acid-peroxy acetic acid procedure. We observed that the effective treatment could only be obtained at the cost of low yields; however, the high amount of silverskin production could show the reasonableness of this process.
Related Research Data
References
- Budryn, G.; Nebesny,E.; Oracz, J. Correlation Between the Stability of Chlorogenic Acids, Antioxidant Activity and Acrylamide Content in Coffee Beans Roasted in Different Conditions. International Journal of Food Properties 2015, 18, 290–302,
- Rosane, F.; Schwan, F.; Fleet, G.H. Cocoa and Coffee Fermentations. In Fermented Food and Beverages Series, Nout, M.J.R.; Sarkar, P.K.; Eds.; CRC Press: Boca raton, 2014.
- Costa, A.S.G.; Alves, R.C.; Vinha, A.F.; Barreira, S.V.P.; Nunes, M. A.; Cunha, L.M.; Oliveira, M.B.P.P. Optimization of Antioxidants Extraction from Coffee Silverskin, a Roasting by-Product, Having in View a Sustainable Process. Industrial Crops and Products 2014, 53, 350–357.
- Murthy, P.S.; Madhava Naidu, M. Recovery of Phenolic Antioxidants and Functional Compounds from Coffee Industry by-Products. Food and Bioprocess Technology 2012, 5, 897–903.
- Ballesteros, L.F.; Teixeira, J.A.; Mussatto, S.L. Chemical, Functional, and Structural Properties of Spent Coffee Grounds and Coffee Silverskin. Food and Bioprocess Technology 2014, 7, 3493–3503.
- Sun, J.X.; Sun, X.F.; Zhao, H.; Sun, R.C. Isolation and Characterization of Cellulose from Sugarcane Bagasse. Polymer Degradation and Stability 2004, 84, 331–339.
- Barana, D.; Salanti, A.; Orlandi, M.; Alia, D.S.; Zoia, L. Biorefinery Process for the Simultaneous Recovery of Lignin, Hemicelluloses, Cellulose Nanocrystals and Silica from Rice Husk and Arundo Donax. Industrial Crops and Products 2016, 86, 31–39.
- Oliveira, F.B.D.; Brasc, J.; Pimentaa, M.T.B.; Curveloa, A.A.D.S.; Belgacem, M.N. Production of Cellulose Nanocrystals from Sugarcane Bagasse Fibers and Pith. Industrial Crops and Products 2016. DOI:10.1016/j.indcrop.2016.04.064.
- Su, Y.; Du, R.; Guo, H.; Cao, M.; Wu, Q.; Su, R.; Qi, W.; He, Z. Fractional Pretreatment of Lignocellulose by Alkaline Hydrogen Peroxide: Characterization of its Major Components, Food and Bioproducts Processing 2014. DOI:10.1016/j.fbp.2014.04.001.
- Sridach, W. The Environmentally Benign Pulping Process of Non-Wood Fibers. Suranaree Journal of Science and Technology 2010, 17(2), 105–123.
- Abad, S.; Santos, V.; Parajo, J.C. Totally Chlorine-Free Bleaching of Acetosolv Pulps: A Clean Approach to Dissolving Pulp Manufacture. Journal of Chemical Technology and Biotechnology 2001, 76, 1117–1123.
- Hernández-Hernándeza, H.M.; Chanona-Pérezb, J.J.; Vegac, A.; Ligeroc, P.; Mendoza-Pérezd, J.A.; Calderón-Domínguezb, G.; Terrése, E.; Farrera-Rebollo, R.R. Acetosolv Treatment of Fibers from Waste Agave Leaves: Influence of Process Variables and Microstructural Study. Industrial Crops and Products 2016, 86, 163–172.
- AOAC. Official Methods of Analysis; Association of Official Analytical chemists: Arlington, 2005.
- Bligh, E.G.; Dyer, W.J. A Rapid Method of Total Lipid Extraction and Purification. Canadian Journal of Biochemistry 1959, 37, 911–917.
- Brendel, O.; Iannetta, P.P.M.; Stewart, D. A Rapid and Simple Method to Isolate Pure Alpha-cellulose. Phytochemical Analysis 2000, 11, 7–10.
- Technical Committee ISO/TC, Cellulose in Dilute Solutions; Determination of Limiting Viscosity Number. Pt. 1: Method in cupriethylene- diamine (CED) solution. In Paper, Board and Pulps, 1st edn. International Organization for Standardization; Geneva, 1981; 11.
- Renard, C.M.; Rohou, Y.; Hubert, C.; Della Valle, G.; Thibault, J.F.; Savina, J.P. Bleaching of Apple Pomace by Hydrogen Peroxide in Alkaline Conditions: Optimisation and Characterization of the Products. LWT-Food Science and Technology 1997, 30, 398–405.
- Ouajai, S.; Shanks, R.A. Composition, Structure and Thermal Degradation of Hemp Cellulose after Chemical Treatments. Polymer Degradation and Stability 2005, 89, 327–335.
- Borrelli, R.C.; Esposito, F.; Napolitano, A.; Ritieni, A.; Fogliano, V. Characterization of a New Potential Functional Ingredient: Coffee Silverskin. Journal of Agricultural and Food Chemistry 2004, 52, 1338–1343.
- Sun, R.C.; Tomkinson, J.; Ma, P.L.; Liang, S.F. Comparative Study of Hemicelluloses from Rice Straw by Alkali and Hydrogen Peroxide Treatments. Carbohydrate Polymer 2000, 42, 111–122.
- Fang, J.M.; Sun, R.C.; Tomkinson, J. Isolation and Characterization of Hemicelluloses and Cellulose from Rye Straw by Alkaline Peroxide Extraction. Cellulose 2000, 7, 87–107.
- Jahan, M.S.; Lee, Z.Z.; Jin, Y. Organic Acid Pulping of Rice Straw. I: Cooking. Turkish Journal of Agriculture and Forestry 2006, 30, 231–239.
- Sun, X.F.; Sun, R.C.; Tomkinson, J.; Baird, M.S. Isolation and Characterization of Lignins, Hemicelluloses, and Celluloses from Wheat Straw by Alkaline Peroxide Treatment. Cellulose Chemistry and Technology 2003, 37, 283–304.
- Correia, J.A.; Júnior, J.E.; Gonçalves, L.R.; Rocha, M.V. Alkaline Hydrogen Peroxide Pretreatment of Cashew Apple Bagasse for Ethanol Production: Study of Parameters. Bioresource Technology 2013, 139, 249–56.
- Chunilall, V.; Bush, T.; Larsson, P.T.; Iversen, T. Supra-Molecular Structure and Chemical Reactivity of Cellulose I Studied Using CP/MAS 13C-NMR. In Cellulose- Fundamental Aspects; van de Ven, T.; Godbout, L.; Eds.; In Tech: Manhattan, New York. 2013.
- Aider, M.; Martel, A.A.; Ferracci, J.; de Halleux, D. Purification of Whole Brown Flaxseed Meal from Coloring Pigments by Treatment in Hydrogen Peroxide Solutions: Impact on Meal Color. Food Bioprocess and Technology 2011, 5, 3051–3065.
- Šereš, Z.; Gyura, J.; Filipovi, N.; Šoronja Simovi, D. Application of Decolorization on Sugar Beet Pulp in Bread Production. European Food Research and Technology 2005, 221(1–2), 54–62.
- Schwanninger, M.; Rodrigues, J.C.; Pereira, H.; Hinterstoisser, B. Effects of Short Time Vibratory Ball Milling on the Shape of FT-IR Spectra of Wood and Cellulose. Vibrational Spectroscopy 2004, 36, 23–4.
- Salmén, L.; Åkerholm, M.; Hinterstoisser, B. Two-Dimensional Fourier Transform Infrared Spectroscopy Applied to Cellulose and paper. In Polysaccharides, Structural Diversity and Functional Versatility; Dumitriu, S.; Ed. 2nd ed.; Marcel Dekker: New York, 2005; 159–187.
- Johar, N.; Ahmad, I.; Dufresne, A. Extraction, Preparation and Characterization of Cellulose Fibres and Nanocrystals from Rice Husk. Industrial Crops and Products 2012, 37(1), 93–99.
- Rosa, S.M.L.; Rehman, N.; de Miranda, M.I.G.; Nachtigall, S.M.B.; Bica, C.I.D. Chlorine Free Extraction of Cellulose from Rice Husk and Whisker Isolation. Carbohydrate Polymer 2012, 87(2), 1131–1138.
- Peredo, K.; Escobar, D.; Vega-Lara, J.; Berg, A.; Pereira, M. Thermochemical Properties of Cellulose Acetate Blends with Acetosolvand Sawdust Lignin: A Comparative Study. International Journal of Biological Macromolecule 2016, 83, 403–409.
- Yan, L.; Zhao, Y.; Gu, Q.; Li, W. Isolation of Highly Purity Cellulose from Wheat Straw using a Modified Aqueous Biphasic System. Frontiers of Chemical Science and Engineering 2012, 6(3), 282–291.
- Lima, M.M.S.; Borsali, R. Rod-like Cellulose Microcrystal: Structure, Properties, and Applications. Macromolecular Rapid Communications 2004, 25, 771–787.
- Chauhan, Y.P.; Sapkala, R.S.; Sapkala, V.S.; Zamre, G.S. Microcrystalline Cellulose from Cotton Rags (waste from garment and hosiery industries). International Journal of Chemical Science 2009, 7(2), 681–688.
- Abe, K.; Yano, H. Comparison of the Characteristics of Cellulose Microfibril Aggregates of Wood, Rice Straw and Potato Tuber. Cellulose 2009, 16, 1017–1023.
- Rayón,E,; Ferrandiz, S.; Rico, M.I.; López, J.; Arrieta. M.P. Microstructure, Mechanical, and Thermogravimetric Characterization of Cellulosic By-Products Obtained from Biomass Seeds. International Journal of Food Properties 2015, 18(6), 1211–1222.