
ABSTRACT
Three hundred twenty honey samples were collected from Ethiopia, and categorized into nine monofloral honeys using melissopalynology. Theses monofloral honeys were investigated for their sugar profile, physicochemical properties, and quality of honeys. Sugars (fructose, glucose, sucrose, maltose, turanose, and isomaltose) were identified using high-performance liquid chromatography and physicochemical properties (moisture, water activity, pH, acidity, ash, minerals, conductivity, colour) using the Harmonized Method of the International Honey Commission. Moisture and water activity showed a strong regression coefficient (r2 = 0.92). Moisture content alone did not sufficiently describe the quality of honey during storage and processing.
Introduction
Honey has a viscous aromatic property. The synthesis of honey begins with sucking nectar from flowers. Nectar is mostly water with dissolved sugars. The amount of sugars varies greatly based on floral origin and environment.[Citation1] Nectar passes through physical and chemical processes to ripen as honey. This process is responsible for modifying sugars and the physical properties of honey. Carbohydrates are among the most abundant compounds found in nature that provide the human body with heat and energy. The analysis of sugars and sugar-containing foods is of significant and growing interest in the area of food science, nutrition, and food industry. The sugar composition of honey is accountable for many of the nutritional, physicochemical, and sensory properties of honey such as energy value, crystallization, viscosity, hygroscopicity, humectancy, miscibility, spreadability, sweetness, flavour, and colour.[Citation2] The merits of physical properties of honey are mainly generated from moisture and water activity (aw), pH and acidity, ash and mineral, electrical conductivity, and colour.[Citation3]
Honey consists of different types of sugars, of which fructose and glucose are the main contributors.[Citation4] The content of sucrose in honey depends on the degree of ripeness.[Citation5] High content of sucrose is an indication for an early harvest of the honey, i.e. a product in which the sucrose has not been fully transformed into glucose and fructose by the action of invertase. Generally, the sucrose content of honey should not exceed 5% for reliable honey samples.[Citation6] Water, next to sugar, is the second major component of honey. The stability of food is affected by moisture, which is mainly related to aw of a product. For example, peanut oil deteriorates if the moisture content exceeds 0.6%, whereas other foods, like honey, are stable at relatively high moisture contents (20%). It is not only the effect of moisture but also aw needs to be considered for the safety of the food.[Citation7]–[Citation9]
Colour is one of the physical properties of honey perceived most immediately by consumers. It is used as a critical factor for the acceptance of honey. In addition, the value of honey is related with its colour. The colour of honey varies with botanical origin, age, and storage conditions.[Citation10],[Citation11] A standard method of colour determination is required to define the botanical origin and quality of honey. Honey can be described using Commission Internationale d’Eclairage (CIE) L*a*b* method. The CIE L*a*b* colour space is an international standard for colour measurements, adopted by the CIE in 1976.[Citation12],[Citation13] In the CIE L* a* b* colour determination, L* indicates the degree of lightness that ranges from darkness (0) to lightness (+ 100); a* denotes the degree of redness that ranges from greenness (–80) to redness (+100), positive a* is red and negative a* is green; b* denotes the degree of yellowness that ranges from blueness (–80) to yellowness (+70), positive b* is yellow and negative b* is blue.[Citation14]
Several studies have been undertaken based on the country of origin of honey such as Argentinean,[Citation15] Slovenia,[Citation16] Indian,[Citation14] South African,[Citation17] and Galician[Citation18] honey. Honey properties predominantly varied depending on botanical origin. Likewise, the property of one monofloral honey is different from the other based on floral origin.[Citation1,Citation19] The purpose of this study was, therefore, to investigate the property of monofloral honeys with the focus on: sugar profile of monosaccharide (fructose and glucose) and disaccharide (sucrose, maltose, isomaltose, and turanose) sugars, using HPLC-Refractive Index (HPLC-RI); physical properties; and evaluate the degree of regression between aw and moisture content of honeys.
Materials and methods
Honey samples
Three hundred and twenty honey samples of Apis mellifera were collected between May 2014 and March 2015 from beekeepers apiary: Sheka (Masha and Andracha), Bonga (Chena and Gwata), Guji-Uraga, Illubabor (Becho and Yayu), Bale (Dello Mena and Angetu), Addis Ababa, Tigray (Wukro and Mayichew), and Amhara (Lalibella and Wag-Himra-Ziqualla). Honey was separated from other derbies as stated by Belay et al. (2017)[20] and stored at < 4°C until analysis.
Botanical origin of honey was determined using harmonized methods of melissopalynology.[21] Melissopalynology analysis categorized honey samples into nine monofloral honeys, namely Acacia, Becium grandiflorum, Croton macrostachyus, Eucalyptus globulus, Hypoestes, Leucas abyssinica, Schefflera abyssinica, Syzygium guineense, and Vernonia amygdalina. These monofloral honeys were used to examine the sugar profile and the physicochemical properties of honey.
Sugar analysis
Reagents and equipment
D(-)fructose (Sigma Aldrich, Lot 092K0137, EC No: 200-333-3), D-(+)-glucose (Sigma Aldrich, EC No: 20110425), sucrose (Sigma Aldrich, S-8501 Lot 84H0557), D-(+)-maltose monohydrate (TCI Lot. VW6L-BG, M0037), D-(+)-turanose (Sigma Aldrich, BCBL4040V), and isomaltose (TCI Lot. L6N8K-GH, I0231) standards; methanol, acetonitrile, and water (all HPLC grade (J.T. Baker, Avantor) were used in this study.
Sonicator (Branso Ultrasonics 5510E-DTH, U.S.A.), membrane filter (Whatman nylon 0.45 μm membrane filter, 7404-004, G3620153, U.K.), syringe (HSW Henk Sass Wolf GmbH), vials (Agilent, 8010-0014, U.S.A.), HPLC with RI-detector thermo-stated at 30°C, column (Zorbax Carbohydrate analysis column 4.6 x 250 mm, 5 micron), and sensitive balance were used. Acetonitrile and water (75: 25 v/v) were mixed, sonicated, and used as the mobile phase.
Preparation of standards
Sugar standards (fructose, glucose, sucrose, maltose, turanose, and isomaltose) were prepared using five level serial dilutions, based on International Honey Commission (IHC) determination of sugars by HPLC,[Citation22] with some modification. Each standard solution of fructose (1 g), glucose (0.75 g), sucrose (0.125 g), maltose (0.075 g), turanose (0.075 g), and isomaltose (0.075 g) was dissolved in 20 mL of HPLC-grade water (HPLC grade, J.T. Baker, Avantor). A total of 12.5 mL methanol (HPLC grade, J.T. Baker, Avantor) was transferred into a 50 mL calibrated flask. Then a standard solution was poured into a flask containing methanol, and filled to the mark with HPLC-grade water. This solution was filtered through a 0.45-μm nylon membrane filter (196–2045, U.S.A.) syringe and the filtrate was poured into a sample vial (Agilent, 8010-0014, U.S.A.) for injection.
HPLC conditions
Flow rate: 1.5 mL/min; mobile phase: acetonitrile: water (75:25, v/v); column and detector temperature: 30 °C; and sample volume: 20 μL were used for HPLC separation. Peaks were identified on the basis of their retention times.
Sample preparation
Honey sample (2.5 g) was weighed into a beaker and dissolved in 20 mL of HPLC-grade water. A total of 12.5 mL of methanol was pipetted into a 50 ml volumetric flask and the honey solution was quantitatively transferred into the flask and then filled to the mark with HPLC-grade water. After that, the honey solution was filtered through a nylon membrane filter syringe and poured in the sample vial.
Analysis of physicochemical properties
Moisture content
The moisture content of monofloral honeys was determined using ATAGO’s Abbe Refractometer (Atago NAR-Series, Tokyo, Japan) at 20°C with a temperature correction to compensate, when the sample temperature was different from 20°C. The RI of distilled water (1.3330) was used as a reference. After the measurement of four honey samples (eight measurements), the instrument was rechecked with the RI of distilled water for any drift. The RI reading was converted to moisture content (g/100 g) using AOAC, Table 969.38.[Citation23]
A regression graph of RI and moisture was used to interpret the moisture content of each monofloral honey. A strong negative relation was observed between RI and moisture content with a regression equation of y = –0.0026x + 1.5374 and a regression coefficient of r2 = 0.999. The honey samples were preheated to liquefy in oven sealed containers and cooled down to room temperature.[Citation16,Citation22] Then crystallized honeys were liquefied in an incubator (ca. 50°C) without loss of water.[Citation24] Hence, the RI was determined in clear liquid honeys.
Water activity, aw
The water activity of honey was measured at 25 ± 0.2°C using LabMaster-aw (CH8853 Lachen, Novasina, Switzerland).[Citation24] The time span for the measurement was fixed at 5 min. In order to speed up measurement time, honey samples in plastic sample holders were first equilibrated at 25°C by placing them in an incubator (BOD Incubator, HN-BI025, Hankuk Scientific Technology, co. Kyonggi, S. Korea). All aw determinations were performed in replicate and the results were expressed as mean ± standard deviation.
Free acidity and pH
Free acid (meq of acid/1000 g) of monofloral honey was determined by dissolving honey sample (10 g/75 mL distilled water) and titrating with standardized 0.1 M NaOH to a pH of 8.3. pH was determined using a pH meter (Consort C861, Belgium) after calibration with standard buffer solutions of pH 4, 7, and 10.[Citation22]
Ash and minerals
Ash was determined according to the AOAC (1990) method 920.181[Citation23] adopted by the harmonized method of the IHC[Citation22] using a hot plate for carbonization and ashing in a muffle furnace at 600°C. The ash dish was heated in an electrical furnace at an ashing temperature of 600°C and then cooled in a desiccator to room temperature, and the mass was measured. Approximately 10 g of honey sample was weighed in an ash dish and two drops of ashless olive oil were added. The sample was carbonized using a hot plate and Bunsen Burner approximately at 300°C and 400°C, respectively. Then the carbonized sample was ashed in a muffle furnace at 600°C until the ashing process was complete.
Mineral (Na and K) contents of monofloral honey were determined using Flame Photometer (Jenway, PFP7, U.K., Bibby Scientific Ltd, Staffordshire), based on the works of Aazza et al. (2013)[Citation25] with some modifications. Before sample analysis, the atomizer system was flushed thoroughly with distilled water and the instrument was calibrated to zero using distilled water. Distilled water was used between each analyte to make the instrument zero and avoid any source of contamination between samples. Propane gas was used as the burner fuel.
For mineral analysis, a calibration curve was constructed for Na. Around 0.5082 g of NaCl was weighed and diluted in 100 mL distilled water, which is equivalent to 2g Na/L stock solution. Working standard solutions for the calibration curve of Na were prepared by serial dilution of 2 g Na/L. For K, 0.19 g KCl was weighed and diluted in 100 mL distilled water, which is equivalent to 100 mg K/L. Working standard solutions, for the calibration curve of K, were prepared by serial dilution of 100 mg K/L stock solution. Na and K were measured at a wavelength of 589 nm and 766 nm, respectively. The flow rate was adjusted to 2 mL/min to supply standards for the flame photometer. Honey sample (3 g) was diluted in 100 mL distilled water and introduced to the flame photometer through a sample capillary tube at an aspirating rate of 2 mL/min, similar to the standards.
Electrical conductivity
The electrical conductivity of monofloral honeys was determined using a conductivity meter (LF 90, Wise Tech. Werkstatten D821 Weilheim, Germany). Anhydrous honey sample equivalent to 20 g was dissolved in 100 mL distilled water. The beaker containing the anhydrous honey solution was placed inside a thermostat-controlled water bath (GFL Labortechnikmbh D3006 Burgwedel) at 20°C as described in the Harmonized IHC method.[Citation22] Conductance was calculated in mS/cm as follows:
where SH is the electrical conductivity of the honey solution (mS/cm), K is the cell constant in cm−1, and G is conductance (mS).
Colour
The colour of monofloral honey was determined based on the measurement of CIE L*a*b* using a Minolta Chroma meter (CR-200, Camera, Japan 79003206). The Chromameter was calibrated using a standard Minolta calibration plate (white plate, No. 19033060; CIE L*94.39, a*-0.31, b*+0.31) prior to testing. After the measurement of six honey samples (12 measurements), the Minolta Chroma meter reading was verified with a Minolta calibration plate for any drift. The CIELAB colour was expressed as L* lightness/darkness, a* as red/green, and b* as yellow/blue.[Citation10]
Statistical analysis
Statistical analysis was carried out using ANOVA, by SAS, 2002. Mean significant difference was compared using Duncan’s multiple range test (DMRT). Pearson correlation analysis was conducted to determine the associations between the physical properties of honey.
Result and discussion
Sugar
Sugar is the major component that governs honey property and its content is firmly related to the degree of maturity and botanical origin of honey. The results of six sugars, namely fructose, glucose, sucrose, maltose, turanose, and isomaltose, are presented in . The maximum concentration of fructose (43.1 ± 0.4 g/100 g) was found in Acacia honey and the minimum (35 ± 4 g/100 g) in Becium grandiflorum. A significant difference (p < 0.01) was observed between Acacia and the other monofloral honeys in fructose content. The maximum glucose content was found in Leucas abyssinica (37.2 ± 0.4 g/100 g) and the minimum in Becium grandiflorum (29 ± 3 g/100 g). A significant difference (p < 0.01) was observed between Leucas abyssinica and the other monofloral honeys in glucose content. The present study showed that the mean total sugar content of honey ranged from 72.4 to 79.7 g/100g honey, of which the monosaccharide sugars were dominant. Among the monosaccharide sugars, the fructose content was found to be higher than that of glucose. This is in agreement with the findings of other researchers on monofloral honeys.[Citation26,Citation27] The higher concentration of fructose found in Acacia honey could be used as an indicator for Acacia honey. This was in line with the findings of León‐Ruiz et al. (2011)[Citation28] that the sugar composition had discriminant capacity as markers of honey. Glucose was the second most abundant sugar in this finding. Similar values were also reported for glucose by different researchers.[Citation27,Citation29,Citation30] Contrary to this, the findings of Münstedt et al.[Citation31] and Swallow & Low[Citation32] described that in rape/canola honeys, the composition of glucose was higher than that of fructose.
Table 1. Sugar composition (g/100g) mean ± SD for monofloral honeys.
Sucrose is an essential sugar for honey quality detection and screening. The contribution of sucrose to the total sugar in honeys can be increased, if honey is harvested before ripening. During the ripening process, in the cell combs, the sucrose level is reduced by the action of the enzyme invertase.[Citation6] The highest concentration of sucrose (2.8 ± 0.7 g/100 g) was found in Becium grandiflorum and the lowest (1.1 ± 0.1 g/100g) in Syzygium guineense. A significant difference (p < 0.01) was observed between Becium grandiflorum and the other monofloral honeys in sucrose content. Sucrose was found to be the third most dominant sugar in Ethiopian monofloral honeys. In this study, a lower level of sucrose was observed compared to the maximum limit (5 g/100 g honey) of Codex Alimentarius (CA), European Union (EU), and Ethiopian standards.[Citation6]
Maltose, isomaltose, and turanose are reducing sugars.[Citation33] The maltose content ranged from 0.6 ± 0.3 (Schefflera abyssinica) to 2.0 ± 0.5 g/100 g (Eucalyptus globulus). A significant difference (p < 0.01) was observed between Eucalyptus globulus and the other monofloral honeys, except (p > 0.01) for Syzygium guineense and Becium grandiflorum. The content of turanose ranged from 0.33 ± 0.36 (Schefflera abyssinica) to 1.7 ± 0.4 g/100 g (Eucalyptus globulus). A significant difference (p < 0.01) was also observed between Eucalyptus globulus and the other monofloral honeys. Isomaltose content of Ethiopian monofloral honey ranged from 0, which was not detected (Schefflera abyssinica), to 1.5 ± 1.0 g/100 g (Becium grandiflorum). A significant difference (p < 0.01) was observed between Becium grandiflorum and the other monofloral honeys. Maltose, turanose, and isomaltose were found in all monofloral honeys. The value of maltose was in agreement with the report of Ouchemoukh et al.[Citation27], and the results of turanose and isomaltose were also similar to the findings of Ouchemoukh et al.[Citation27] and De la Fuente.[Citation34] Isomaltose could be used as a marker for Schefflera abyssinica honey.
Physical properties
Moisture is the second most important constituent of honey. It is largely influenced by geographical position from where the nectar and pollen-producing plant and the bee colony was found, degree of maturity in the hive, botanical origin of honey, and harvesting techniques.[Citation5] The moisture content and aw values of monofloral honeys are presented in . The highest moisture (20.54 ± 1.28) and aw (0.60 ± 0.02) were observed in Schefflera abyssinica and the lowest moisture (14.14 ± 0.19) and aw (0.48 ± 0.01) in Eucalyptus globulus. A significant difference (p < 0.01) was observed between Schefflera abyssinica and the other monofloral honeys in moisture and aw (). The aw value was similar to the value of Portuguese honey (0.50 ± 0.01), and related to the shelf life of honey.[Citation35] In terms of stability, Eucalyptus globulus honey showed superior property than other monofloral honeys. This could be due to its lower aw level.
Table 2. Moisture content, aw, pH, and free acid, electrical conductivity, value (mean ± SD) of monofloral honeys.
Foods with higher levels of monosaccharide units have a higher level of aw kinetics. Higher proportion of fructose and glucosein honey makes water molecules unavailable for the growth of microorganism, as the monosaccharide units bind water. Honey industries considered moisture alone as a key feature for the spoilage, stability, and storage behaviour of honey. Standard authorities also exclusively considered moisture as a quality parameter. Moisture content alone cannot reasonably govern the growth and multiplication of microorganisms. aw plays a better role in the quality of honey.[Citation15] The aw value ranges from 0 to 1. If the value of aw is down to 0.61/0.62 and below it limits the growth of microorganisms, including osmo-tolerant yeast. The findings of this study indicated that all Ethiopian monofloral honeys have a lower tendency of spoilage by microorganisms, and are free from the risk of fermentation.[Citation36]
The acidic nature of honey was reported by different authors.[Citation5,Citation37] pH and free acid values for monofloral honeys are presented in . The pH value ranged from 4.6 ± 0.1 (Eucalyptus globulus) to 3.4 ± 0.1 (Hypoestes). The findings of this study indicated that all monofloral honeys showed an acidic property. A significant difference (p < 0.01) was observed between Eucalyptus globulus and the other monofloral honeys in pH value. The free acid content of Ethiopian monofloral honey ranged from 55 ± 7 (Croton macrostachyus) to 20 ± 0 meq/kg (Hypoestes). Croton macrostachyus was significantly different (p < 0.01) from other monofloral honeys in free acid value. The pH and free acid values, in this study, were in agreement with the findings of Thymus capitatus (L.) honey.[Citation38]
The ash and mineral (Na and K) contents of monofloral honeys are presented in . The ash content ranged from 0.2 ± 0.1 (Hypoestes) to 0.39 ± 0.04 g/100g (Croton macrostachyus). A significant difference (p < 0.01) was observed between Croton macrostachyus and the other monofloral honeys in their ash content, except (p > 0.01) for Vernonia amygdalina and Syzygium guineense. Hypoestes honey was also significantly different (p < 0.01) from the other honeys, except (p > 0.01) for Leucas abyssinica, Schefflera abyssinica, and Acacia. The mean ash content of Ethiopian monofloral honeys was quite low and was within the accepted range of CA, EU, and Ethiopian standards. The maximum limit for ash content in honey is 0.6 g/100 g.[Citation6] Na and K are the principal minerals found in honey.[Citation39] The K level of monofloral honeys ranged from 1136 ± 5 (Eucalyptus globulus) to 272 ± 10 mg/kg (Hypoestes). A significant difference (p < 0.01) was observed between Eucalyptus globulus and the other monofloral honeys in the K content. The level of K reported in this study was in agreement with the findings from the different honey plants in Northern India[Citation40] and the north/south provenance of Argentina.[Citation41] The maximum level (15.4 ± 0.3 mg/kg) of Na was observed in Leucas abyssinica and the minimum (12.6 ± 0.1 mg/kg) in Schefflera abyssinica. A significant difference (p < 0.01) was observed between Leucas abyssinica and the other monofloral honeys, except (p > 0.01) for Vernonia amygdalina. The level of Na, in this study, was in harmony with the results of Rape polish honey.[Citation42]
Electrical conductivity is among the various parameters used to authenticate the floral origin of honeys. It is used to distinguish between floral and honeydew honeys. Electrical conductivity was recently included in the international standards.[Citation6] The result of the electrical conductivity of monofloral honeys is presented in . The highest value (0.58 ± 0.02 mS/cm) of electrical conductivity was observed in Vernonia amygdalina and the lowest (0.14 ± 0.00 mS/cm) in Hypoestes. The electrical conductivity of Vernonia amygdalina was significantly different (p < 0.01) from the other monofloral honeys. The results of this finding indicated that all the monofloral honeys were found to have floral honey property with an electrical conductivity value of < 0.8 mS/cm. Electrical conductivity of Ethiopian monofloral honey was in line with the result of Lithuanian honey.[Citation43]
The Lab colour, minimum and maximum colour distribution, is presented in a scattered plot (). The CIE L*a*b* mean ± SD value and their significant differences between monofloral honeys are shown in . Depending on their statistical difference and similarities between monofloral honeys, the L* (lightness) values were grouped into three classes of significant level (a,b,c) (). The lightest colour (56.3 ± 0.4) was observed for Hypoestes. A significant difference (p < 0.01) was observed between Hypoestes and Croton macrostachyus, Syzygium guineense and Eucalyptus globulus, and similarities (p > 0.01) with other monofloral honeys in their colour. The highest a* (redness) value was registered for Croton macrostachyus (1.6 ± 0.7) and the lowest for Acacia (–0.45 ± 0.01). Croton macrostachyus was significantly different (p < 0.01) from all the other monofloral honeys (). The highest b* (yellowness) value (12 ± 2) was also observed for Croton macrostachyus and the lowest (0.8 ± 0.2) for Hypoestes. A significant difference (p < 0.01) was observed between Croton macrostachyus and the other types of honey.
Table 3. L*a*b* colour value (mean ± SD) of monofloral honey (n = 36).
Figure 1. Scattered plot for minimum and maximum values of L*a*b* colour.
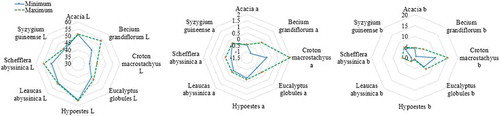
The findings of this study (a* = –0.45 ± 0.01 and b* = 4.6 ± 0.1) were closely related to the results of Acacia honey (a* = 0.6 ± 0.2 and b* = 3.5 ± 2.2) measured using CR-200 Minolta Chroma Meter.[Citation12] The b* value (6.4 ± 0.7) for Eucalyptus globulus honey was in close proximity to the value (0.8–7.7) reported from the colour of 17 European unifloral honey.[Citation13] Hypoestes, Schefflera abyssinica, Acacia, Leucas abyssinica, Becium grandiflorum, Syzygium guineense, and Eucalyptus globulus were found to be light honey and Croton macrostachyus was relatively dark. All monofloral honeys showed a lower value of a*. This result indicated that the honey samples inclined to green than red colour. In addition, all honey samples, in this study, showed positive b* values and inclined to yellow colour, not blue.
Correlation between the physical properties of monofloral honey
Pearson correlations for moisture, electrical conductivity, ash, pH, and free acid are presented in . Significant (p < 0.01) correlations were observed between ash and electrical conductivity (r = 0.689); free acid and electrical conductivity (r = 0.752); and ash and free acid (r = 0.640) of Ethiopian monofloral honeys. The measurement of electrical conductivity depends on the ash and acid contents of the honey. The higher the ash and acid content, the higher the resulting conductivity. This was in agreement with the work carried out in northwest of Portugal.[Citation44] The correlation between ash and free acid, in this study, was in line with the findings of Portuguese honey (r = 0.75).[Citation35] A plot of aw versus % moisture content of monofloral honeys used to make the linear regression graph is presented in . The regression equation for this line is
Table 4. Correlation among moisture, aw, electrical conductivity, ash, pH, and free acid.
Figure 2. Correlation between aw (25°C) and % moisture (20°C) in fluid monofloral honeys (n = 36).
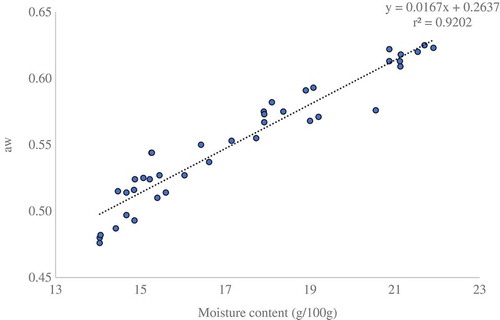
The measure of the goodness of fit, which is used for the coefficient of determination, was found to be r2 = 0.92, indicating the regression model fits the data reasonably in the moisture range of 14.14 ± 0.19 to 20.54 ± 1.28. The goodness of fit result obtained by linear regression analysis was in agreement with the findings of Chirife et al.[Citation15] Water in food can be found as free water and bound water (attached with solutes). The higher linear regression (r2 = 0.92) for moisture and aw indicated that without considering aw, the grading of honey based on moisture content cannot properly address the quality status of honey. Thus, examination of honey using aw is the most important factor for the stability of honey.[15,24,29,45]
Conclusion
In this study, nine monofloral honeys were investigated for sugar contents, physicochemical properties, and mineral levels. Fructose was the dominant sugar in all monofloral honeys. The sugar level was above the minimum limit of EU, CA, and Ethiopian standards. The physical properties and mineral levels of monofloral honeys varied significantly (p < 0.01) by floral origin. A strong significant (p < 0.01) correlation was observed between the moisture content and aw. In order to confirm the safety, relative shelf life, survival of microorganism, and overall quality of honey, standard authorities should not only focus on the moisture content of the honey, but also include aw as a quality parameter in international and national standard agencies.
Acknowledgements
We would like to thank SNV Ethiopia, GIZ-SLM, MELCA Ethiopia for their logistic support; Korean Food Research Institute (KFRI), Fulda University of Applied Sciences, and Holetta Bee Research Center for laboratory service; Dr Jurgen Greiling and Professor Mooha Lee for coordinating the field and laboratory works; and Myunghee Lee and Hirut Abebe for assisting in the lab work.
Related Research Data
References
- Olaitan, P.B.; Adeleke, O.E.; Iyabo, O.O. Honey: A Reservoir for Microorganisms and An Inhibitory Agent for Microbes. African Health Sciences 2007, 7(3), 159–165.
- Karasu, S.; Toker, O.S.; Yilmaz, M.T.; Karaman, S.; Dertli, E. Thermal Loop Test to Determine Structural Changes and Thermal Stability of Creamed Honey: Rheological Characterization. Journal of Food Engineering 2015, 150, 90–98.
- Senyuva, H.Z.; Gilbert, J.; Silici, S.; Charlton, A.; Dal, C.; Gürel, N.; Cimen, D. Profiling Turkish Honeys to Determine Authenticity using Physical and Chemical Characteristics. Journal of Agricultural and Food Chemistry 2009, 57(9), 3911–3919.
- Alvarez-Suarez, J.M.; González-Paramás, A.M.; Santos-Buelga, C.; Battino, M. Antioxidant Characterization of Native Monofloral Cuban Honeys. Journal of Agricultural and Food Chemistry 2010, 58(17), 9817–9824.
- Belay, A.; Solomon, W.K., Bultossa, G.; Adgaba, N.; & Melaku, S. Physicochemical Properties of the Harenna Forest Honey, Bale, Ethiopia. Food Chemistry 2013, 141(4), 3386–3392.
- Bogdanov, S.; Lüllmann, C.; Martin, P.; von der Ohe; W., Russmann, H.; Vorwohl, G.; Oddo, L.P., Sabatini, A.G., Marcazzan, G.L., Piro, R.; Flamini C. Honey Quality and International Regulatory Standards: Review by the International Honey Commission. Bee World 1999, 80(2), 61–9.
- Venturi, L.; Rocculi, P.; Cavani, C.; Placucci, G.; Rosa, M.D.; Cremonini, M.A. Water Absorption of Freeze-dried Meat at Different Water Activities: A Multianalytical Approach using Sorption Isotherm, Differential Scanning Calorimetry, and Nuclear Magnetic Resonance. Journal of Agricultural and Food Chemistry 2007, 55(26), 10572–10578.
- Fellows, P.J. Food Processing Technology: Principles and Practice; Woodhead Publishing Limited: Cambridge, England, 2009; 44–49.
- Lavelli, V.; Kerr, W.; Sri Harsha, P.S.C. Phytochemical Stability in Dried Tomato Pulp and Peel as Affected by Moisture Properties. Journal of Agricultural and Food Chemistry 2013, 61(3), 700–707.
- González-Miret, M.L.; Terrab, A.; Hernanz, D.; Fernández-Recamales, M.Á.; Heredia, F.J. Multivariate Correlation between Color and Mineral Composition of Honeys and by Their Botanical Origin. Journal of Agricultural and Food Chemistry 2005, 53(7), 2574–2580.
- Belay, A.; Solomon, W.K., Bultossa, G.; Adgaba, N.; Melaku, S. Botanical Origin, Colour, Granulation, and Sensory Properties of the Harenna Forest Honey, Bale, Ethiopia. Food Chemistry 2015, 167, 213–219.
- Popek, S. A procedure to Identify a Honey Type. Food Chemistry 2002, 79(3), 401–406.
- Tuberoso, C.I.G.; Jerković, I.; Sarais, G.; Congiu, F.; Marijanović, Z.; Kuś, P.M. Color Evaluation of Seventeen European Unifloral Honey Types by Means of Spectrophotometrically Determined CIE Chromaticity Coordinates. Food Chemistry 2014, 145, 284–291.
- Saxena, S.; Gautam, S.; Sharma, A. Physical, Biochemical and Antioxidant Properties of Some Indian Honeys. Food Chemistry 2010, 118(2), 391–397.
- Chirife, J.; Zamora, M.C.; Motto, A. The Correlation between Water Activity and % Moisture in Honey: Fundamental Aspects and Application to Argentine Honeys. Journal of Food Engineering 2006, 72(3), 287–292.
- Abramovič, H.; Jamnik, M.; Burkan, L.; Kač, M. Water Activity and Water Content in Slovenian Honeys. Food Control 2008, 19(11), 1086–1090.
- Serem, J.C.; Bester, M.J. Physicochemical Properties, Antioxidant Activity and Cellular Protective Effects of Honeys from Southern Africa. Food Chemistry 2012, 133(4), 1544–1550.
- Gómez-Díaz, D.; Navaza, J.M.; Quintáns-Riveiro, L.C. Physicochemical Characterization of Galician Honeys. International Journal of Food Properties 2012, 15(2), 292–300.
- Meli, M.A.; Desideri, D.; Roselli, C.; Feduzi, L.; Benedetti, C. Radioactivity in Honey of the Central Italy. Food Chemistry 2016, 202, 349–355.
- Belay, A.; Haki, G.D.; Birringer, M.; Borck, H.; Addi, A; Baye, K; Melaku, S. Rheology and Botanical Origin of Ethiopian Monofloral Honey. LWT-Food Science and Technology 2017, 75, 393–401.
- Ohe, W.V.D.; Oddo, L.P.; Piana, M.L.; Morlot, M.; Martin, P. Harmonized Methods of Melissopalynology. Apidologie 2004, 35, S18–S25.
- Bogdanov, S. Harmonised Methods of the International Honey Commision; IHC World Network of Honey Science, 2009, 5, 1–62.
- AOAC. Official Methods of Analysis of AOAC International. (15th ed) Association of Official Analysis Chemists International, USA. 1990
- Gleiter, R.A.; Horn, H.; Isengard, H.D. Influence of Type and State of Crystallisation on the Water Activity of Honey. Food Chemistry 2006, 96(3), 441–445.
- Aazza, S.; Lyoussi, B.; Antunes, D.; Miguel, M.G. Physicochemical Characterization and Antioxidant Activity of Commercial Portuguese Honeys. Journal of Food Science 2013, 78(8), C1159–C1165.
- De La Fuente, E.; Ruiz-Matute, A.I.; Valencia-Barrera, R.M.; Sanz, J.; Castro, I.M. Carbohydrate Composition of Spanish Unifloral Honeys. Food Chemistry 2011, 129(4), 1483–1489.
- Ouchemoukh, S.; Schweitzer, P.; Bey, M.B.; Djoudad-Kadji, H.; Louaileche, H. HPLC Sugar Profiles of Algerian Honeys. Food Chemistry 2010, 121(2), 561–568.
- León‐Ruiz, V.; Vera, S.; González‐Porto, A.V.; & Andrés, M.P.S. Vitamin C and Sugar Levels as Simple Markers for Discriminating Spanish Honey Sources. Journal of Food Science 2011, 76(3), C356–C361.
- Manzanares, A.B.; García, Z.H.; Galdón, B.R.; Rodríguez, E.R.; Romero, C.D. Differentiation of Blossom and Honeydew Honeys using Multivariate Analysis on the Physicochemical Parameters and Sugar Composition. Food Chemistry 2011, 126(2), 664–672.
- Manzanares, A.B.; García, Z.H.; Galdón, B.R., Rodríguez, E.R.; Romero, C.D. Physicochemical Characteristics of Minor Monofloral Honeys from Tenerife, Spain. LWT-Food Science and Technology 2014, 55(2), 572–578.
- Münstedt, K.; Sheybani, B; Hauenschild, A; Brüggmann, D; Bretzel, R.G; Winter, D. Effects of Basswood Honey, Honey-comparable Glucose-fructose Solution, and Oral Glucose Tolerance Test Solution on Serum Insulin, Glucose, and C-peptide Concentrations in Healthy Subjects. Journal of Medicinal Food 2008, 11(3), 424–428.
- Swallow, K.W; Low, N.H. Analysis and Quantitation of the Carbohydrates in Honey using High-performance Liquid Chromatography. Journal of Agricultural and Food Chemistry 1990, 38(9), 1828–1832.
- Low, N.I.H.; Sporns, P. Analysis and Quantitation of Minor di‐and Trisaccharides in Honey, Using Capillary Gas Chromatography. Journal of Food Science 1988, 53(2), 558–561.
- De la Fuente, E.; Sanz, M.L., Martínez-Castro, I.; Sanz, J.; Ruiz-Matute, A.I. Volatile and Carbohydrate Composition of Rare Unifloral Honeys from Spain. Food Chemistry 2007, 105(1), 84–93.
- Gomes, S.; Dias, L.G.; Moreira, L.L.; Rodrigues, P.; Estevinho, L. Physicochemical, Microbiological and Antimicrobial Properties of Commercial Honeys from Portugal. Food and Chemical Toxicology 2010, 48(2), 544–548.
- Zamora, M.C.; Chirife, J. Determination of Water Activity Change Due to Crystallization in Honeys from Argentina. Food Control 2006, 17(1), 59–64.
- Scandurra, G.; Tripodi, G.; Verzera, A. Impedance Spectroscopy for Rapid Determination of Honey Floral Origin. Journal of Food Engineering 2013, 119(4), 738–743.
- Karabagias, I.K.; Badeka, A.; Kontakos, S.; Karabournioti, S.; Kontominas, M.G. Characterization and Classification of Thymus capitatus (L.) Honey According to Geographical Origin Based on Volatile Compounds, Physicochemical Parameters and Chemometrics. Food Research International 2014, 55, 363–372.
- Hernández, O.M.; Fraga, J.M.G.; Jiménez, A.I.; Jimenez, F.; Arias, J.J. Characterization of Honey from the Canary Islands: Determination of the Mineral Content by Atomic Absorption Spectrophotometry. Food Chemistry 2005, 93(3), 449–458.
- Nanda, V.; Sarkar, B.C.; Sharma, H.K.; Bawa, A.S. Physico-chemical Properties and Estimation of Mineral Content in Honey Produced from Different Plants in Northern India. Journal of Food Composition and Analysis 2003, 16(5), 613–619.
- Baroni, M.V.; Arrua, C.; Nores, M.L.; Fayé, P.; del Pilar Díaz, M.; Chiabrando, G.A.; Wunderlin, D. A. Composition of Honey from Córdoba (Argentina): Assessment of North/South Provenance by Chemometrics. Food Chemistry 2009, 114(2), 727–733.
- Madejczyk, M.; Baralkiewicz, D. Characterization of Polish Rape and Honeydew Honey According to their Mineral Contents using ICP-MS and F-AAS/AES. Analytica Chimica Acta 2008, 617(1), 11–17.
- Kaškonienė, V.; Venskutonis, P.R.; Čeksterytė, V. Carbohydrate Composition and Electrical Conductivity of different Origin Honeys from Lithuania. LWT-Food Science and Technology 2010, 43(5), 801–807.
- Feás, X.; Pires, J.; Iglesias, A.; Estevinho, M.L. Characterization of Artisanal Honey Produced on the Northwest of Portugal by Melissopalynological and Physico-chemical data. Food and Chemical Toxicology 2010, 48(12), 3462–3470.
- Zamora, M.C.; Chirife, J.; Roldán, D. On the Nature of the Relationship between Water Activity and% Moisture in Honey. Food Control 2006, 17(8), 642–647.