
ABSTRACT
Protein by-products from Undaria pinnatifida (U. pinnatifida) sporophyll processing (i.e., after polysaccharide extraction) were hydrolysed using flavourzyme (enzyme activity = 7592 U/g). Optimal hydrolysis conditions were determined using response surface analysis (i.e., 7% flavourzyme for 18 h); a hydrolysate yield of 32.52 ± 0.46 g/100 g dry-solids was achieved with a degree of hydrolysis (DH) at 5.63 ± 0.27 g α-amino nitrogen/100 g total nitrogen. Five free amino acids (FAAs), alanine, glumatic acid, aspartic acid, proline, and glycine, were abundant in the best hydrolysate. Eighteen volatile flavour compounds were identified using gas chromatography/mass spectrometry, with hexanal, cedrol, nonanal, 2-heptenal, acetoin, and heptanal being the primary odorants. As indicated by the sensory panel, the hydrolysate from U. pinnatifida sporophyll by-products (HUPSB) exhibited an umami taste and a seaweed odour. It was concluded that the protein by-products of U. pinnatifida sporophyll processing could yield excellent seafood flavouring.
Introduction
Protein hydrolysates from marine animal sources, such as fish, shrimp, clam, crab, and seafood by-products, have been widely used to produce seafood flavourings.[Citation1] However, quality control of these protein-based flavouring production is often complicated by the need to remove excessive fats of the marine animal sources and to minimize lipid oxidation.[Citation2] Such need is minimal in plant proteins, due to the much lower lipid contents of plant materials. For centuries, seaweed has been used in the preparation of soups and foods due to its pleasant flavour. Seaweed by-products, after agar extraction, are good sources of plant proteins, and they contain flavour-rich amino acids, such as aspartic acid, glutamic acid, arginine, and lysine, with a low fat content.[Citation1] Various reports have indicated that these amino acids and short-chain peptides from vegetable proteins, meat muscle proteins, and seafood proteins can produce highly desirable taste profiles.[Citation3–Citation5] Indeed, glutamic acid and glutamic acid-rich oligo peptides from hydrolysed proteins generate an umami flavour. Furthermore, amino acids and peptides from hydrolysed vegetable proteins are precursors in a variety of Maillard reactions that produce an extensive range of volatile flavours.[Citation3]
Undaria pinnatifida (U. pinnatifida) is a type of brown algae that normally grows in the seas of China, Korea, and Japan. Its structure can be categorized into blade (lamina), midrib, sporophyll, and root-like formations (haptera). Its Japanese name is wakame, which is also the name of the processed U. pinnatifida used as food.[Citation6] In 2014, the annual production of U. pinnatifida was 20 tons (dry weight) in China.[Citation7] Sporophyll, the reproductive organ of U. pinnatifida and a processing by-product of the seaweed food industry, is now being used as a feedstock in the functional food industry for the extraction of sulphated polysaccharide. However, the current processing is incomplete: after the removal of agar and sulphated polysaccharides, the residues of U. pinnatifida sporophyll are still rich in proteins, which can be further utilized to produce high-quality seafood flavourings.
Selective enzymatic hydrolysis under controlled conditions is an effective way to enrich volatile compounds and to improve the physicochemical characteristics and organoleptic quality of plant proteins. It produces desirable peptides and amino acids with less content of salt and carcinogenic compounds, such as mono- and dichloropropanols or 3-monochloropropane-1,2-diol (3-MCPD), than that of acid hydrolysis.[Citation8] The hydrolysate contains amino acids and low molecular weight peptides with unique taste properties, e.g., sweet, salty, sour, bitter, and umami tastes.[Citation9] A mixture of proteases called flavorzyme, with both exo- and endopeptidase activities, can be obtained by the controlled fermentation of A. oryzae.[Citation10] It has been reported to change the volatile compounds profile of dry fermented sausage[Citation11] by accelerating proteolysis. The objectives of this study were to: 1. produce a protein hydrolysate, which could be used as a precursor to produce seafood flavourings, from U. pinnatifida sporophyll by-products (i.e., HUPSB) using flavourzyme; 2. characterize the physicochemical properties and the volatile compounds profile of this protein hydrolysate, followed by a sensory evaluation to identify the key contributors to its flavouring attributes; and 3. apply the response surface methodology (RSM) to find the optimal hydrolysis conditions.
Materials and methods
Materials and chemicals
U. pinnatifida sporophyll by-products (UPSB) samples after agar and sulphated polysaccharide extraction were provided by Dalian Aquaculture Co., Ltd., located in Dalian, China. The chemical compositions of the sample were obtained according to AOAC (protein: AOAC954.01; lipid: AOAC2003.06; dietary fibre: AOAC992.16; ash: AOAC938.08; carbohydrate: AOAC979.06) (1997). UPSB on a dry weight basis contained 20.94 ± 0.20 g protein/100 g dry-solids, 3.20 ± 0.05 g lipid/100 g dry-solids, 19.06 ± 0.06 g ash/100 g dry-solids, 9.97 ± 0.19 g fibre/100 g dry-solids, and 46.83 ± 0.74 g carbohydrate/100 g dry-solids, respectively. Flavourzyme (E.C. 3.4.11.1; 7592 U/g) was purchased from Nanning Pangbo Biological Engineering Co., Ltd., located in Nanning, China. All reagents were of analytical grade, and used without further purification.
Preparation of the HUPSB
The preparation of the HUPSB followed previous research with some modification.[Citation1,Citation12,Citation13] Around 10 g of UPSB was dispersed in 500 mL of purified water, and the pH of the dispersion was adjusted to pH 6.8 with 1 N HCl. The dispersion was then pre-incubated at 55ºC for 10 min to ensure optimal flavourzyme activity. Vials of the dispersion were then incubated at 50ºC for 1, 3, 6, 12, and 24 h with flavourzyme added at enzyme/substrate ratios (E/S) of 0%, 1%, 2%, 5%, and 10% (weight of enzyme/weight of UPSB). The hydrolysis was terminated at the end of the designated reaction time for each vial by heating at 100ºC for 15 min. The reactant from each vial was then filtrated with a 240-mesh filter cloth. The resulting hydrolysate was collected and stored in glass bottles at 4ºC prior to analysis. All tests were performed in triplicates.
Determination of the degree of hydrolysis (DH) and the yield of the HUPSB
The degree of hydrolysis (DH) was defined as the percentage ratio of the α-amino nitrogen to the total nitrogen. The total nitrogen was determined using the Kjeldahl Method. α-amino nitrogen was determined using the modified formol titration procedure as described by Gump et al. [Citation14] and Filipe-Ribeiro et al. [Citation15]. The DH can then be calculated using the general equation:
To calculate the percentage yield (g/100 g dry-solids), the hydrolysate (nearly 500 mL) was concentrated using a rotary evaporator at 40ºC and 5 kPa, until the final volume reached 250 mL. Now, 50 mL of the concentrated hydrolysate was dried to constant weight in a baking oven at 90ºC, and the final weight of the dried material was determined. The percentage yield was calculated as follows:
Experimental design for enzymatic reaction optimization using RSM for HUPSB production
Optimal hydrolysis conditions were established using RSM. Two independent variables, enzyme concentration (x1) and hydrolysis time (x2), were investigated, each at five levels (x1 = 0, 1, 2, 5, and 10% w/w; x2 = 1, 3, 6, 12, and 24 h). A 2×5 randomized factorial design (CRD) was used to obtain the combination of x1 and x2 values that optimizes the DH and yield of the reaction, respectively. To find the optimal point, the response surface was established by a second-order polynomial model as follows:
where y represents the predicted response (yield and DH, respectively); x1 and x2 represent independent variables; a0 represents an offset term; a1 and a2 represent linear effects; and a12 represents the interaction effect between the two variables. The model was used to quantify the effects of each independent variable. All analyses were performed using Design-Expert.8.05 (Stat Ease Inc, USA).
Analysis of free amino acids of the HUPSB
The analysis of free amino acids (FAAs) followed previously reported procedures with some modification.[Citation2,Citation13] The FAAs of the HUPSB were extracted by acetone, and derived with 2, 4-dinitrofluorobenzene. The FAA levels were determined by an LC-10 Avp Plus HPLC (Shimadzu Co., Tokyo, Japan) coupled with an Elite amino acid analysis column (Elite Analytical Instruments Co., Ltd., Dalian, Liaoning, China), according to the methods recommended by the instruction of the Elite-AAK amino acid analysis system (UV1201 ultraviolet visible detector, Elite Analytical Instruments Co., Ltd., Dalian, Liaoning, China). Amino acid mixture standards (Elite Analytical Instruments Co., Ltd., Dalian, Liaoning, China) including 19 different amino acids were used as calibration references. The levels of amino acids were estimated based on the peak areas calibrated with known concentrations of the standards using LC solution software (version 1.11 SP1, Shimadzu, Japan).
Compositional analysis of volatile compounds profile of the HUPSB
The composition of volatile compounds in HUPSB was analysed on a headspace solid-phase microextraction-gas chromatography-mass spectrometry (HS–SPME-GC–MS) system (5975C MS Agilent Technologies, Santa Clara, CA) following Sonklin et al.’s method with some modification.[Citation3] Each sample (3 mL) was placed into a 20-mL vial and heated at 50 °C for 5 min in a GC–MS heating block for headspace analysis. Volatile compounds were absorbed onto an SPME fibre (50 × 30 μm DVB/Carboxen™/PDMS StableFlex™; Supelco, Bellefonte, PA) at 50°C for 20 min. After equilibrium, the SPME fibre was desorbed into the injector port at 260°C for 2 min in splitless mode. Helium was used as the carrier gas at a constant velocity of 1.5 mL/min. Volatile compounds were separated using a DB-Wax capillary column (30 m × 0.25 mm, 0.25 μm film thickness; Agilent Technologies, Santa Clara, CA). The oven temperature profile was as follows: initial temperature of 35°C; raised to 70°C at 3°C/min; raised to 200°C at 10°C/min; raised to 260°C at 20°C /min; and held at 260°C for 5 min. Volatile compounds were detected using Mass Spectrometry Detection (MSD) (Single Quadrupole, scan range of m/z 29–350) at 260°C. The identification of compounds was based on the comparison of their retention time and mass spectrum with data in the NIST11 libraries at a quality match greater than 60%. A series of n-alkanes (C8-C20) was analysed by direct injection on the GC–MS to obtain retention index (RI) values. The RI data were compared with previously published literature values for references.
Sensory panel evaluation of the HUPSB
Descriptive sensory panel analysis of the HUPSB was performed following previous research with some modification.[Citation16,Citation17] A 15-member panel was randomly selected from a pool of graduate students and faculty members at the School of Food Science and Technology, Dalian Polytechnic University. The selected panellists were presented with food products having one of the following eight characteristic sensory attributes: (1) seaweed odour (kelp source), (2) crab odour (cooked crab), (3) shrimp odour (cooked shrimp), (4) caramel odour (cooked sugar), (5) umami taste (glutamic acid solution), (6) sweet taste (sugar solution), (7) salty taste (salt solution), and (8) bitter taste (quinine solution) for their training. The panellists were then served with the HUPSB in opaque, disposable plastic cups. For the HUPSB, the panellists were required to score each of the eight attributes on a scale of 0–10 anchored by the low intensity (0) and the high intensity (10).
Statistical analysis
All assays were performed at three repetitions. Data were subjected to analysis of variance (ANOVA), and the differences between means were evaluated by the least-significant difference test following Young.[Citation18] The SPSS statistical program (Version 13.0) (SPSS Inc., 2001) was used for data analysis. Comparison that yielded p < 0.05 was considered significant.
Results and discussion
Physicochemical properties of the HUPSB
The UPSB is a suitable candidate to produce high-quality protein hydrolysate because it is high on proteins (21 g/100 g dry-solids) and low on lipids (3.2 g/100 g dry-solids). The total salt content of the HUPSB, 0.31 ± 0.01 g/100 g dry-solids, was not affected by the enzyme concentration or the hydrolysis time (p > 0.05). and illustrate the influence of the hydrolysis time and enzyme concentration on the proteolytic reaction, represented by two response variables, yield and DH, which indicate the efficiency of the enzyme to cleave peptide bonds. In this study, the yield and DH were optimized using a statistical model established by RSM, which was effective in replacing traditional kinetic experiments to quantify the effects of each factor, and the interaction between factors.[Citation19] Regression coefficients between the two response variables (yield and DH) and the two factors (i.e., enzyme concentration and hydrolysis time) are listed in . Correlation coefficient of determination (rCitation2) values for all of the response variables were higher than 0.80, indicating that the model adequately explained the correlations between the factors and the response variables (i.e., yield and DH). After RSM was applied, the following models were established for yield and DH, respectively:
Table 1. Regression coefficients of a quadratic model estimated by multiple linear regressions for the yield and DH of HUPSB.
Figure 1. Response surfaces for the effect of enzyme concentration and hydrolysis time on (A) yield (g/100 g dry-solids) and (B) degree of hydrolysis of HUPSB (g α-amino nitrogen/100 g total nitrogen).
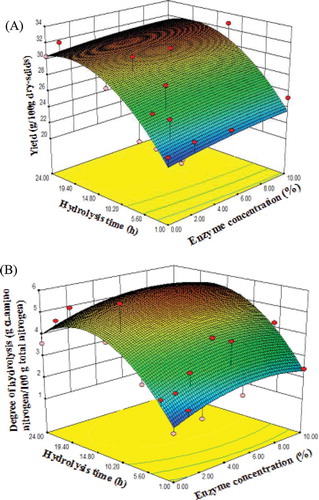
where x1 represents enzyme concentration and x2 represents the hydrolysis time. The interaction between the enzyme concentration (x1) and the hydrolysis time (x2) on the yield was significant (p < 0.01). The yield demonstrated a positive linear correlation with both the enzyme concentration (x1) and hydrolysis time (x2), but a negative correlation with the interaction of x12 and x22. The yields for all of the enzyme concentrations increased rapidly in the initial phase of hydrolysis (1–18 h) and then decreased after 18 h. The highest yield (31.93 g/100 g dry-solids) of the HUPSB was produced from an enzyme concentration of 7.31% flavourzyme and a hydrolysis time of 17.78 h. Regression coefficients indicated strong correlations between independent factors (the enzyme concentration and the hydrolysis time) and DH (). A positive value indicated that the DH values increased with increasing enzyme concentration, as reported by McCarthy et al. [Citation3] Similar to the yield, the hydrolysis time also affected the DH of the HUPSB. The DH value decreased after 18 h (). The DH dramatically increased when the enzyme concentration was increased from 0% to 7%. However, the DH values of the HUPSB using 10% flavourzyme were not significantly different, due to saturated enzyme/substrate or inhibitory effects of the end-products.[Citation20]
To visualize the results, response surface plots and a contour plot of yield and DH were used to determine the optimal hydrolysis conditions. and show the three-dimensional response surface plots and contour plot for the independent factors (concentration and hydrolysis time) on yield and DH, respectively. Next, 7% flavourzyme concentration and 18 h hydrolysis time were selected as the optimal conditions for producing the HUPSB (); it is close enough to the model predicted value of 7.31% flavourzyme and 17.78 h, yet practical enough for experiments. The model predicted response values (yield 31.93 g/100 g dry-solids and DH 5.699 g α-amino nitrogen/100 g total nitrogen) were verified by experiments: the observed values were 32.52 ± 0.46 g/100 g dry-solids (yield) and 5.63 ± 0.27 g α-amino nitrogen/100 g total nitrogen (DH), respectively. The observed and predicted values are listed in . The experimental results were similar to the predicted values for yield and DH using RSM. These results confirmed the suitability of the model to predict the optimal conditions for HUPSB.
Table 2. Predicted and experimental values of HUPSB.
Composition of FAA in the UPSB and the HUPSB and sensory evaluation
FAA composition is more meaningful in terms of determining the flavour attributes of the UPSB and HUPSB than the composition of protein amino acids because FAAs are active primary flavour components in the hydrolysate. The distribution and relative abundance of these active taste components affect the flavour quality.[Citation21] The FAA composition of the UPSB and the HUPSB produced using 7% flavourzyme for 18 h was determined using HPLC, as shown in . Ten and eleven FAAs were found in the UPSB and HUPSB, respectively. Alanine was the most abundant (2760 ± 280 mg/100 g); other abundant amino acids found in the UPSB include glutamic acid (1210 ± 130 mg/100 g), aspartic acid (800 ± 70 mg/100 g), glycine (470 ± 50 mg/100 g), and proline (430 ± 50 mg/100 g).
Table 3. Free amino acid composition in UPSB and HUPSB.
All in all, eleven FAAs derived from the HUPSB were identified, including three hydrophobic (alanine, valine, and proline), four hydrophilic (glycine, serine, threonine, and tyrosine), two acidic (aspartic and glutamic acid), and one basic (arginine) amino acid. Among the identified amino acids, alanine was the most abundant (5080 ± 760 mg/100 g), followed by glutamic acid (3950 ± 380 mg/100 g), aspartic acid (3900 ± 580 mg/100 g), proline (2240 ± 260 mg/100 g), and glycine (2110 ± 360 mg/100 g). There was an over threefold increase in FAAs in the HUPSB (22930 mg/100 g) than those in the UPSB (6660 mg/100 g). Aspartic acid and glutamic acid are the major components in the taste sensation of umami, which means “delicious” in Japanese. Umami is described as savoury with a meat- or broth-like taste.[Citation22] In the HUPSB, free glutamic acid and aspartic acid content is significantly elevated than that of the UPSB (7850 mg/100 g vs. 2010 mg/100 g). Umami and sweet taste are to be expected in the HUPSB than those of UPSB, due to flavourzyme hydrolysis. Among these FAAs, valine, histidine, and tryptophan contribute to bitterness, but their concentration (2480 mg/100 g) was much lower compared to the concentration of sweet FAAs (alanine, threonine, serine, arginine, and proline, at 12420 mg/100 g) in the HUPSB. These results suggest the flavourzyme hydrolysis is an effective way to improve the flavour of the UPSB. In addition, the FAA results were consistent with sensory panel evaluation. The panellists reported very low bitterness (2.0 ± 0.4 scores, ). The absence of bitterness makes the HUPSB an ideal flavouring for taste enhancement.
Figure 2. GC-MS chromatogram of HUPSB by 7% flavourzyme for 18 h.
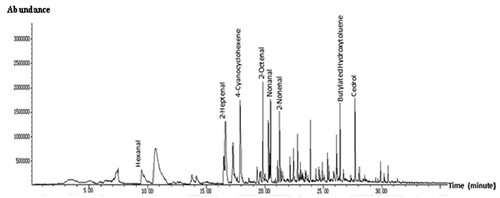
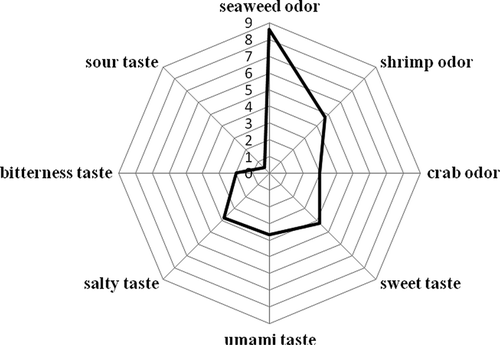
Figure 3. Sensory profiles of HUPSB by 7% flavourzyme for 18 h.
Volatile compounds profile in the HUPSB and sensory evaluation
Eighteen volatile compounds in the HUPSB hydrolysed using 7% flavourzyme for 18 h were identified () and are listed in . Major volatile compounds included hexanal, cedrol, nonanal, 2-heptenal, acetoin, and heptanal with % peak areas at 20.20 ± 1.58, 13.89 ± 0.21, 11.97 ± 1.11, 10.39 ± 0.11, 9.17 ± 1.29, and 6.97 ± 0.50, respectively. These volatile compounds of the HUPSB are consistent with seaweed, green, flower, butter, fatty, and citrus odour characteristics. The sensory profile of the HUPSB was seaweed odour, shrimp odour, crab odour, sweet taste, salty taste, umami taste, bitter taste, and sour taste, with average scores of 8.6 ± 0.8, 4.7 ± 0.9, 3.0 ± 1.0, 4.3 ± 0.7, 3.8 ± 0.4, 3.7 ± 1.5, 2.0 ± 0.4, and 0.4 ± 0.1, respectively (). These sensory scores suggested the dominant flavour characteristics of the HUPSB is represented by a seaweed odour, followed by a shrimp odour, a sweet taste, and an umami taste. Hexanal compounds were reported as the major flavour compounds in seaweed by-products.[Citation1] They are the most abundant compounds found in the HUPSB, consistent with the sensory evaluation of seaweed and crab odours. Hexanal and 2-heptanal were also associated with green odours in seaweed and crab.[Citation1] The cedrol content is also quite high in the HUPSB, but our sensory panel did not report strong warm fire-like odour in the hydrolysate; it may be overwhelmed by more dominant seaweed and shrimp odours. Hexane and 2-heptenal, which have been detected in other marine species, such as shrimp, crab, and fish,[Citation23,Citation24] were also found in the HUPSB. Among the other volatile compounds found in the HUPSB, 4-cyanocyclohexene, 2-octenal, nonanal, 2-nonenal, and cedrol were detected in soybean.[Citation3] Heptanal and nonanal, associated with citrus flavour, were also detected in crabs. These results were similar to hydrolysates from the protein by-products of seaweed (Gracilaria sp.).[Citation1] Overall, the volatile compounds profile of the HUPSB suggests it to be a good base material for the production of seafood flavouring additives.
Table 4. Volatile compounds in HUPSB by 7% flavourzyme for 18 h.
Conclusion
An RSM model was successfully developed to identify optimal hydrolysis conditions for a protein-based flavouring (i.e., HUPSB) production from seaweed UPSB. Using 7% flavourzyme for 18 h, a yield of 32.52 ± 0.46 g/100 g dry-solids and a DH of 5.63 ± 0.27 g α-amino nitrogen/100 g total nitrogen were obtained. The relatively high yield and high FAA contents suggest the high potential value of the HUPSB production. A comprehensive FAA profiling revealed that alanine, glutamic acid, aspartic acid, proline, and glycine were the most abundant FAAs in the hydrolysate, which is consistent with the predominant umami and sweet tastes of the HUPSB reported by a sensory evaluation panel. Volatile compounds profiling of the HUPSB confirmed that the primary odorants of the HUPSB are consistent with seaweed, green, sweet, fatty, and resin odour characteristics. The complex yet highly desirable odour and taste profile of the HUPSB, originating from its unique molecular makeup, indicate that the HUPSB has a great potential to serve as a flavour supplement or a savoury flavour source for various seafood flavouring products.
Funding
This work was supported by the National High Technology Research and Development Program (“863”Program) (No. 2014AA093602) and Public Science and Technology Research Funds Projects of Ocean (No. 201505030-5).
Additional information
Funding
Related Research Data
Reference
- Laohakunjit, N.; Selamassakul, O.; Kerdchoechuen, O. Seafood-like Flavour Obtained from the Enzymatic Hydrolysis of the Protein by-products of Seaweed (Gracilaria sp.). Food Chemistry 2014, 158(8), 162–170.
- Imm, J.Y.; Lee, C.M. Production of Seafood Flavor from Red Hake (Urophycis chuss) by Enzymatic Hydrolysis. Journal of Agricultural and Food Chemistry 1999, 47(6), 2360–2366.
- Sonklin, C.; Laohakunjit, N.; Kerdchoechuen, O. Physicochemical and Flavor Characteristics of Flavoring Agent from Mungbean Protein Hydrolyzed by Bromelain. Journal of Agricultural & Food Chemistry 2011, 59(15), 8475–8483.
- Silva, V.M.; Park, K.J.; Hubinger, A.D. Optimization of the Enzymatic Hydrolysis of MusselMeat. Journal of Food Science 2010, 75(1), C36–C42.
- Jiang, H.J.; Kim, M.C.; Jung, E.J.; Shin, E.C.; Lee, S.J.; Kim, S.B.; Lee, Y.B. Optimization and Flavor Quality of Enzymatic Hydrolysate from Dark Muscle of Skipjack. Preventive Nutrition & Food Science 2005, 10(1), 11–16.
- Fung, A.; Hamid, N.; Lu, J.; Fucoxanthin Content and Antioxidant Properties of Undaria Pinnatifida. Food Chemistry 2013, 136(2), 1055–1062
- Bureau of Fisheries in Ministry of Agriculture. China Fishery Statistical Yearbook; China Agriculture. Press: Beijing, China, 2015; 34 pp.
- Weir, G.S.D. Proteins as a Source of Flavor. In Biochemistry of Food Proteins; Hudson, B.J.F.;; Ed.; Elsevier Applied Science Publishers: London, USA, 1992; 363–395.
- Su, G.; Cui, C.; Zheng, L.; Yang, B.; Ren, J.; Zhao, M. Isolation and Identification of Two Novel Umami and Umami-Enhancing Peptides from Peanut Hydrolysate by Consecutive Chromatography and MALD-TOF/TOF MS. Food Chemistry 2012, 135(2), 479–485.
- Feng, L.; Qiao, Y.; Zou, Y.; Huang M.; Kang Z.; Zhou G. Effect of Flavourzyme on Proteolysis, Antioxidant Capacity and Sensory Attributes of Chinese sausage. Meat Science 2014, 98(1), 34–40.
- Ansorena, D.; Astiasaran, I.; Bello, J. Influence of the Simultaneous Addition of the Protease Flavourzyme and the Lipase Novozym 677BG on Dry Fermented Sausage Compounds Extracted by SDE and Analyzed by GC-MS. Journal of Agricultural and Food Chemistry 2000, 48(6), 2395–2400.
- Zhou, D.; Qin, L.; Zhu, B.; Li, D.; Yang, J.; Dong, X.; Murata,Y. Optimisation of Hydrolysis of Purple Sea Urchin (Strongylocentrotus nudus) Gonad by Response Surface Methodology and Evaluation of in vitro Antioxidant Activity of the Hydrolysate. Journal of the Science of Food & Agriculture 2012, 92(8), 1694–1701.
- Jin, W.G.; Wu, H.T.; Zhu, B.W.; Ran, X.Q. Functional Properties of Gelation-like Protein Hydrolysates from Scallop (Patinopecten yessoensis) Male Gonad. European Food Research & Technology 2012, 234(5), 863–872.
- Gump, B.H.; Zoecklein, B.W.; Fugelsang, K.C.; Prediction of Prefermentation Nutritional Status of Grape Juice. In The Formol Method; Spencer, J.F.T.; Ragout de Spencer, A.L.; Eds.; Food Microbiology Protocols. Press: Totowa, USA, 2000; 283–296.
- Filipe-Ribeiro, L.; Mendes-Faia, A. Validation and Comparison of Analytical Methods Used to Evaluate the Nitrogen Status of Grape Juice. Food Chemistry 2007, 100(3), 1272–1277.
- Stone, H.; Sidel, J.L. Sensory Evaluation Practices (Third Edition); Elsevier Academic Press: Redwood City, California, USA, 2004.
- Durme, J.V.; Goiris, K.; Winne, A.D.; Cooman, L.D. Muylaert, K.; Evaluation of the Volatile Composition and Sensory Properties of Five Species of Microalgae. Journal of Agricultural and Food Chemistry 2013, 61(46), 10881–10890.
- Young, S.; Stoichiometry; Nabu Press: Charleston, USA, 2011.
- Guo, X.; Tian, S.; Small, D. M. Generation of Meat-like Flavorings from Enzymatic Hydrolysates of Proteins from Brassica sp. Food Chemistry 2010, 119(1), 167–172.
- McCarthy A.L.; O’Callaghan Y.C.; O’Brien N.M. Protein Hydrolysates from Agricultural Crops - Bioactivity and Potential for Functional Food Development. Agriculture 2013, 3(1), 112–130. Agricultural Crops—Bioactivity and Potential for Functional Food Development[J]. Agriculture, 2013, 3(1):112–130.
- Fuke, S. Taste Active Components of Sea Foods with Special Reference to Umami Substances. In Seafoods: Chemistry,Processing Technology and Quality; Shahidi, F.; Botta, J.R.; Eds.; Blackie Academic & Professional: London, USA, 1994.
- Kato, H.; Rhue Mee, R.; Nishimura, T. Role of Free Amino Acids and Peptides in Food Taste. In Flavor Chemistry: Trends and Developments; Teranishi, R.; Buttery, R.G.; ShahidiF.; Eds, American Chemical Society. Press: Washington, America, 1989; 158–174.
- Josephson, D.B.; Lindsay, R.C. Enzymatic Generation of Volatile Aroma Compounds from Fresh Fish. In Biogeneration of Aromas; Parliament, T.H.; Croteau R.; Ed, American Chemical Society. Press: Washington, USA, 1986; 201–219.
- Yu, H.Z.; Chen, S.S. Identification of Characteristic Aroma-active Compounds in Steamed Mangrove Crab (Scylla serrata). Food Research International 2010, 43(8),2081–2086.