
ABSTRACT
A rapid and nondestructive near-infrared diffuse reflectance spectroscopy method combined with multivariate analysis was developed to discriminate different species and grades of marine fish surimi. Principal component analysis and discriminant analysis were applied to classify the species and quality grades of surimi. The results showed that excellent classification was obtained after optimizing spectral pretreatment. For the discrimination of three species of surimi, the correct classification rate of the calibration as well as the validation datasets were 98.5% and 100%, respectively, using the discriminant analysis method after multiplicative scatter correction pretreatment. For four grades of surimi, discriminant analysis provided 98.9% and 100% correct classification rate for calibration and validation datasets, respectively, after multiplicative scatter correction pretreatment. It was demonstrated that near-infrared diffuse reflectance spectroscopy integrated with discriminant analysis had significant potential as a rapid and accurate approach for rapid discrimination of surimi species and grades.
Introduction
Surimi is a kind of important intermediate product containing stabilized myofibrillar proteins obtained from mechanically deboned fish flesh. After washing to remove sarcoplasmic protein, the flesh of fish was blended with cryoprotectants and freezed until further processing for imitation shrimp meat, kamaboko, and fish sausage, etc. In addition, surimi has become increasingly popular due to its various nutritional benefits.[1] The physical properties of the fish flesh gel are significantly dependent on myosin. Myosin is the most abundant myofibrillar component in certain kinds of fish species (e.g., Alaska Pollack), which is related to the texture and color of final products.[2] In fact, different grades of certain species of surimi also have different qualities. In recent years, the lack of feasible industrial and national standards giving assessment to surimi and the loss of original appearance of corresponding fish has led to the phenomenon of surimi adulteration driven by high economic interests.[3]
Currently, surimi species identifications are mainly based on fish species discrimination. Structural proteins can reflect the genetic characteristics differences in surimi species, so related techniques such as fish protein electrophoresis analysis techniques, fish protein immunoassay techniques, DNA fingerprinting analysis techniques are generally used to identify fish species.[4,5] Sensory evaluation, physical and chemical testing, microbial detection are also used for surimi quality evaluation.[6,7] However, most of the methods mentioned above are either time consuming, destructive, or requiring well-trained personnel, not applicable for nondestructive and rapid testing.
Infrared spectroscopy, associated with chemometrics (e.g., principal component analysis (PCA) and discriminant analysis (DA)), is becoming a powerful tool having lots of advantages such as convenience of operation, rapid speed of detection, higher efficiency, lower cost, less pollution, and easier preparation procedures.[8–11] It has been applied successfully in qualitative analysis in complex food systems.[12–17] For mid-infrared spectroscopy, we have successfully used Tri-step infrared spectroscopy (FT-IR combined with SD-IR and 2DCOS-IR) to characterize and discriminate three marine fish surimi (white croaker, hairtail, and red coat) and four grades of white croaker surimi (A, AA, FA, and SA) rapidly and holistically.[18,19] Based on the previous study, near-infrared (NIR) spectroscopy coupled with PCA and DA, a direct detection and an easier operation, was established to differentiate and classify massive marine fish surimi samples.
Experimental
Apparatus
With the Integrating-Sphere module of the Antaris II FT-NIR analyzer (Thermo Fisher Scientific, USA) with InGaAs detector, the NIR spectra were collected in the reflectance mode. The module was rotating to ensure measuring different locations of each sample. Refrigerator BCD-649WM (Qingdao Haier Co. Ltd., P. R. China) as sample preparation equipment was used.
Materials
Three frozen AAA grade marine fish surimi (white croaker (Argyrosomus argentatus) surimi (WCS), hairtail (Trichiurus haumela) surimi (HS), and red coat (Nemipterus virgatus) surimi (RCS)) and four grades of frozen white croaker surimi (WCS) were collected from Shanghai Caixing Food Company, Zhejiang Xingye Group Co., Zhoushan Aquatic Products Co., and South Aquatic Food Co., Ltd.
Procedure
Sample preparation
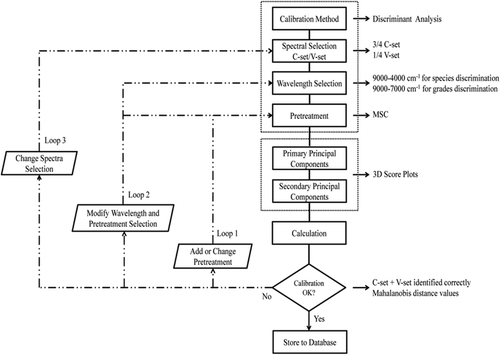
A total of 210 surimi samples (30 for each different species and grades of marine fish surimi) were dispensed in sealed bags, all surimi samples were classified into calibration set and prediction set in proportion of 3:1, and then thawed overnight at 4°C refrigerator for spectral acquisition ().
Figure 1. Scheme of experimental design.
Chemical composition analysis
Moisture content was determined using method, namely oven-dry (AOAC 950.46, 2007). The fat content of the sample was determined as free fat, and extracted from sample by Soxhlet (AOAC 960.39, 2007) using ether as solvent. Protein content was estimated from nitrogen (N × 6.25) using constant Kjeldahl method (AOAC 981.10, 2007). The ash content of the sample was determined using method called Muffle furnaceashing (AOAC 938.08, 2007). TVB-N content was estimated as follows: 5.0 g of each sample (WCS, HS, and RCS) was placed in digestive tract, adding 0.5 g magnesia, and determined by automatic Kjeldahl analyzer.
Spectral acquisition
NIR spectra of surimi samples were acquired by a diffuse reflectance mode with an Antaris II FT-NIR analyzer system and the RESULT-Integration 3.0 software. Due to the fact that NIR spectrometer was sensitive to the change of outer environmental conditions such as temperature and humidity, the room temperature was set at 25°C, and the humidity was kept at an ambient level in the laboratory. The parameters were as follows: 64 scans, 4 cm–1 of resolution, 10,000–4000 cm–1 of spectral range, 1.928 cm–1 data interval, and three times of parallel collection using an integrating sphere. The reflectance values (R) were converted into the absorbance values (A) using the formula A = log (1/R). The diameter of sample cup (specifically designed by Thermo Fisher Scientific, USA) was 30 mm. A sample cup spinner was used to place surimi for spectra acquisition.
Spectral data pretreatment
Raw spectra of samples acquired from NIR spectrometer consist of background information and noises besides sample information. Before the model calibration, spectral preprocessing methods were commonly used to achieve a reliable, accurate, and stable model. Several spectral preprocessing algorithms including standard normal variate (SNV),[20] multiplicative scatter correction (MSC),[21] first derivative (FD), and second derivative (SD) [22] were applied to perform mathematical pretreatments to reduce the systematic noise, such as baseline variation, light scattering, path length differences, and to enhance the contribution of the chemical composition.[23]
The preprocess and calculations were carried out using TQ Analyst software (Thermo Fisher Scientific, Inc., version 9.4.45). To avoid the low signal–noise ratio, only the wavelength ranging from 4000 to 9000 cm–1 (surimi species discrimination) and from 7000 to 9000 cm–1 (surimi grades discrimination) were used in this investigation.
Principal component analysis
PCA is a statistical procedure, using orthogonal transformation to convert a set of observations of possibly correlated variables into a set of values of linearly uncorrelated variables called principal components. The number of principal components is less than or equal to the number of original variables. This transformation is defined in such a way that the first principal component has the largest possible variance (i.e., accounts for as much of the variability in the data as possible), and each succeeding component in turn has the highest variance possible under the constraint that it is orthogonal to the preceding components. The resulting vectors are an uncorrelated orthogonal basis set. The principal components are orthogonal because they are the eigenvectors of the covariance matrix, which is symmetric. PCA is sensitive to the relative scaling of the original variables.[24] By plotting the PCs, one can view the interrelationships between different variables, and detect and interpret sample patterns, groupings, similarities, or differences. The PCA was also carried out using TQ Analyst software (Thermo Fisher Scientific, Inc., version 9.4.45).
Discriminant analysis
DA, a pattern recognition technique, can be used to determine which class of known samples is the most similar to an unknown sample by computing the unknown sample distance from each class center in Mahalanobis distance units.[25] When using DA to analyze the unknown samples, the TQ Analyst software performed a PCA on the spectra of the known samples and used those results to determine score values of the spectra of the unknown samples. The score values were then employed to calculate Mahalanobis distance values, which in turn were used to rank the classes. The closer each Mahalanobis distance value was to zero, the better was the match.
The DA was performed on the first nine PCs resulting from the PCA applied on NIR spectral data recorded on surimi samples because of the fact that the first nine PCs cover the most variation (>98% of the total variance) contained in the spectral data. The DA was also carried out using TQ Analyst software (Thermo Fisher Scientific, Inc., version 9.4.45). Suppose the training set spectral array containing k classes samples, each class has gi samples:
where is “between classes scatter matrix” and
is “within classes scatter matrix.” Note that,
is spectral vectors of j sample in class i,
is average spectrum of class i,
is average spectrum of all n samples.
and
are all m×m matrices.
How can we use the label information to find informative projections? To that purpose, LDA considers maximizing the following objective:
Its solution can be converted for the sake of eigenvalues and eigenvectors problems:
Eigenvector, based on the maximum eigenvalue
, can be given a first linear discriminant function:
. This calculation may continue until all discriminant functions were found, solutions to the identification problem. For DA of unknown sample spectrum
, just substitute into the discriminant function, which is attributed to the smallest Euclidean distance from the cluster center of the kind:
Results and discussion
Analysis of surimi chemical composition and raw NIR spectra
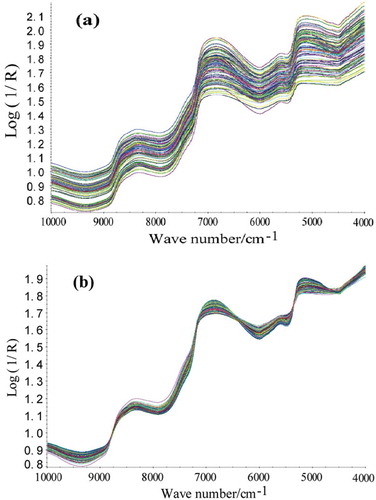
The proteins, lipids, moisture, ash, and TVB-N contents of all surimi samples were summarized in and . We can conclude from the tables that the moisture and protein are the main components of surimi. Compared with four preprocessing methods (SNV, MSC, FD, and SD), MSC method was found superior with other three methods. MSC spectral preprocessing method removed slope variation and corrected light scatter as a result of different particle sizes. Therefore, MSC method was adopted. The raw NIR spectra and MSC preprocessing spectra were presented in and . The raw NIR spectra of surimi in and were highly similar due to high-degree band overlapping. The NIR spectra exhibited intense absorption bands around 7000 cm–1 (the first O–H overtone) and around 5160 cm–1 (the combination of stretching and deformation of the O–H group in water (> 70% moisture in surimi)). The 7500–10000 cm–1 region characterized by low intensity and low signal-to-noise ratio was assigned to the second and third overtones. The 4500–5000 cm–1 region was corresponded to combinations of fingerprint absorptions with the C–H, O–H, and N–H stretching modes. The 5450–6100 cm–1 region was related to the first overtones of the C–H stretching mode.[26]
Table 1. Chemical composition of three species of surimi (white croaker surimi (WCS), hairtail surimi (HS), and red coat surimi (RCS)).
Table 2. Chemical composition of four grades of surimi (white croaker surimi (A, AA, FA, and SA)).
Figure 2. Spectra of the three marine fish surimi samples: (a) raw spectra and (b) MSC preprocessed spectra.
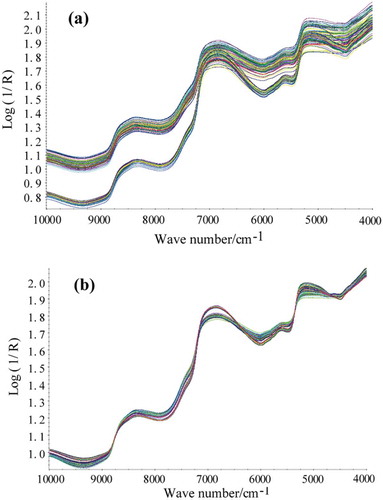
Figure 3. Spectra of different grades of white croaker surimi samples: (a) raw spectra and (b) MSC preprocessed spectra.
Principal component analysis
PCA, a kind of method involving data reconstruction and dimensional reduction, is performed by extracting some principal components (PCs) vectors. The first principal component (PC1) is the combination of variables explaining the greatest amount of variation. The second principal component (PC2) defines the second largest amount of variations unexplained by the first one and is orthogonal to the first, etc.[27] Nine principal components (PCs) were selected to describe a total of 99.94% and 99.99% of the defined spectral region contribution for surimi species and grades discrimination ( and ), respectively. It ran two separate analyses. One (full-spectrum contribution) calculated the variation over the entire spectral range of each sample for each principal component. The other (analysis-spectrum contribution) determined the variation in the analysis region or regions. The Eigen analyses were shown in and . The value in each full-spectrum contribution and analysis-region contribution field indicated the percentage of the spectral variation which the corresponding principal component described. These values were cumulative. Most of the variations should occur in the analysis regions (9000–4000 cm–1 for surimi species discrimination and 9000–7000 cm–1 for surimi grades discrimination) because the full spectrum variation provided information about other sources of variation which may be relevant to the analysis or not. As shown in and , the contribution of the analysis spectrum to the explanation of the observed variance was higher than the corresponded full spectrum for each PC. This meant that the selected spectral regions were able to classify the surimi samples. In this work, to visualize the cluster trends of all samples, a scatter plot (also called a score plot) was obtained by using the top three principal components issued from PCA based on MSC preprocessing.
Table 3. Eigen analysis of spectrum contribution and analysis spectrum contribution (9000–4000 cm–1) for surimi species discrimination.
Table 4. Eigen analysis of spectrum contribution and analysis spectrum contribution (9000–7000 cm–1) for surimi grades discrimination.
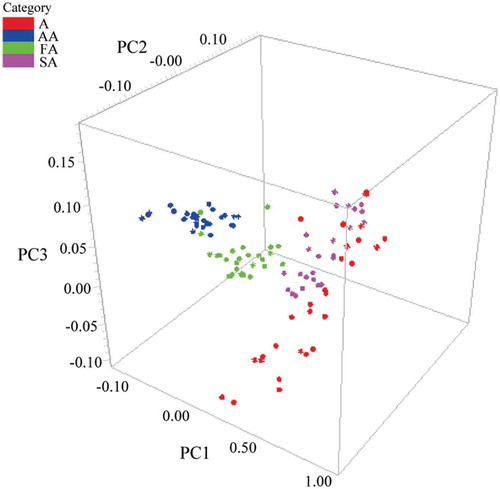
and show three-dimensional (3D) principal component score plot using first three score vectors. The initial three factors, which describe the most spectral variations 99.09% (88.69%, 9.69%, 0.71% for PC1, PC2, and PC3, respectively) and 99.37% (95.43%, 2.39%, 1.56% for PC1, PC2, and PC3, respectively) related to species and grades indicating as positive or negative were used to make differentiation clearer. According to , three sample groups appeared in cluster trend along three principal component axes, confirming the presence of three different clusters associated with their species. Red coat surimi (RCS) samples could be separated directly by PCA. Nevertheless, the separation of the other two species of surimi samples was not very clear. As can be seen from , four grades of white croaker surimi (A, AA, FA, and SA) were clearly identified with few overlaps.
Figure 4. Three-dimensional score plot using PC1, PC2, and PC3 for discriminating three marine fish surimi (white croaker surimi (WCS), hairtail surimi (HS), and red coat surimi (RCS)).
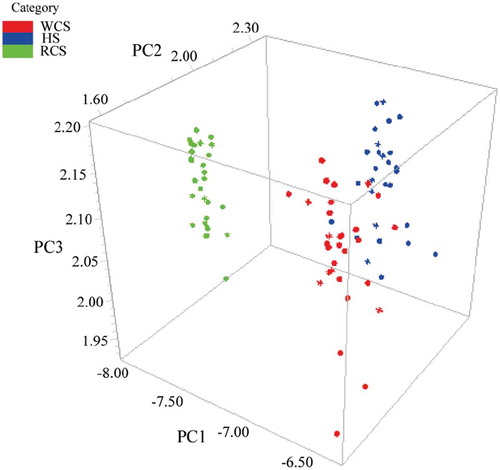
Figure 5. Three-dimensional score plot using PC1, PC2, and PC3 for discriminating four grades of white croaker surimi (A, AA, FA, and SA).
By examining PCA 3D plots, it seemed that discriminating samples from different species or different grades was feasible. However, only visual determination results were obtained by PCA. The lack of definite index describing the exact differences will lower the credibility of the results. For further discrimination, DA method was utilized in the following study.
Discriminant analysis
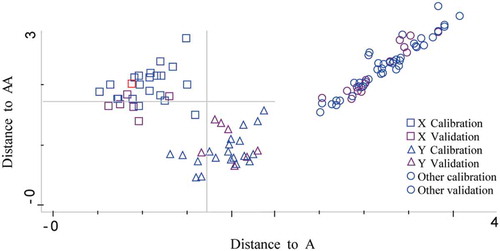
All samples within the calibration set were used to calibrate model, and the samples in the validation set were employed to test the prediction ability of the built model. A certain ratio of division (3/1) for calibration/validation samples was determined. and show that with DA models, surimi of different species and grades were correctly classified, demonstrating the good discriminatory power to differentiate surimi samples.
Table 5. Classification performance report of calibration (C) and validation (V) for surimi species discrimination (white croaker surimi (WCS), hairtail surimi (HS), and red coat surimi (RCS)).
Table 6. Classification performance report of calibration (C) and validation (V) for surimi grades discrimination (white croaker surimi (A, AA, FA, and SA)).
For surimi species calibration set, 22 of 23 WCS samples were correctly identified, while 1 of 23 was wrongly identified as RCS. For the other two species, all the samples were correctly classified. For surimi grades calibration set, 22 of 23 sample A were correctly identified. For the other grades, all the samples were correctly classified. For validation sample set, all the samples for models of both surimi species and grades were correctly classified. Taking into account the fact that the spectral distances (Mahalanobis distance) between groups (species or grades) were close, some overlapping areas could be observed causing classification errors ( and ). WCS and RCS, and A and AA located closely, respectively, indicating the similarities among samples. Overall, by using NIR spectroscopy combined with DA method, the species and grades of surimi were effectively discriminated.
Figure 6. Classification of three marine fish surimi using discriminant analysis method: □, WCS; △, HS; ○, RCS.
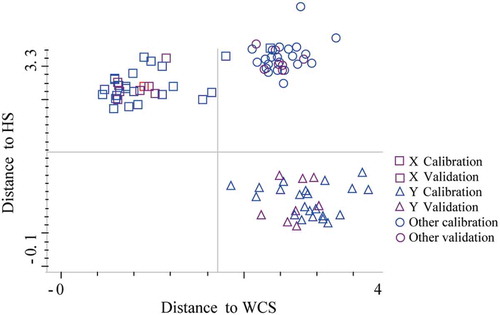
Figure 7. Classification of four grades of white croaker surimi using discriminant analysis method: □,A; △, AA; ○, others.
Conclusion
NIR spectroscopy combined with multivariate analysis after appropriate spectral data pretreatment has been proved to be a very powerful tool for surimi classification. For the discrimination of three species surimi, the correct classification rate of the calibration set and the validation dataset were 98.5% and 100%, respectively, using the DA method after MSC pretreatment. For four grades surimi, DA provided 98.9% and 100% correct classification rate for calibration and validation datasets, respectively, after MSC pretreatment. It has been demonstrated that the developed method may have commercial and regulatory potential to reduce the use of costly chemicals and laborious visual analysis, to avoid time-consuming recalibration work for surimi samples. Further studies will be carried out to examine the feasibility of NIR reflectance spectroscopy discriminating mixed species or grades of surimi samples.
Funding
This work is financially supported by the National Natural Science Foundation of China (Grant Nos. 30901125, 31401571), Natural Science Foundation of Shanghai (Grant No. 14ZR1420000), and Key Projects in the National Science & Technology Pillar Program during the Twelfth Five-Year Plan Period (Grant Nos. 2015BAD17B01 and 2015BAD17B02).
Additional information
Funding
References
- Park, J.W. Surimi and Surimi Seafood; CRC Press: Boca Raton, FL, USA, 2013.
- Chu, W.; Li, Y.; Wang, K.; Chen, D.; Li, H.; Liang, X.; Zhang, J. Expression and Functional Analyses of Two Essential Myosin Light Chains from the Fast White Muscle of the Spotted Mandarin Fish Siniperca Scherzeri. Turkish Journal of Biochemistry-Turk Biyokimya Dergisi 2013, 38, 350–355.
- Pepe, T.; Trotta, M.; Di Marco, I.; Anastasio, A.; Bautista, J. M.; Cortesi, M. L. Fish Species Identification in Surimi-based Products. Journal of agricultural and food chemistry 2007, 55, 3681–3685.
- Zhao, W.; Zhao, Y.; Pan, Y.; Wang, X.; Wang, Z.; Xie, J. Authentication and Traceability of Nibea Albiflora from Surimi Products by Species-specific Polymerase Chain Reaction. Food Control 2013, 31, 97–101.
- Ward, R.D.; Zemlak, T.S.; Innes, B.H.; Last, P.R.; Hebert, P.D. DNA Barcoding Australia’s Fish Species. Philosophical Transactions of the Royal Society B: Biological Sciences 2005, 360, 1847–1857.
- Jin, S.-K.; Kim, I.-S.; Kim, S.-J.; Jeong, K.-J.; Choi, Y.-J.; Hur, S.-J. Effect of Muscle Type and Washing Times on Physico-chemical Characteristics and Qualities of Surimi. Journal of food engineering 2007, 81, 618–623.
- Zhou, X.-X.; Zhao, D.-D.; Liu, J.-H.; Lu, F.; Ding, Y.-T. Physical, Chemical and Microbiological Characteristics of Fermented Surimi with Actinomucor Elegans. LWT-Food Science and Technology 2014, 59, 335–341.
- Owen-Reece, H.; Smith, M.; Elwell, C.; Goldstone, J. Near Infrared Spectroscopy. British journal of anaesthesia 1999, 82, 418–426.
- Guo, X.X.; Hu, W.; Liu, Y.; Sun, S.Q.; Gu, D.C.; He, H.; Xu, C.H.; Wang, X.C. Rapid Determination and Chemical Change Tracking of Benzoyl Peroxide in Wheat Flour by Multi-step IR Macro-fingerprinting. Spectrochimica acta. Part A, Molecular and biomolecular spectroscopy 2016, 154, 123–129.
- Guo, X.-X.; Hu, W.; Liu, Y.; Gu, D.-C.; Sun, S.-Q.; Xu, C.-H.; Wang, X.-C. Rapid Analysis and Quantification of Fluorescent Brighteners in Wheat Flour by Tri-step Infrared Spectroscopy and Computer Vision Technology. Journal of Molecular Structure 2015, 1099, 393–398.
- Huang, F.; Li, Y.; Wu, J.; Dong, J.; Wang, Y. Identification of Repeatedly Frozen Meat Based on Near-Infrared Spectroscopy Combined with Self-Organizing Competitive Neural Networks. International Journal of Food Properties 2015, 19, 1007–1015.
- Ciurczak, E.W.; Igne, B. Pharmaceutical and Medical Applications of Near-infrared Spectroscopy; CRC Press: Boca Raton, FL, USA, 2014.
- Zhang, L.-G.; Zhang, X.; Ni, L.-J.; Xue, Z.-B.; Gu, X.; Huang, S.-X. Rapid Identification of Adulterated Cow Milk by Non-linear Pattern Recognition Methods Based on Near Infrared Spectroscopy. Food chemistry 2014, 145, 342–348.
- Teye, E.; Huang, X.-Y.; Lei, W.; Dai, H. Feasibility Study on the Use of Fourier Transform Near-infrared Spectroscopy Together with Chemometrics to Discriminate and Quantify Adulteration in Cocoa Beans. Food Research International 2014, 55, 288–293.
- Lin, M.; Long, M.; Li, G.; Chen, X.; Zheng, J.; Li, C.; Kan, J. Analysis of Peanut Using Near-Infrared Spectroscopy and Gas Chromatography–Mass Spectrometry: Correlation of Chemical Components and Volatile Compounds. International Journal of Food Properties 2015, 19, 508–520.
- Rohman, A.; Che Man, Y.B.; Nurrulhidayah, A.F. Fourier-Transform Infrared Spectra Combined with Chemometrics and Fatty Acid Composition for Analysis of Pumpkin Seed Oil Blended Into Olive Oil. International Journal of Food Properties 2015, 18, 1086–1096.
- Rohman, A.; Windarsih, A.; Riyanto, S.; Shuhel Ahmad, S.A.; Rosman, A.S.; Yusoff, F.M. Fourier Transform Infrared Spectroscopy Combined with Multivariate Calibrations for the Authentication of Avocado Oil. International Journal of Food Properties 2015, 19, 680–687.
- Liu, Y.; Hu, W.; Guo, X.-X.; Wang, X.-C.; Sun, S.-Q.; Xu, C.-H. Rapid Discrimination of Three Marine Fish Surimi by Tri-step Infrared Spectroscopy Combined with Principle Component Regression. Spectrochimica Acta Part A: Molecular and Biomolecular Spectroscopy 2015, 149, 516–522.
- Hu, W.; Guo, X.-X.; Wang, X.-C.; Zhao, Y.; Sun, S.-Q.; Xu, C.-H.; Liu, Y. Rapid Discrimination of Different Grades of White Croaker Surimi by Tri-Step Infrared Spectroscopy Combined with Soft Independent Modeling of Class Analogy (SIMCA). Food Analytical Methods 2015, 9, 831–839.
- Dhanoa, M.; Lister, S.; Sanderson, R.; Barnes, R. The Link Between Multiplicative Scatter Correction (MSC) and Standard Normal Variate (SNV) Transformations of NIR Spectra. Journal of Near Infrared Spectroscopy 1994, 2, 42–47.
- Zhao, Q.; Zhan, G.; Chen, X. Effects of Multiplicative Scatter Correction on a Calibration Model of Near Infrared Spectral Analysis. Optics and Precision Engineering 2005, 13, 53–58.
- Savitzky, A.; Golay, M.J. Smoothing and Differentiation of Data by Simplified Least Squares Procedures. Analytical chemistry 1964, 36, 1627–1639.
- Chen, Y.; Xie, M.-Y.; Yan, Y.; Zhu, S.-B.; Nie, S.-P.; Li, C.; Wang, Y.-X.; Gong, X.-F. Discrimination of Ganoderma Lucidum According to Geographical Origin with Near Infrared Diffuse Reflectance Spectroscopy and Pattern Recognition Techniques. Analytica chimica acta 2008, 618, 121–130.
- Abdi, H.; Williams, L.J. Principal Component Analysis. Wiley Interdisciplinary Reviews: Computational Statistics 2010, 2, 433–459.
- Cacoullos, T. Discriminant Analysis and Applications; Academic Press, 2014.
- Wang, P.; Zhang, H.; Yang, H.; Nie, L.; Zang, H. Rapid Determination of Major Bioactive Isoflavonoid Compounds during the Extraction Process of Kudzu (Pueraria lobata) by Near-infrared Transmission Spectroscopy. Spectrochimica Acta Part A: Molecular and Biomolecular Spectroscopy 2015, 137, 1403–1408.
- Jiang, H.; Liu, G.; Xiao, X.; Yu, S.; Mei, C.; Ding, Y. Classification of Chinese Soybean Paste by Fourier Transform Near-infrared (FT-NIR) Spectroscopy and Different Supervised Pattern Recognition. Food Analytical Methods 2012, 5, 928–934.