
ABSTRACT
A novel technology based on computer vision system (CVS) and artificial neural network (ANN) was developed for the quality evaluation of Hanyuan Zanthoxylum bungeanum Maxim (HZB). The quality evaluation of HZB mainly depended on its colour, odour substances, and impurities. In this study, the contents of volatile oil (VOC), total alkylamides (TALC) and impurities (IMC) were determined and used as indices for quality control of HZB. Furthermore, CVS was also performed to determine the colour parameters (RGB values) and further transforms to CIE L*, a*, and b*. Then, ANN was carried out to analyse the correlations between colour values obtained by CVS and quality parameters of HZB (VOC, TALC, and IMC). Higher performance and stability were presented by using CVS for determining the coloristic values of HZB. In addition, the present results also showed that the established method based on ANN could be used to predict the VOC, TALC, and IMC of HZB with the R2 values of 0.9991, 0.9995, and 0.9998, respectively. This novel technology based on CVS combined with ANN could be used for the rapid, non-destructive, and effective evaluation of the quality of HZB.
Introduction
Belonging to the Rutaceae family, Hanyuan Zanthoxylum bungeanum Maxim (HZB) is called “Gongjiao” as a tribute from the Tang Dynasty in China. Hanyuan was also known as “the Chinese prickly ash village”. HZB is used as a famous and popular spice with good flavour;[Citation1] furthermore, the pericarp of HZB was also effective for the therapy of pathogenic wind, epigastric pain, eczema, pruritus, fungal infection, diarrhoea, and dysentery.[Citation2–Citation4] In addition, the fruits of HZB are widely used for preparation of other agents, such as insecticides, air fresheners, pesticides, and drugs.[Citation5] The current supply of HZB cannot meet the needs of people, resulting in a high price and confusion of species in the market. Thus, the establishment of an effective method for the rapid identification and objective evaluation of HZB is particularly important. Presently, the quality evaluation of HZB mainly depends on its colour and degree of “ma” (a pungent taste) and odour.[Citation6] The common quality evaluation of HZB includes instrumental analysis and human sensory analysis. Instrumental analysis methods (HPLC, UV, and GC) are usually utilized for quality evaluation in laboratory. However, applying these techniques in the HZB industry has some disadvantages such as their destructive nature, implementation expense, and a time requirement. For human sensory analysis, the appearance, taste, and odour of HZB are assessed by specially trained people, and this method is widely accepted in the overall quality evaluation of HZB. Using this method, it is likely to influence the quality evaluation results of HZB due to the poor objectivity and reproducibility by people’s sensory fatigue.[Citation7]
Computer vision system (CVS) is a mature technology for identifying food and other agricultural products by extracting and analysing quantitative information from the image.[Citation8,Citation9] Previous studies have reported that CVS is an effective way for colour measurement, and it could convey significant objective information about colour and convert colour to practical value.[Citation8,Citation10,Citation11] Meanwhile, Cevoli et al.[Citation12] have observed that artificial neural network (ANN) can provide higher classification and prediction probability than conventional multivariate analysis for complex nonlinear data. Moreover, Shafiee et al.[Citation11] have reported the development of CVS for the non-destructive characterization of honey based on colour and its correlated chemical attributes by applying the ANN model have proved this model as a precise and fast colorimeter for honey colour assessment. Simultaneously, Azizi A et al.[Citation13] also revealed that the computer vision technique and neural network analysis could identify potato varieties with acceptable accuracy.
In this study, colour is an important indicator for evaluating the quality of HZB since it has a wide range from light red to dark red, and the change in colour relies on various factors, such as the degree of “ma”, the content of odour substances, and impurities. Commonly, the evidence of the unique character from HZB mainly depends on its total alkylamides content (TALC), volatile oil content (VOC), and impurity content (IMC). Hence, lower-degree HZB usually has a lighter colour range, lower pungent components, odour substances, and higher impurity. On the contrary, higher-degree HZB generally has a darker colour range, higher pungent components, odour substances, and lower impurity.[Citation14,Citation15] Previous studies indicated that 25 pungent components are separated, and the main tingling-taste substances have been identified from unsaturated alkylamides with trans- and cis-isomers, such as hydroxy-α-sanshool, hydroxy-β-sanshool, hydroxy-ε-sanshool, hydroxy-δ-sanshool, α-sanshool, β-sanshool, γ-sanshool, δ-sanshool, etc.[Citation16–Citation18] Moreover, volatile oils are also the main aroma ingredients and 64 volatile chemical constituents were found in Z. bungeanum Maxim from different habitats.[Citation19]
The aim of the present study was to develop a rapid, cheap, non-destructive, and functional method for objectively evaluating the quality of HZB based on CVS and the measurement of the correlated chemical attributes including TALC, VOC, and IMC. The ANN model was applied to transform the RGB values of images to CIE L*, a*, and b* and H, S, and V colorimetric measurement and to predict the content of TALC, VOC, and IMC from the colour characteristic of the image.
Materials and methods
HZB samples and chemicals
A total of 120 HZB samples were collected from Hanyuan (Sichuan, China) and divided into three grades (I–III) in accordance with the quality classification of Chinese prickly ash (LY/T 1652-2005), and each grade contains 40 batch samples.[Citation14] HZB samples were identified by Professor Min Li (College of Pharmacy, Chengdu University of TCM). All samples were crushed over a sieve III filter, and then placed in a dryer and dried before use. In this study, all chemicals and solvents for analysis were of analytical grade with the higher purity available. The purity chromatography-grade (AR) methanol was purchased from Chengdu Kelong chemical reagent factory, Sichuan, China. A new tingling-taste reference substance (purity ≥ 99.6%) hydroxy-β-sanshool was prepared by ourselves and applied as a standard substance.
Total alkylamides content
The testing samples (0.5 ± 0.0001 g) were precisely weighed and placed in an erlenmeyer flask, and then 50 mL of methanol was added by ultrasonic vibration extraction. Next, 30 μL of sample solutions was dissolved by 10 mL methanol, and then 4 mg (accurate to 0.1 mg) hydroxy-β-sanshool, used as the tingling-taste reference substances, was dissolved by 100 mL methanol (the final concentration of hydroxy-β-sanshool was 40 mg/mL). The absorbance values were determined under 266 nm using a double-beam UV–Vis spectrophotometer (Purkinje General Instrument Co, Ltd, Beijing, China).
Impurity content
All HZB samples were precisely weighed about 200 g (accurate to 100 mg) on a white porcelain plate and the impurities were picked out including apparent inherent impurities and foreign impurities with tweezers, and then the content of the impurities was calculated.
Volatile oil content
For the volatile content, the results were measured according to distillation stipulated by the quality classification of Chinese prickly ash (LY/T 1652-2005).[Citation14] The method was performed as follows: about 20 g HZB samples powders were weighed and placed in a 500 mL round-bottomed flask, and then 300 mL distilled water was added and soaked for 2 h. Finally, the volatile oil volumes were determined.
Colour measurement
CVS assay
The CVS consisted of four major components: projective box, lighting source, digital camera, and computer hardware and software. The CVS assay method was carried out with minor modification by Xu et al.[Citation9] The procedure was performed as follows. The image acquisition system used in this research consists of three components: an RGB colour camera (EOS 60D, Canon Inc., Japan) at a resolution of 3296 × 2472 pixels; the camera parameters were as follows: shutter speed 1/80s; manual operation mode; aperture Av F/6.3; ISO velocity 400; flash off; focal distance 87 mm; and lens: EF-S 60 mm f/2.8; four fluorescent lights (Philips Master TL-D 50 De Luxe 18W/965) for illumination at a 45° angle to sample and with a colour temperature of 5000 K; and a computer installed with software for image processing. The camera was calibrated by customizing the white balance using a white card (White Balance Card, 21.59 × 27.94 cm, X-rite) before capturing images.
Image processing
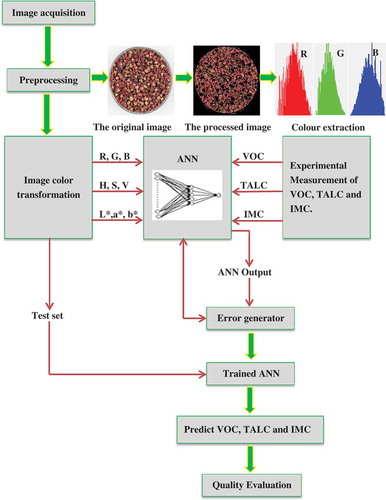
The image preprocessing procedures by CVS are presented in . After image acquisition, the original image was processed, and the obtained characteristic image was extracted from the centre of each image of HZB. First, the background was removed from the testing images. Then, objects were separated (segmentation was made), which means that the image was divided into parts corresponding to individual objects visible on the image (areas representing the testing samples). Finally, the software had developed a function calculating the average value of RGB in all pixels, and then CIE L*, a*, and b* and H, S, and V transformations were implemented. In total, 120 randomly chosen samples from each group were imaged (each sample was photographed three times in parallel, respectively), and the parameters of R, G, and B and CIE L*, a*, and b* were obtained for analysis. All the values of these parameters were transformed to the range of 0 ~ 255 before analysing.
Figure 1. The procedure designed for predicting the chemical attributes of HZB by computer vision system and artificial neural networks.
Colour transformation
In this research, the threshold segmentation was employed to obtain the target area by subtracting the background of the image with two expanded and three eliminated noises. The image colour information was stored in the sRGB colour space model according to this style as follows. First, each pixel of the processing image is extracted from three channels, and then the colour values of R, G, and B were converted into three coordinates of red, green, and blue. Lastly, the colour values of R, G, and B were transformed to the CIE L*, a*, and b* and H, S, and V through an equation model in colour space (L* representing the range of lightness, a* and b* representing the range of colour from red to green and yellow to blue, respectively).
Artificial neural networks
In our present investigation, ANN was applied with Matlab. R2012a software (Math works, USA). ANN is a mathematical algorithm that has the capability of relating the input and output parameter, and studying from examples through iteration without requiring prior knowledge on the relationships between the process variables. Shafiee et al.[Citation11] and Silva et al.[Citation20] have reported the development of a CVS for the non-destructive characterization of honey based on colour and its correlated chemical attributes by applying ANN models and have proved this model as a precise and fast colorimeter for honey colour assessment. Moreover, Silva et al.[Citation20] predicted the physicochemical changes agreed very well with the experimental data and showed high classification accuracy for testing (> 90%) and training set (> 85%); the result indicated that the ANN has high classification performance for the evaluation of extra virgin olive oil stability using ANN. In this study, two feed-forward networks with input, output, and hidden layers were used for colour characterization and VOC, TALC, and IMC prediction. A fast procedure was performed with the input layer of the network for HZB colour measurement consisting of three neurons, which corresponded to CIE L*, a* and b*, H, S, and V values after the R, G, and B values were transformed and extracted from the HZB sample images. The output layer had three neurons representing the content of VOC, TALC, and IMC, respectively. Furthermore, the input data would be normalized for obtaining better training effect so that it ranged from zero to one before training. Meanwhile, anti-normalization is performed after obtaining the desired result of training.
Results and discussion
HZB colour and its relationships with TALC, VOC, and IMC
The results of colour and the related chemical components are expressed as Mean ± SD in . Moreover, presents the results of the method validation of colour measurement with RSD for Grade I, Grade II, and Grade III, respectively. The method of TALC measurement was validated with satisfactory precision, stability, repeatability, and recovery with RSD of 0.81%, 1.15%, 1.10%, and 2.21% in , respectively.
Table 1. Colour parameters, VOC, and IMC of HZB samples.
Table 2. Result of method validation of colour measurement (CIE L*, a*, and b*) with RSD for Grade I, Grade II, and Grade III, respectively.
Table 3. Result of method validation of TALC measurement.
Besides, a strong correlation was presented through SPSS 19.0 statistical analysis, and it has been found that the darker colour the HZB, the higher the TALC, VOC, and IMC contents. The relationships between HZB colour and the contents of TALC, VOC, and IMC are presented in the correlation matrix in (presenting Pearson correlation coefficients). All the relationships are statistically significant (p < 0.01). The highest correlation coefficients are found in the relationship between the TALC content and the IMC content (–0.848), followed by CIE a* and IMC (–0.811). The lowest correlation (0.522) was found for CIE b* and TALC in comparison with the relationship of the value of colour and content. However, there is no significant difference between the L* parameter and these three component contents. Meanwhile, the result of the above-mentioned discussion has demonstrated that HZB colour is an important feature index for the quality evaluation of HZB. Therefore, it is possible to develop a feasible method with a proper instrument to measure the HZB colour-constitute parameters such as VOC, TALC, and IMC.
Table 4. The relationships between HZB colour and the content of TALC, VOC, and IMC are presented in the correlation matrix (presenting Pearson correlation coefficients).
Computer vision system and artificial neural network combination
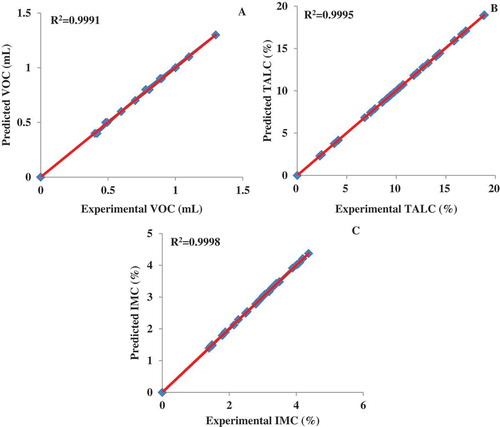
The main objective of this study was to demonstrate the applicability of CVS–ANN combination as a simple and potential tool for colour measurement and prediction of the chemical attributes (VOC, TALC, and IMC). The procedure was designed for predicting the chemical attributes of HZB by using CVS and ANNs in . Network is an important factor in the ANN design since the model has a significant influence on the final network accuracy for selecting the optimum number of neurons in the hidden layer; the training step started with 1–10 neurons. In this study, a three-layer model of the BP neural network was developed, and 10 eventually was defined as the number of hidden-layer neurons after repeatedly training passed. The original data were divided into three groups (70% data were randomly selected for building the model, 15% data were used for validation, and the remaining 15% of data were used for testing). In addition, presents the correlations between the predicted and experimental values after training in A, B, and C, and the correlation coefficient with R2 of 0.9991, 0.9995, and 0.9998 in VOC, TALC, and IMC, respectively. Kılıc et al.[Citation21] have shown that an automated classification system for beans using CVS and ANN can produce high-performance, reproducible, and objective classification of samples, and it also eliminates the possible misclassifications of samples, which might be done by human inspectors. The input layer of the network consisted of nine neurons, which corresponded to the colour feature R, G, and B values and CIE L*, a* and b* and H, S, and V were extracted from the HZB sample images. The output layer had three neurons representing the content of VOC, TALC, and IMC, respectively. The CVS–ANN combination exhibited good prediction for the validation and test sets. Finally, these results showed that colour parameters were good predictors for HZB VOC, TALC, and IMC. Furthermore CVS–ANN combination is a good tool for the non-destructive measurement of HZB quality evaluation.
Figure 2. Correlations between the predicted and experimental values of VOC (A), TALC (B), and IMC (C) after trained.
Conclusion
This work was conducted using CVS combined with ANN to evaluate the different degrees of HZB non-destructively, quickly, and conveniently. The result of the experiment showed that there was a higher correlation between the coloristic value of HZB and the contents of TALC, IMC, and VOC. Consequently, the obtained results showed that the internal ingredients affected the colour change and further affected the quality evaluation of HZB. CVS combined with ANN can represent a fast, cheap, and effective method to verify and predict the HZB grades. In conclusion, this novel method based on CVS and ANN could be further used and developed for industrial-quality evolution of HZB.
Acknowledgements
The authors are greatly thankful to the government (Hanyuan County, Sichuan, China) for providing different grades of HZB samples.
Funding
This work was supported by provincial horizontal issues “Chinese Hanyuan prickly ash deep processing of key generic technologies and industrialization” (Project SEQ ID no: 2014PT048).
Additional information
Funding
References
- Deng, Z.Y.; Sun, B.Y.; Kang, K.G.; Dong, Y.G. Analysis of the Main Nutritional Labeling in the Tender Bud of Zanthoxylum bungeanum. Journal of Northwest Forestry University 2005, 20, 179–180.
- Gong, Y.W.; Huang, Y.F.; Zhou, L.G.; Shi, X.Y.; Guo, Z.J.; Wang, M.G.; Jiang, W.B. Chemical Composition and Antifungal Activity of the Fruit Oil of Zanthoxylum bungeanum Maxim. (Rutaceae) from China. Journal of Essential Oil Research 2009, 21, 174–178.
- Lan, Y.; Wu, Q.; Mao, Y.Q.; Wang, Q.; An, J.; Chen, Y.Y.; Wang, W.P. Cytotoxicity and Enhancement Activity of Essential Oil from Zanthoxylum bungeanum Maxim. As a Natural Transdermal Penetration Enhancer. Journal of Zhejiang University-SCIENCE B 2014, 15, 153–164.
- Wei, S.G.; Zhang, H.H.; Wang, Y.Q.; Wang, L.; Li, X.Y.; Wang, Y.H.; Zhang, H.Q. Ultrasonic Nebulization Extraction-heating Gas Flow Transfer-Headspace Single Drop Microextraction of Essential Oil From Pericarp of Zanthoxylum bungeanum Maxim. Journal of Chromatography A 2011, 1218, 4599–4605.
- Wu H.; Li ML. Deep Processing and Industrialization of Traditional Chinese Prickly Ash. Agricultural Network Information 2006, 5, 159–161.
- Tao, X.B.; Zhao, C.B.; Jiang, W.D.; Yu, X.Q.; Wu, C.J. Study on Quality Standard of Zanthoxylum bungeanum and Zanthoxylum oil. China Condiment 2016, 41, 144–146.
- Yang, S.L.; Xie, S.P.; Xu, M.; Zhang, C.H.; Wu, N.; Yang, J.; Zhang, L.; Zhang, D.Y.; Jiang, Y.; Wu, C.J. A novel Method for Rapid Discrimination of Bulbus of Fritillaria by using Electronic Nose and Electronic Tongue Technology. Analytical Methods 2015, 7, 943–952.
- Hong, H.; Yang, X.; You, Z.; Cheng, F. Visual Quality Detection of Aquatic Products using Machine Vision. Aquacultural Engineer 2014, 63, 62–71.
- Xu, M.; Yang, S.L.; Peng, W.; Liu, Y.J.; Xie, D.S.; Li, X.Y.; Wu, C.J. A Novel Method for the Discrimination of Semen Arecae and its Processed Products by using Computer Vision, Electronic Nose, and Electronic Tongue. Evidence-Based Complementary and Alternative Medicine 2015, 2015, 1–10.
- Huang, L.; Zhao, J.; Chen, Q.; Zhang, Y. Nondestructive Measurement of Total Volatile Basic Nitrogen (TVB-N) in Pork Meat by Integrating Near Infrared Spectroscopy, Computer Vision and Electronic Nose Techniques. Food Chemistry 2014, 145, 228–236.
- Shafiee, S.; Minaei, S.; Moghaddam-Charkari, N.; Barzegar, M. Honey Characterization using Computer Vision System and Artificial Neural Networks. Food Chemistry. 2015, 159, 143–150.
- Cevoli, C.; Cerretani, L.; Gori, A.; Caboni, M.F.; Gallina, Toschi, T.; Fabbri, A. Classification of Pecorino Cheeses using Electronic Nose Combined with Artificial Neural Network and Comparison with GC–MS Analysis of Volatile Compounds. Food Chemistry 2011, 129, 1315–1319.
- Azizi, A.; Abbaspour-Gilandeh, Y.; Nooshyar, M.; Afkari-Sayah, A. Identifying Potato Varieties using Machine Vision and Artificial Neural Networks. International Journal of Food Properties 2016, 19, 618–635.
- FSC (Forestry Standard of the People ‘s Republic of China). Quality Classify of Chinese prickly ash (LY/T 1652-2005); State Forestry Administration (China): Beijing, 2005.
- SAC (Standardization Administration of the People’s Republic of China). Chinese Prickly Ash (GB/T 30391-2013);Chinese Standard Publishing House (China): Beijing, 2013.
- Wang, S.H.; Xie, J.C.; Yang, W.; Sun, B.G. Preparative Separation and Purification of Alkylamides from Zanthoxylum bungeanum Maxim by High-speed Counter-current Chromatography. Journal of Liquid Chromatography & Related Technologies 2011, 34, 2640–2652.
- Wang, S.X.; Zhao, L.; Si, B.L.; Zhi, R.C.; Zhou, X.L. Research Progress on Chemical Basis of Pungency in Zanthoxylum bungeanum. Chinese Traditional & Herbal Drugs 2013, 44, 3406–3412.
- Yang, X.G. Aroma Constituents and Alkylamides of Red and Green Huajiao (Zanthoxylum bungeanum and Zanthoxylum schinifolium). Journal of Agricultural & Food Chemistry 2008, 56, 1689–1696.
- Chen, G.J.; Kan, J.Q.; Li, J.; Shi, K.W.; Zhang, Y. Analysis of Essential Oil Compounds in Z. bungeanum Maxim from Different Habitats. Journal of the Chinese Cereals & Oils Association 2015, 30, 81–87.
- Silva, S.F.; Anjos, C.A.; Cavalcanti, R.N.; Celeghini, RMDS. Evaluation of Extra Virgin Olive Oil Stability by Artificial Neural Network. Food Chemistry 2015, 179, 35–43.
- Kılıc, K.; Boyac, I.H.; Koksel, H.; Kusmenoglu, I. A classification System for Beans using Computer Vision System and Artificial Neural Networks. Journal of Food Engineering 2007, 78, 897–904.