
ABSTRACT
The study investigated effects of high hydrostatic pressure (100, 250, 450, and 500 MPa for 5 min) on components and functions of photosystem II in spinach. Results showed that chlorophylls and soluble protein contents of high hydrostatic pressure–treated samples were higher than those of thermal-treated ones. High hydrostatic pressure treatments induced less degradation of protein peptide components than thermal treatment. Otherwise, chlorophylls’ absorption and fluorescence spectra capacities were better retained by high hydrostatic pressure treatments compared with thermal treatment, revealing higher light-harvesting and light-exciting efficiencies. The retentions of photosystem II components and functions posed a positive role for preservation of chlorophylls and chlorophyll–protein complexes.
Introduction
For processed green vegetables, colour is an important quality parameter affecting sensory perception and consumer acceptance.[Citation1] Chlorophylls, as the most widely distributed green vegetable pigment, directly affect colour quality of green vegetables. In green plants, 80% of chlorophylls are attached by non-covalent bonds to protein existing in the form of chlorophyll–protein complexes, including photosystem I (PS I), photosystem II (PS II), and Cytb6/f complexes. All of chlorophyll–protein complexes are located in the electron transport chain (ETC) of thylakoid membrane, involving in the transport of photosynthesis electron in green plant.[Citation2] There is a close relationship between chlorophyll–protein complexes and chlorophylls, especially for chlorophyll–protein complexes PS II, responsible for the light reaction of green plants. On the one hand, as the original component of ETC, PS II plays a key role for retention of ETC and chlorophyll–protein complexes in the ETC, mainly including light harvest complex II (LHC II), CP43, CP47, CP23, CP26, and CP29 components. LHC II, combined with 12 molecules of chlorophylls, contains about 50% of plant pigments and causes light absorption, catalyzing light to generate oxygen, protons, and electrons. Thereafter, the light energy harvested by LHC II is transported to the core antenna CP43 and CP47 by the outer antenna CP23, CP26, and CP29, then transported to the reaction centre of PS II by CP43 and CP47 components.[Citation3] Meanwhile, D1 and D2 protein peptide components are also very important for the retention of PS II structure. All the aforementioned components of PS II contribute to the retention of ETC and chlorophyll–protein complexes in the ETC. On the other hand, PS II is more sensitive compared with other chlorophyll–protein complexes in the ETC. The degradation of PS II can destroy the integrity of ETC and induce the degradation of chlorophyll–protein complexes in the ETC. Hence, variations in PS II components and functions can affect the degradation of chlorophylls by altering chlorophyll–protein complexes in the ETC.
High hydrostatic pressure (HHP), as an essential “non-thermal” pasteurization method, is used commercially, since it posed little influence on the covalent bonding of low-molecular-weight compounds.[Citation4,Citation5] Changes in colour characteristics of HHP-processed green vegetables have attracted much attention for its influence on the sensory perception of processed vegetables. Many results indicated that HHP treatment posed a positive role for the retention of green colour, and the effect could be maintained during storage process,[Citation6] which was mainly explained by the inhibition of chlorophylls degradation.[Citation7,Citation8] In our previous research, the result also indicated that the inhibitory effect of HHP on chlorophylls’ degradation was critical for sustaining colour quality in processed green vegetables. Meanwhile, –a* values in HHP-treated samples could be affected by light storage, and samples stored at 4°C/2000 lux presented higher –a* values than those stored at 4°C/dark throughout storage process.[Citation8,Citation9] According to the relationship between PS II and chlorophylls, a minimal effect of HHP on PS II components and functions could be the reason that HHP-processed spinach retained a better colour during light storage. As the original component of ETC, the retention of PS II components and functions is very critical for the stability of ETC and chlorophyll–protein complexes in the ETC. Hence, it is speculated that HHP treatments had limited effect on PS II, and light reaction activities of PS II also could be maintained. Schlüter et al.[Citation10] showed that the negative effects of lower pressure (125 MPa) on photosynthesis were more or less fully reversible within 24 h using chlorophyll fluorescence image analysis. Eggleston and Tanner[Citation11] showed that carrot treated with 600 MPa HHP (2, 5, 10 min) could retain a low respiration activity even with the most severe treatment. However, knowledge about the effects of HHP on PS II components and functions in spinach is not available. In addition, few studies focusing on the relationship between PS II and chlorophylls by HHP are performed until now.
Spinach (Spinacia oleracea L.) was selected as the experimental material in this study for its higher chlorophyll content. Based on the previous results, the objective of this study was to further analyse the effects of HHP on chlorophylls based on the changes of PS II components and functions contributing to stability of ETC and chlorophyll–protein complexes in the ETC.
Materials and methods
Chemicals
Chlorophyll standards were purchased from Sigma Aldrich Co. (St. Louis, MO, USA). Chemicals of high-performance liquid chromatography (HPLC) grade were obtained from Honeywell Burdick and Jackson (SK Chemicals, Soowon, Korea) and MREDA Technology, Inc. (Columbia, SC, USA). TGX sodium dodecyl sulphate polyacrylamide gel electrophoresis (SDS-PAGE) gel, 10× Tris/glycine/SDS buffer, and Bio-Safe Coomassie G-250 stain from Bio-Rad (Hercules, CA, USA) were used for SDS-PAGE. All other reagents of analytical grade used in the experiment were obtained from Sinopharm Chemical Reagent Co., Ltd. (Beijing, China).
Preparation of PS II
Fresh spinach was purchased from the local market in China Agricultural University, and washed with running water and drained at room temperature. PS II solution extracted from fresh spinach leaves was selected to investigate the effects of HHP and thermal treatments on the components and functions of PS II. PS II solution was isolated according to the method of Kuwabara and Murata.[Citation12] All procedures were performed at 4°C. Briefly, 100 g of spinach was homogenized with 300 mL precooled extraction solution (pH 7.4, containing 0.1 M sucrose, 0.2 mM NaCl, and 0.05 M NaH2PO4–K2HPO4) for 1 min until no obvious green debris. The spinach puree was filtered through four layers of gauze, centrifuged at 3000g for 5 min to get chloroplast-containing pellet, then suspended with 10-fold volume of precooled extraction solution, centrifuged at 500g for 2 min to get suspension solution, further centrifuged at 3000g for 5 min to get precipitation (thylakoid membrane). The precipitation was suspended in quintuple volume of precooled suspension solution (pH 6.5, containing 0.3 M sucrose, 0.05 mM NaCl, and 0.05 M NaH2PO4–K2HPO4), and the content of chlorophylls was analysed. Then, 20% Triton X-100 solution was added to suspension solution (chlorophylls content: Triton X-100 = 1:20), stood for 60 s, and centrifuged at 1000g for 2 min to get supernatant, further centrifuged at 35,000g for 10 min to get precipitation. The precipitation was suspended in precooled suspension solution (pH 6.9, containing 0.04 M NaH2PO4–K2HPO4), centrifuged at 1000g for 2 min to get supernatant, then centrifuged at 35,000g for 10 min to get PS II particle. The PS II particle was suspended in precooled suspension solution (pH 6.9, containing 0.31 M sucrose, 0.05 mM NaCl, and 0.05 M NaH2PO4–K2HPO4) to get PS II particle solution, and the solution was stored at –80°C.
About 30 mL PS II solution was packaged into 0.20 mm thickness plastic bags of (21 cm length × 7.5 cm width), which was composed of two layers of polymers (BOPA/LDPE) to seclude oxygen. To reduce the final dissolved oxygen content, vacuum packaging was performed using a DZ-600/2S packaging machine (Zhucheng Xiaokang Food Packing Machinery Co., Ltd., China). Following vacuum packaging and prior to processing, the samples were placed in cold water (1°C–3°C for 20 min).
HHP and thermal treatments
HHP-treated PS II solution was carried out in a 7 L cylindrical loading container of a high-pressure equipment (CAU-HHP-700-6, Baotoukefa High Pressure Technology Co., Ltd, Baotou, China). The samples were treated at 100, 250, 450, and 500 MPa for 5 min, respectively. The pressure increased at the rate of 133 MPa min–Citation1 and released within 15 s. The time of HHP treatment in this study did not include the come-up and pressure-release time. The initial temperature in the processing vessel was approximately 25°C and increased to 40°C when 500 MPa pressure was applied, which was calculated according to the rule: 3°C increased per 100 MPa loaded. Water was used as pressurizing medium. Each HHP treatment was performed in triplicate. After HHP processing, all samples were placed in an ice-water bath for 5 min before analysis.
Thermally treated PS II solution was exposed in 100°C steam environment for 60 s at atmospheric pressure to simulate the blanching process. Thermal treatment was performed in triplicate. After heating, all samples were cooled in an ice-water bath for 5 min before analysis. Untreated samples were used as control.
HPLC analysis of chlorophylls’ content
Extraction of chlorophylls from PS II solution was done according to the method described by Rudra et al.[Citation13] Briefly, 200 μL PS II solution was mixed with 3.8 mL 80% (v/v) cold acetone solution, centrifuged at 3000g for 10 min at 4°C. The supernatant was collected and filtered through a Millipore filter (0.22 µm) before HPLC analysis.
HPLC analysis was carried out with a Waters HPLC System (Waters 2695 Separations Module, USA) equipped with a photodiode array detector (Waters 2996, USA) according to the method of Teng and Chen.[Citation14] Chlorophylls were separated within 20 min by a C18 column (Cosmosil 5C18-AR- II; 250 × 4.6 mm; i.d., 5 µm; Nacalai Tesque, Inc., Japan) with a flow rate of 1.0 mL min–Citation1 at 30°C, using a solvent system of acetonitrile/methanol/chloroform/n-hexane (75:12.5:7.5:7.5, v/v/v/v) as the isocratic mobile phase. The injection volume was 20 µL. Identification of chlorophyll-a and -b was based on the comparison with peaks of standards according to the absorption spectrum at 432 nm. Results were expressed as milligrams per milliliter PS II solution.
Soluble protein content measurement
The soluble protein content was determined using the Bradford method, with bovine serum albumin (BSA) as standard.[Citation15] Coomassie brilliant blue solution consisting 4.7% (w/v) ethanol, 8.5% (w/v) phosphate, 0.01% (w/v) coomassie brilliant blue G-250 was used in this experiment. The reaction mixture consisted BSA standard solution or PS II solution (250 μL), 0.15 mol L–Citation1 NaCl (supplied to 500 μL), 5 mL coomassie brilliant blue solution, reacted at room temperature for 2 min, and the absorption value was measured immediately at 595 nm using spectrophotometer. The whole analysis was finished within 1 h. Results were expressed as milligrams per milliliter PS II solution.
Protein peptide components’ analysis
Analytical SDS-PAGE was carried out according to the method of Shan et al.[Citation16] in a PowerPacTM Basic power supply (Bio-Rad). Samples were prepared by mixing 20 μL of thylakoid membrane solution and 20 μL of sample buffer comprising 950 μL of 62.5 mmol L–Citation1 Tris/HCl (pH 6.8, containing 250 g L–Citation1 glycerol, 20 g L–Citation1 SDS, and 15 g L–Citation1 DTT). The composition of the running buffer was 25 mmol L–Citation1 Tris/192 mmol L–Citation1 glycine (pH 8.3, containing 1 g L–Citation1 SDS). The electrophoresis unit was connected to the power supply, and electrophoresis unit was conducted first at a constant voltage of 100 V for 20 min and then at a constant voltage of 200 V for 40 min. After electrophoresis, the developed gel was dipped into staining solution (containing 5 g L–Citation1 Coomassie G-250, 30% methanol, and 20% glacial acetic acid) in a container on an undulating shaker for 30–60 min and rinsed with distilled water twice for 2 h, then added destaining solution (containing 24% ethanol and 8% glacial acetic acid) for 10 min. SDS-PAGE electropherograms were obtained using a Gel Doc Imager (Bio-Rad) that was operated by Image Lab, version 4.1 (Bio-Rad).
Chlorophylls’ absorption spectra analysis
Chlorophylls’ absorption spectra of PS II was performed by using a Shimadzu UV-1800 spectrophotometer with a slit width of 1.0 nm, scanning from 360 to 720 nm wavelength range, high-speed scanning, and the interval of samples was 0.5 under single scan mode. Briefly, 5 mL 80% (v/v) cold acetone was mixed with 50 μL PS II solutions, centrifuged at 1200g for 10 min at 4°C. The supernatant was used for the measurements of chlorophylls’ absorption. Cold acetone solution (80% v/v) was used as the blank. A fourth derivative analysis of absorption spectra of chlorophylls was taken into account as the limitations of the method.[Citation17] The same spectra were fitted using Gaussian bands, according the procedure of Šiffel and Braunová.[Citation18] The method, based on fixed parameters, is suitable for comparison of amplitudes. The same maximum and bandwidths were initially kept fixed and the amplitudes changed to obtain first approximate reconstructed spectra for absorption spectra of chlorophylls. Subsequently, a fitting algorithm was run to obtain a more precise correlation with the original spectra.
Chlorophylls’ fluorescence spectra analysis
Chlorophylls fluorescence spectra of PS II solution was measured with a Cary Eclipse Fluorescence Spectrophotometer (Varian, Inc., USA) according the method of Ferroni et al.[Citation17], using a quartz cuvette of 0.2 cm optical path at a temperature of 25 ± 1°C. Both of the emission and excitation slits were 10 nm. The emission spectra (λem from 600 to 750 nm) of PS II chlorophylls was obtained by scanning at its maximum excitation wavelength (λex = 436, 475 nm), and the excitation spectra (λex from 400 to 500 nm) of PS II chlorophylls was obtained by scanning at its maximum emission wavelength (λem = 680 nm). A fourth derivative and Gaussian components analysis were the same as the procedures of chlorophylls’ absorption spectra.
Protein fluorescence spectra analysis
Protein fluorescence spectra of PS II was measured with a Cary Eclipse Fluorescence Spectrophotometer (Varian, Inc.), using a quartz cuvette of 0.2 cm optical path at a temperature of 25 ± 1°C. The emission slit was 10 nm. The emission spectra (λem from 300 to 400 nm) of PS II protein were obtained by scanning at its maximum excitation wavelength (λex = 278 nm).
Statistical analysis
Analysis of variance (ANOVA) with Tukey’s test (5% significance level), spectra fourth derivative, and Gaussian deconvolution were carried out using the software Microcal Origin 8.0 (Microcal Software, Inc., Northampton, MA, USA). All analyses were performed in triplicate and the results were expressed or plotted as the mean value ± standard deviation (SD).
Results and discussion
Effects of HHP on PS II components
Chlorophylls’ content
Effects of HHP on chlorophylls’ content of PS II are shown in . Compared with untreated sample, HHP and thermal treatments decreased chlorophylls’ content to some degree. The contents of chlorophyll-a and -b were maintained at 0.253 and 0.196 mg mL–Citation1 in HHP-treated samples, even after 500 MPa HHP treatment. However, the contents of chlorophyll-a and -b significantly (p < 0.05) decreased to 0.199 and 0.158 mg mL–Citation1 after thermal treatment, respectively. It indicated that thermal treatment caused a higher degradation of chlorophyll-a and -b than HHP treatment. Wang et al.[Citation9] also observed the degradation of chlorophylls caused by thermal treatment, since it induced the collapse of PS II and the separation of chlorophylls and protein. Meanwhile, chlorophyll-a represented less pressure-stable compared with chlorophyll-b. This observation was in accordance with the research of Van Loey et al.,[Citation19] which also found that chlorophyll-b had a greater resistance to pressure than chlorophyll-a in HHP-treated broccoli juice.
Table 1. Effects of HHP on chlorophyll content of PS II extract solution*.
Soluble protein content
Effects of HHP on soluble protein content of PS II are presented in . As an important component of PS II, soluble protein contributes to functions of PS II, which retains chlorophyll–protein complexes and chlorophylls.[Citation20] As shown in , the soluble protein content of PS II decreased significantly (p < 0.05) after HHP and thermal treatments. However, no significant (p > 0.05) difference in the soluble protein content of PS II was observed between HHP and thermal treatments. All samples were maintained at above 1.80 mg mL–Citation1 after HHP treatments, it is close to the untreated sample (1.92 mg mL–Citation1). However, soluble protein content significantly (p < 0.05) decreased to 0.28 mg mL–Citation1 after thermal treatment. Changes of soluble protein content induced by HHP and thermal treatments were in accordance with changes of chlorophylls’ content, as it was caused by dissociation of chlorophyll–protein complexes PS II. The retention of soluble protein and chlorophylls’ contents reflected the stability of PS II in HHP-treated samples, it was of great benefit to the retention of ETC and chlorophyll–protein complexes in the ETC.
Figure 1. Effects of HHP on soluble protein content of PS II extract solution. Different letters (a–c) in the column means significant difference at 0.05 level (p < 0.05).
Protein peptide components
Effects of HHP on protein peptide components of PS II are shown in . CP47, CP43, D1, D2, LHC II, CP29, and CP26 protein peptide components were found in all the samples. The light harvested by LHC II was first transported to CP43 and CP47 via CP29 and CP26, then transported to the reaction centre D1 and D2. Meanwhile, as the components of PS II reaction centre, D1 and D2 are necessary for the retention of PS II structure. Hence, changes of above protein peptide components could affect the structure and functions of PS II. The degradation of CP47, D1, D2, CP29, and CP26 peptide components in HHP-treated samples was less than that of thermal-treated ones. It indicated that HHP treatment showed a better retention of PS II structure, light-harvesting, and light-exciting actives than those of thermal treatment, respectively. However, CP43, LHC II, and CP24 protein peptide components accumulated after HHP and thermal treatments, and the accumulation was more significant under thermal treatment than HHP treatments. The possible explanation being that higher pressure and thermal treatments prompted the outer antenna accumulating of PS II, which was a kind of adaptation mode under stress.[Citation21] Overall, protein peptide components of HHP-treated samples were better retained than those of thermal-treated samples, and HHP treatment showed a positive role for the retention of PS II structure, components, and functions.
Figure 2. Effects of HHP on protein peptide components of PS II extract solution. The loaded chlorophyll concentrations of control, thermal, 100, 250, 450, and 500 MPa were 0.497, 0.357, 0.467, 0.472, 0.455, and 0.449 mg mL–Citation1, respectively.
Effects of HHP on PS II functions
Chlorophylls’ absorption spectra
The content of chlorophylls also can be reflected by absorption spectra of chlorophylls in the visible (360–720 nm) region. As shown in ), three absorption peaks of chlorophylls were found for all the samples, representing the light-harvesting capacity of PS II. The maximum peak of 663 nm (red light region) and 433 nm (blue light region) represented absorption spectra of chlorophyll-a, the maximum peak of 456 nm (blue light region) represented absorption spectra of chlorophyll-b. The change of chlorophylls’ absorption spectra was in accordance with the variation in chlorophyll contents. Both HHP and thermal treatments decreased absorption peak area of PS II chlorophyll-a and -b, the decrease induced by thermal treatment was more serious than that of HHP treatments, and the maximum absorption peaks of chlorophyll-a and -b were decreased to 0.092 (chlorophyll-a of red light region), 0163 (chlorophyll-a of blue light region), and 0.115 (chlorophyll-b of blue light region) in thermal-treated sample. However, the maximum absorption peaks of chlorophyll-a and -b were maintained at above 0.121 (chlorophyll-a of red light region), 0.223 (chlorophyll-a of blue light region), and 0.151 (chlorophyll-b of blue light region) in HHP-treated samples. The samples treated by higher pressure (450 and 500 MPa HHP) had higher absorption peak than those of lower pressure–treated samples. The phenomenon might be caused by the increase of free chlorophylls dissociating from chlorophyll–protein complexes PS II in a short time. Hence, HHP treatments better retained the light-harvesting capacity of PS II compared with thermal treatment. Meanwhile, chlorophyll-a was more unstable than chlorophyll-b in thermal-treated samples, as a blue shift of the maximum absorption peak at 662.5 nm (red light region) and 432.5 nm (blue light region) was found in thermal-treated samples. However, the maximum absorption peak of chlorophyll-a was stable in HHP-treated samples (observed at 663 and 443 nm, respectively). The blue shift of maximum absorption peak indicated that the structure of PS II light-harvesting antenna was destroyed after thermal treatment, and the negative effect further affected the stability of ETC and chlorophyll–protein complexes in the ETC.
Figure 3. Effects of HHP on chlorophyll absorption spectra of PS II extract solution. (A) Chlorophyll absorption spectra; (B) the fourth derivative of chlorophylls absorption spectra; (C) Gaussian deconvolution of chlorophyll absorption spectra. The dark and the green upper line of the figure indicate the real spectra and the add-up of the resolved Gaussian spectra, respectively. The green line below the spectra is the residue of the deconvolution; (D) Gaussian components of chlorophyll absorption spectra.
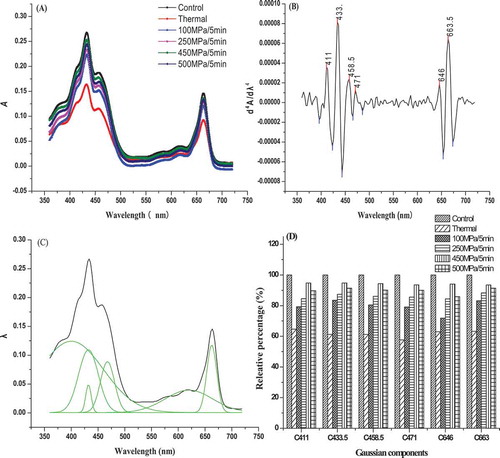
Changes of chlorophylls’ absorption spectra fourth derivative and Gaussian deconvolution after HHP treatments are shown in ) and (). Six kinds of effective Gaussian components were found in the visible region (360–720 nm), they were 411, 433, 458.5, 471, 646, and 663.5 nm, respectively. The component at 411 nm was from pheophytin-a-, 458.5 nm was from carotene, 433 and 663.5 nm were from chlorophyll-a of blue and red regions, 471 and 646 nm were from chlorophyll-b of blue and red regions.[Citation22] ) shows the effects of HHP on Gaussian components of chlorophylls’ absorption spectra. HHP and thermal treatments accelerated the degradation of PS II components compared with untreated sample. However, the degradation induced by HHP treatments was lower than thermal treatment, the relative percentage of PS II components almost maintained at above 80%, and the relative percentage decreased to 60% after thermal treatment. Hence, HHP treatment had a positive effect on maintaining light-harvesting capacity of chlorophylls by inhibiting the degradation of chlorophylls’ absorption spectra Gaussian components.
Chlorophylls’ emission fluorescence spectra
Chlorophyll-a and -b can be, respectively, excited at 436 and 475 nm, and it is reflected by change of chlorophylls’ absorption spectra (). Effects of HHP treatments on emission fluorescence spectra of chlorophylls are presented in ) and (). The maximum emission fluorescence peak of chlorophylls at about 680 nm was excited by PS II, which represented light-harvesting efficiency of PS II. Although HHP and thermal treatments decreased the maximum emission fluorescence peak of chlorophylls compared with untreated sample, HHP-treated samples had higher maximum emission fluorescence peak of chlorophylls than thermal treatments, especially for 100 MPa HHP-treated samples. The result demonstrated that HHP-treated samples still maintained better light-harvesting efficiency of chlorophylls than thermal-treated ones. Otherwise, the maximum emission fluorescence peak of chlorophyll-a and -b in HHP-treated samples was consistent with untreated sample, all of them were found at 683 nm and from balance fluorescence of CP43, CP47, and reaction centre chlorophylls of PS II. However, the blue shift of maximum emission fluorescence peak was found in thermal-treated sample, and the maximum emission fluorescence peaks of chlorophyll-a and -b were moved to 677 and 680 nm, respectively. It indicated that the structure of PS II was destroyed and light-harvesting efficiency of chlorophylls decreased after thermal treatment.
Figure 4. Effects of HHP on chlorophylls emission fluorescence spectra of PS II extract solution. (A) Chlorophyll a emission fluorescence spectra; (B) chlorophyll b emission fluorescence spectra; (C) the fourth derivative of chlorophyll a emission fluorescence spectra; (D) the fourth derivative of chlorophyll b emission fluorescence spectra; (E) Gaussian deconvolution of chlorophyll a emission fluorescence spectra. The dark and the green upper line of the figure indicate the real spectra and the add-up of the resolved Gaussian spectra, respectively. The green line below the spectra is the residue of the deconvolution; (F) Gaussian deconvolution of chlorophyll b emission fluorescence spectra. The dark and the green upper line of the figure indicate the real spectra and the add-up of the resolved Gaussian spectra, respectively. The green line below the spectra is the residue of the deconvolution; (G) Gaussian components of chlorophyll a emission fluorescence spectra; (H) Gaussian components of chlorophyll b emission fluorescence spectra.
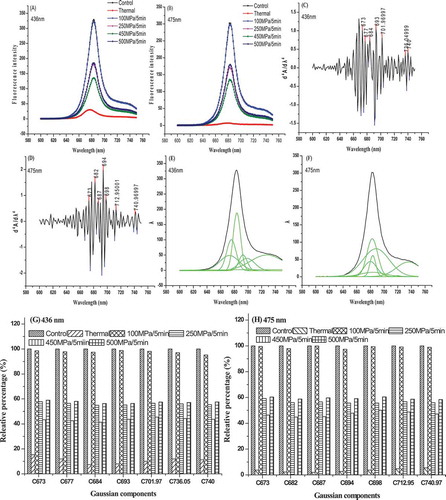
() represent the effects of HHP treatment on chlorophylls’ emission fluorescence spectra fourth derivative and Gaussian deconvolution of PS II. Seven kinds of effective chlorophyll-a and -b emission fluorescence spectra Gaussian components were found, they were 673, 677, 684, 693, 701.97, 736.05, 740 nm and 673, 682, 687, 694, 698, 712.95, 740.97 nm, respectively. Among the Gaussian components, 677 and 682 nm originated from LHC II; 684 and 687 nm originated from CP43; 693 and 694 nm originated from CP47; 701.97 and 798 nm originated from non-active aggregation state of LHC II; 736.05, 740, 712.95, and 740.97 nm originated from the residue of PS I; 673 nm was vibration band.[Citation23,Citation24] After confirming the above Gaussian components, the effects of HHP on Gaussian components of chlorophylls’ emission fluorescence spectra were further studied. As shown in ) and (), HHP and thermal treatments accelerated the degradation of above Gaussian components to some extent. However, HHP treatments showed a less degradation of Gaussian components than thermal treatment. For example, the relative percentage of chlorophylls Gaussian components of 100 MPa HHP-treated samples was maintained at about 100%. For thermal-treated sample, the relative percentage of chlorophylls Gaussian components significantly decreased to below 20%. HHP treatment better retained the stability of chlorophylls’ emission fluorescence spectra Gaussian components than thermal treatment, and it reflected the preservation of PS II light-harvesting efficiency.
Chlorophylls’ excitation fluorescence spectra
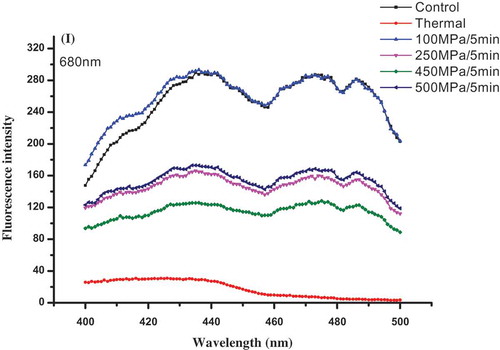
The effects of HHP on chlorophylls’ excitation fluorescence spectra of PS II are presented in . Two maximum excitation fluorescence peaks of chlorophylls were found at 436 and 478 nm when PS II was excited at 680 nm. These peaks at 436 and 478 nm represented the excitations of chlorophyll-a and -b, respectively, suggesting absorption spectra changes of chlorophylls (). Compared with untreated sample, the maximum excitation fluorescence peak of chlorophyll-a and -b decreased in HHP and thermal-treated samples. The decrease induced by thermal treatment was more serious than that of HHP treatments, the maximum excitation fluorescence of chlorophyll b even disappeared after thermal treatment. However, HHP treatments better retained excitation fluorescence capacity of chlorophyll-a and b, especially for that of lower-pressure (100 MPa HHP) treatment ones. Combined with the change of chlorophylls’ fluorescence emission peak, HHP treatment better maintained light-harvesting and light-exciting capacities. However, the capacities of light-harvesting and light-exciting notably decreased and even disappeared in thermal-treated sample. As the original component of ETC, the retention of PS II function played a beneficial effect on the retention of ETC, further retained the stability of chlorophyll–protein complexes in the ETC, and inhibited the degradation of chlorophylls in HHP-treated samples.
Figure 5. Effects of HHP on chlorophyll excitation fluorescence spectra of PS II extract solution at its maximum emission wavelength (λem = 680 nm).
Protein fluorescence spectra
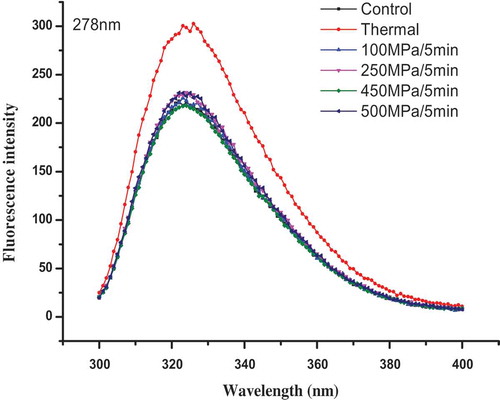
The excitation energy of tyrosine, phenylalanine, and tryptophan can be excited at 278 nm, representing the change of protein composition and content to some degree. The effects of HHP on protein fluorescence spectra of PS II are presented in . The maximum protein fluorescence emission peak of untreated and HHP-treated samples almost are the same, and they were found at about 324 nm. However, the maximum protein fluorescence emission peak was moved to 326 nm in thermal-treated sample, the maximum protein fluorescence emission peak increased in thermal-treated sample compared with those of untreated and HHP-treated samples. This phenomenon could be caused by the exposure of tryptophan under thermal treatment stress, it also could be explained by the accumulations of above CP43, LHC II, and CP24 protein peptide components after thermal treatment.
Figure 6. Effects of HHP on protein fluorescence spectra of PS II extract solution at its maximum excitation wavelength (λex = 278 nm).
Conclusion
Based on the results of this study, it was concluded that HHP treatments had less effects on components and function of PS II than thermal treatment. HHP-treated samples showed higher chlorophylls and soluble protein contents than those of thermal-treated ones, degradation of protein peptide components induced by HHP treatments was less than thermal treatment, representing the retention of PS II components. Meanwhile, the capacities of chlorophylls absorption spectra, emission, and excitation fluorescence spectra in HHP-treated samples were higher than thermal treatment, and it indicated light-harvesting and light-exciting efficiency of chlorophylls were better retained in HHP-treated samples than that of thermal treatment. Overall, as the original component of ETC, the preservation of PS II components and functions had a positive role for the retention of ETC, especially for low-pressure (100 MPa) treatment, and it was beneficial for retention of chlorophyll–protein complexes in the ETC and inhibited the degradation of chlorophylls in HHP processing of green vegetables.
Funding
This work was supported by National Natural Science Foundation of China (number 31571844) and National Natural Science Foundation of China (number 31601525).
Additional information
Funding
Related Research Data
References
- Steet, J.A.; Tong, C.H. Degradation Kinetics of Green Color and Chlorophylls in Peas by Colorimetry and HPLC. Journal of Food Science 1996, 61, 924–927.
- Friso, G.; Giacomelli, L.; Ytterberg, A.J.; Peltier, J.B.; Rudella, A.; Sun, Q.; Wilk, K.J. In-depth Analysis of the Thylakoid Membrane Proteome of Arabidopsis thaliana Chloroplasts: New Proteins, New Functions, and a Plastid Proteome Database. Plant Cell 2008, 16, 478–499.
- Bricker, T.M. The Structure and Function of CPa-1 and CPa-2 in Photosystem II. Photosynthesis Research 1990, 24, 1–13.
- Norton, T.; Sun, D.W. Recent Advances in the Use of High Pressure as an Effective Processing Technique in the Food Industry. Food and Bioprocess Technology 2008, 1, 2–34.
- Yao, J.; Zhou, B.; Wang, R.R.; Wang, T.T.; Hu, X.S.; Liao, X.J.; Zhang, Y. Inactivation of Staphylococcus aureus by High Hydrostatic Pressure In Saline Solution and Meat Slurry with Different Initial Inoculum Levels. Food and Bioproducts Processing 2015, 94, 592–600.
- Van Buggenhout, S.; Messagie, I.; Van Der Plancken, I.; Hendrickx, M. Influence of High-Pressure-Low-Temperature Treatments on Fruit and Vegetable Quality Related Enzymes. European Food Research and Technology 2006, 223, 475–485.
- Jacobo-Velázquez, D.A.; Hernández-Brenes, C. Biochemical Changes during the Storage of High Hydrostatic Pressure Processed Avocado Paste. Journal of Food Science 2010, 75, 264–270.
- Wang, R.R.; Wang, T.T.; Zheng, Q.; Hu, X.S.; Zhang, Y.; Liao, X.J. Effects of High Hydrostatic Pressure on Color of Spinach Puree and Related Properties. Journal of the Science of Food and Agriculture 2012, 92, 1417–1423.
- Wang, R.R.; Xu, Q.; Yao, J.; Zhang, Y.J.; Liao, X.J.; Hu, X.S.; Wu, J.H.; Zhang, Y. Post-effects of High Hydrostatic Pressure on Green Color Retention and Related Properties of Spinach Puree during Storage. Innovative Food Science and Emerging Technologies 2013, 17, 63–71.
- Schlüter, O.; Foerster, J.; Geyer, M.; Knorr, D.; Herppich, W.B. Characterization of High-Hydrostatic-Pressure Effects on Fresh Produce Using Chlorophyll Fluorescence Image Analysis. Food and Bioprocess Technology 2009, 2, 291–299.
- Eggleston, V.; Tanner, D.J. Are Carrots Under Pressure Still Alive? The Effect of High Pressure Processing on Respiration Rate of Carrots. Acta Horticulturae 2005, 687, 371–374.
- Kuwabara, T.; Murata, N. Inactivation of Photosynthetic Oxygen Evolution and Concomitant Release of Three Polypeptides in the Photosystem II Particles of Spinach Chloroplasts. Plant and Cell Physiology 1982, 23, 533–539.
- Rudra, S.G.; Sarkar, B.C.; Shivhare, U.S. Thermal Degradation Kinetics of Chlorophyll Inpureed Coriander Leaves. Food and Bioprocess Technology 2008, 1, 91–99.
- Teng, S.S.; Chen, B.H. Formation Of Pyrochlorophylls And Their Derivatives In Spinach Leaves During Heating. Food Chemistry 1999, 65, 367–373.
- Lowry, O.; Rosebrough, A.; Farr, A.; Randall, M.R. Protein Measurement with Folin Phenol Reagent. Journal of Biological Chemistry 1951, 193, 680–685.
- Shan, J.X.; Wang, J.H.; Ruan, X.; Li, L.B.; Gong, Y.D.; Zhao, N.M.; Kuang, T.Y. Changes of Absorption Spectra during Heat-Induced Denaturation of Photosystem Ⅱ Core Antenna Complexes CP43 and CP47: Revealing the Binding States of Chlorophyll Molecules in These Two Complexes. Biochimica et Biophysica Acta 2001, 1504, 396–408.
- Ferroni, L.; Baldisseroto, C.; Pantaleni, L.; Fasulo, M.P.; Fagioli, P.; Pancaldi, S. Degreening of the Unicellular Alga Euglena gracilis: Thylakoid Membrane Composition, Room Temperature Fluorescence Spectra and Chloroplast Morphology. Plant Biology 2009, 11, 631–641.
- Šiffel, P.; Braunová, Z. Release and Aggregation of the Light-Harvesting Complex in Intact Leaves Subjected to Strong CO2 Deficit. Photosynthesis Research 1999, 61, 217–226.
- Van Loey, A.; Ooms, V.; Weemaes, C.; Van den Broeck, I.; Ludikhuyze, L.; Indrawati, D.S.; Hendrickx, M. Thermal and Pressure-Temperature Degradation of Chlorophyll in Broccoli (Brassica oleracea L.italica) Juice: A Kinetic Study. Journal of Agricultural and Food Chemistry 1998, 46, 5289–5294.
- Herendeen, S.L.; Vanbogelen, R.A.; Neidhardt, F.C. Levels of Major Proteins of Escherichia coli during Growth at Different Temperatures. Journal of Bacteriology 1979, 139, 185–194.
- Tang, Y. L.; Wen, X.G.; Lu, Q.T.; Yang, Z.P.; Cheng, Z.K.; Lu, C.M. Heat Stress Induces an Aggregation of the Light-Harvesting Complex of Photosystem II in Spinach Plants. Plant Physiology 2007, 143, 629–638.
- Waloszek, A.; Tulej, M.; Wieckowski, S. Spectroscopic Analysis of Chlorophyll Bleaching in Heat-Pretreated Thylakoid Membranes Isolated from Cucumber Cotyledons. Photosynthetica 1992, 27, 109–118.
- Krause, G.H.; Weis, E. Chlorophyll Fluorescence and Photosynthesis: The Basics. Annual Review Plant Physiol. Plant Molecular Biology 1991, 42, 313–349.
- Govindjee. Sixty-Three Years Since Kautsky: Chlorophyll a Fluorescence. Australian Journal of Plant Physiology 1995, 22, 131–160.