
ABSTRACT
The influence of exopolysaccharide (EPS) on the structure of whey protein (WP) molecules at different pH and ionic strengths was investigated using fluorescence and circular dichroism (CD) spectroscopy. The WPs were separated using 0.2 mol/L glacial acetic acid, which has been proved to maintain to the maximum extent the native structure of WP molecules. The interaction between WP and EPS was significantly influenced by the ionic strength and pH. The presence of NaCl reduced the repulsion and aggregation of WP at pH 7.0. The addition of EPS increased the β-sheet structure of WP and this change tends to disappear at high ionic strength (0.3 mol/L). On the other hand, the repulsive interaction between WP and EPS at pH 7.0 and 6.0 has minimal influence on tryptophan (Trp) quenching and the exposure of hydrophobic residues to the hydrophilic environment. The formation of WP/EPS complexes at pH 5.0 led to the increased exposure of the Trp group to the hydrophilic phase. Both the electrostatic repulsion and attraction increased the secondary structure of WP at all pH values tested in this research.
Introduction
The interaction between protein and polysaccharide has attracted great attention from both the industry and academic fields as it plays a key role in the structure and texture of food products.[Citation1] Depending on the structure and charge properties of protein and polysaccharide molecules, their interactions could be segregative (repel each other), co-soluble (miscible), or associative (attract one another).[Citation2] Moreover, the interaction is very sensitive to pH and ionic strength.[Citation3] The screening effect of the high concentration of ions could reduce the interaction between the protein and polysaccharide molecules.[Citation4] With the drop in pH, a change in the interaction from electrostatic attractive to electrostatic repulsive has been observed for the chitosan/whey protein (WP) system.[Citation3,Citation4] However, the influence of the polysaccharide on the structure and functionality of proteins is still unclear.
Previous researchers have found that the interaction between WPs and polysaccharide depends on the type of polysaccharide. The addition of the right polysaccharide additives was reported to inhibit syneresis and to improve the texture of yogurt, which is a gelled dairy product produced by fermentation cultures.[Citation5] Exopolysaccharide (EPS) is produced by lactic acid bacteria during the fermentation of milk[Citation6] and it was reported to be present as filament strands, which interacts with the dairy proteins (caseins and WPs) and contributes to the formation of milk protein aggregates.[Citation7] The addition of EPS was able to improve the rheological properties and water retention of fermented milk and it functions better when EPS is produced in situ than when added as an ingredient.[Citation8,Citation9] However, the mechanism about the effect of EPS on the structure of protein networks is still under debate. Besides, in these papers, only the interaction between casein micelles and EPS was focused on, while the role of WPs and their interaction with EPS were usually overlooked, which has been proved to have significant influence on the formation of acid milk gels.[Citation7]
The structure of WP molecules has been demonstrated to be influenced greatly by the addition of EPS. The mixing of WP with EPS at neutral pH (pH 6.7) generated repulsion as they are both negatively charged. This electrostatic repulsion, together with steric repulsion, which arises from the flexible structure of WP molecules,[Citation10] prevents WP molecules from approaching each other. On the other hand, at pH lower than the isoelectric point of WP (5.3), where WP molecules are positively charged, they start to interact with negatively charged EPS, which results in the reorganization of the secondary structure of protein molecules. However, the structural changes of WP after the addition of EPS at different environmental conditions are still unclear. Further investigations about the interaction between WP and EPS and its influence on the structure formation of milk gels are essential.[Citation11,Citation12]
Guangxi province is famous for the production of buffalo milk, which has a much higher WP content compared to cow’s milk. Although many studies have been conducted on the purification of WP from cow’s milk, research on buffalo milk can be seldom found. The objective of this research was to develop an optimum method to separate WP from buffalo milk while maintaining its native structure to the maximum. Moreover, the separated WP with the highest percentage of native structure was used as the material and its interaction with EPS, which was produced by L. delbrueckii ssp. Bulgaricus and was negatively charged,[Citation7] was characterized using fluorescence spectroscopy and circular dichroism (CD) spectroscopy.
Materials and methods
Materials
Fresh buffalo milk (Bubalus bubalis) was purchased from a local dairy farm (Wutang, Nanning, China). EPS was prepared as described in our previous paper.[Citation7] Glacial acetic acid and 1-anilino-8-naphthalenesulfonate (ANS) were purchased from Sigma. All chemicals used in this research were of analytical grade.
Separation of WPs
Fresh buffalo milk was centrifuged at 8000 g (Avanti30 high speed centrifuge, Beckman, US) for 30 min at 4°C to remove the fat. The obtained skim milk was then adjusted to pH 4.5–4.7 using different concentrations of glacial acetic acid (0.2, 0.5, 1.0, and 2.0 mol/L). After stirring at 1000 s−1 at room temperature (22°C) for 10 min, the solutions were centrifuged at 8000 g for 30 min to remove all casein micelles. The aqueous phase was then transferred and concentrated using an ultrafiltration cartridge (10-kDa Millipore CDUF001LG, Fisher Scientific). The retentates were freeze dried and stored in a freezer until use.
To investigate the effect of the concentration of glacial acetic acid on the separation efficiency of WPs, the protein composition of the aqueous phase after removing caseins was analyzed using sodium dodecyl sulfate polyacrylamide gel electrophoresis (SDS-PAGE) under reducing conditions. The resolving and stacking gel contained 15 and 5% acrylamide, respectively. Gels were first run at 80 V for 30 min to allow the samples to enter the resolving gel and then run at 120 V for another 2–3 h to achieve the complete separation of proteins. The gels were stained with coomassie blue in a 5:1:4 mixture of methanol, acetic acid, and Milli-Q water for 30 min and distained in a 4.5:1:4.5 mixture of methanol, acetic acid, and Milli-Q water for 1 h twice. Distained gels were scanned in a Bio-Rad Gel DocEZ Imager (Bio-Rad power Pac HC, USA) equipped with Image Lab 3.0 software.
Determination of native WPs
The percentage of the native WPs was defined as activity, which was calculated using the following equation:
where W is the percentage of the undenatured WPs; MNPN is the nitrogen content of nonprotein nitrogen; M1 is the nitrogen content of WPs; and MT is the total nitrogen content. The total nitrogen was defined as all the nitrogen present in the separated whey after removing all the caseins. The nonprotein nitrogen was defined as the nitrogen in the aqueous solution after precipitation of all proteins using 12% trichloroacetic acid (TCA). The denatured WP was removed by saturated NaCl solution as described previously.[Citation13] The nitrogen remaining in the aqueous solution was defined as M1. The Kjeldahl method was used to determine the nitrogen contents of total, native, and nonprotein fractions.
Preparation of WP/EPS mixed systems
Both WP (200 or 500 μg/mL) and EPS (1000 μg/mL) were prepared by dissolving in phosphate buffer at 0.01 mol/L ionic strength. EPS dispersions were prepared by stirring at 1000 s−1 at 80°C for at least 1 h and then left overnight at 4–5°C to ensure complete hydration. To investigate the effect of ionic strength on the interaction between WP and EPS, the phosphate buffer (pH 7.0) with different NaCl (0, 0.15, and 0.3 mol/L) was used to dissolve the EPS and WP. On the other hand, phosphate buffer with different pH (5.0, 6.0, and 7.0) was used to dissolve the WP and EPS to investigate the influence of pH on the interaction between WP and EPS.
Intrinsic fluorescence spectroscopy
Fluorescence measurements were performed using an RF-5301PC luminescence spectrometer (Shimadzu, Japan) with a quartz cell of 10 mm path length. The excitation wavelength was 292 nm and emission was collected between 300 and 420 nm at the scan speed of 200 nm/min. The excitation and emission slits were both 10 nm.[Citation14,Citation15] For the intrinsic fluorescence measurements, the WP concentration was 200 μg/mL and the EPS concentration was 1000 μg/mL. Measurements were performed at 25°C.
ANS binding measurements
To investigate the binding of hydrophobic dye ANS, the WP and EPS solutions were mixed together (5 mL) to reach a final WP concentration of 200 μg/mL and EPS concentration of 1000 μg/mL, followed by the addition of 20 μL 8 mmol/L of ANS and incubation for 15 min at 25°C in the dark. The fluorescence of ANS was excited at 390 nm and the emission was collected between 400 and 650 nm. Measurements were performed at 25°C.
CD measurements
CD spectra were obtained using a MOS-450/AF-spectropolarimeter (Bio-logic science instruments, France) with a thermostated cell holder. A quartz cell with a 1-mm light path length and a 10-mm light path length was used for measurements in the far-UV region (190–250 nm).
The scan speed was set at 200 nm/min and the response time was set at 8 s. The WP concentration was set at 500 μg/mL and the EPS concentration was set at 1000 μg/mL. Measurements were made at 25°C.
Statistics
At least three replicates were performed for each experiment and Tukey honest significant difference (HSD) was carried out on the experimental measurements with 95% confidence level using Minitab statistical package release 15 (Minitab Inc., State College, PA, USA).
Results and discussion
Effect of the initial concentration of glacial acetic acid on the separation of WP
Isoelectric precipitation of caseins is the most widely used method to separate the WPs in milk. This research investigated the influence of concentration of acetic acid on the separation effect of WPs, as shown in . Clearly, the caseins were removed completely from the whey. No influence of the acetic concentration on the separated amount of α-la and β-lg was detected, as the band intensities were similar among all concentrations (). On the other hand, the concentration of acetic acid showed significant influence on the amount of lactoferrin (LF) and bovine serum albumin (BSA) present in the whey phase. The band intensities decreased with increasing concentration of acetic acid, indicating more LF and BSA were precipitated with the increasing concentration of acid. At the highest acid concentration (2 mol/L), almost all the LF was removed and only a small amount of BSA remained. The results confirmed that the isoelectric precipitation method is an easy and efficient way to separate WPs, which was barely influenced by the concentration of acid.
Figure 1. SDS-PAGE electrophoresis (a) and activity (b) of precipitated whey proteins using different concentrations of glacial acetic acid: 2.0% (lane 2), 1.5% (lane 3), 1.0% (lane 4), 0.5% (lane 5), and 0.25% (lane 6).
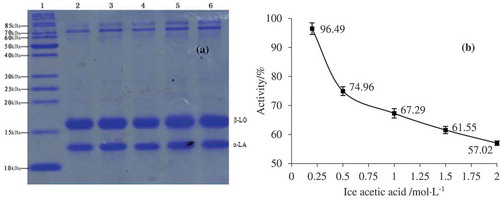
To further investigate the influence of acid concentration on the separation of WPs, the percentage of WPs that maintained their native state to the total WPs was also determined, which is summarized in . At the lowest concentration of acetic acid (0.2 mol/L), the activity value was 96.49% and this value reduced very rapidly to 74.96% when 0.5 mol/L acid was used. Further increase of the acid concentration led to further decrease of WP activity, and the lowest value of 57.02% was observed at 2 mol/L acetic acid. The results illustrated that the structure of WPs can be maintained at a low concentration of acid. To maintain the activity of separated WPs, the concentration of acetic acid was chosen at 0.2 mol/L.
Effect of ionic strength on the interaction between EPS and WP
Intrinsic fluorescence intensities in proteins are from the aromatic amino acid side chains, mainly due to the tyrosine and tryptophan (Trp) residues. At an excitation wavelength higher than 290 nm, it is possible to excite Trp alone.[Citation16] In this research, excitation was performed at 292 nm and the influence of EPS and NaCl concentration on the intrinsic fluorescence intensity of WPs was measured, as shown in . The maximum intensity of emission for WP solutions was found to be around 333 nm, which is in accordance with the previous publications.[Citation15,Citation16] The emission is from the Trp in a nonpolar environment.
Figure 2. (a), (b), and (c) are the intrinsic tryptophan fluorescence spectra of WP-EPS at various ionic strengths of 0.00, 0.15, and 0.30 mol/L, respectively.
It needs to be noted that the pH used in this part was 7.0, at which λmax was found to be independent of sodium chloride concentration.[Citation16] No significant changes in the fluorescence at different ionic strengths were also found in our experiment (). In addition, no influence of the EPS on the fluorescence intensity of WPs was observed in the absence of NaCl, as indicated in . At pH 7.0, where both EPS and WP molecules were negatively charged, they repelled each other.[Citation2] This interaction has no effect on the Trp quenching. On the other hand, the screening of the negative charges of EPS and WP molecules in the presence of NaCl of EPS significantly influenced Trp quenching. The fluorescence intensity decreased by 15.9% and 17.4% when 0.15 and 0.3 mol/L NaCl, respectively, was added ( and ), which suggests that more Trp was exposed to the hydrophilic environment. It was shown in the previous literature that β-lg presents in the form of dimers at pH 7.0,[Citation17] and the decreased fluorescence intensities of WPs might be a result of dimer dissociation. Similar results have been found when the pH was lower than 2.0 or higher than 9.0.[Citation16]
Figure 3. (a), (b), and (c) are the ANS fluorescence emission spectra of WP-EPS at various ionic strengths of 0.00, 0.15, and 0.30 mol/L, respectively.
To further characterize the influence of NaCl on the interaction behaviour between EPS and WP molecules, ANS fluorescence was adopted to determine the presence of solvent-exposed hydrophobic groups, as illustrated in . As expected, the addition of EPS decreased the fluorescence intensity in the absence of NaCl (). This is due to the repulsion between the negatively charged WP and EPS molecules, which promoted the aggregation of WP molecules. Similar change was found when 0.15 mol/L was added, where the fluorescence intensity decreased by 5.7%, as shown in . In contrast, the fluorescence intensity increased by 2.8% after the addition of EPS in the presence of 0.3 mol/L NaCl (). This indicates that more hydrophobic residues were exposed to the hydrophilic environment.
Figure 4. (a), (b), and (c) are the CD spectra of WP-EPS at various ionic strengths of 0.00, 0.15, and 0.30 mol/L, respectively.
Previous researchers reported that the interaction between proteins and polysaccharide was mainly by electrostatic interactions, and also by hydrogen bond, Van de wall’s force, and hydrophobic interaction,[Citation18,Citation19] which was further confirmed by our results. The interaction between WP and EPS was dominated by the electrostatic repulsion at pH 7.0. This repulsion was decreased by the addition of NaCl, which was able to screen the negative charge on the surface of WP and EPS molecules. Aggregation of WP molecules was inhibited when 0.3 mol/L NaCl was added. This is in agreement with the results from intrinsic fluorescence measurements (). The slight increase of fluorescence intensity due to the addition of EPS may suggest that the combination of WP with EPS might happen in the presence of high ionic strength.
In this research, CD spectroscopy was used to characterize the changes of the secondary structure of WPs as a function of EPS in the presence of different amounts of NaCl. Analysis was conducted in the “far-UV” spectral region (190–250 nm), which largely reflects the secondary structure of the protein derived from the peptide bond absorption and the inherent chirality of the polypeptide chain.[Citation20,Citation21] The results are shown in . The negative extreme of the spectra was found around 216 nm and the positive extreme was found around 195 nm, which is in agreement with previous publications.[Citation22,Citation23] Both of these are ascribed to the high content of the β-sheet structure, which is the major secondary structural feature of WPs.[Citation24]
It was noted that the trough at 216 nm significantly decreased with the increase in the NaCl concentration (), probably due to the decreased electrostatic repulsions between the WP molecules. For the WP/EPS mixtures in the absence of NaCl, the addition of EPS significantly increased the peak value at 216 nm (), indicating the increased β-sheet structure. The secondary structure of the WP molecules was prominently altered by the repulsion between the EPS and WP. This change in the protein structure was further influenced by the addition of NaCl. Only a slight increase of the peak was detected when 0.15 mol/L NaCl was added, as shown in . In the case of the highest NaCl concentration (0.3 mol/L), no change in the secondary structure of WPs could be detected after the addition of EPS (). All these changes are due to the decreased electrostatic repulsions between WP and EPS, and a change from repulsive to attractive interaction might happen at high ionic strength.
Figure 5. (a), (b), and (c) are the intrinsic tryptophan fluorescence spectra of WP-EPS at pH 7.0, 6.0, and 5.0, respectively.
Along with the results from fluorescence and CD spectroscopy, it can be concluded that repulsion was the main factor leading to the increased secondary structure and aggregation behavior of the WP molecules. The addition of NaCl significantly reduced the repulsions between WP and EPS, which further decreased the aggregation of WP and increased the peptide residues exposed to the hydrophilic environment. The WP molecules were able to combine with the EPS molecules instead of repelling each other in the presence of a high concentration of NaCl, probably through hydrogen bond, van der Walls force, and hydrophobic interactions.[Citation25]
Interaction between WP and EPS at different pH values
It is known that the structures of major WPs, α-la and β-lg, are very sensitive to pH.[Citation26–Citation27] Slight increase of the intrinsic fluorescence intensity with decreasing pH was observed from pH 7.0 to 5.0, as shown in . At pH 7.0, no difference in the fluorescence intensity could be detected between samples with or without EPS (). The intensity at pH 6.0 decreased slightly by 2.3% after the addition of EPS due to the decreased electrostatic repulsion (). On further decreasing the pH to 5.0, which is below the isoelectric point of WPs (pH 5.3), the fluorescence intensity decreased significantly by 10.3% in the presence of EPS. In this case, the WP was able to interact with the EPS molecules to form WP/EPS complexes, which inhibit the aggregation of the WP molecules and expose more Trp to the water phase. The results demonstrated that the electrostatic attraction has more effect on the quenching of Trp than the electrostatic repulsion.
summarizes the ANS fluorescence emission spectra of WP-EPS at different pH values. The WPs have the smallest fluorescence intensity at pH 6.0 (). On the other hand, a much higher intensity was observed at pH 5.0 (), which is very close to the isoelectric point of WPs. The structure of WPs was denatured and more hydrophobic residues were exposed to the hydrophilic phase. The addition of EPS only has a very small influence on the hydrophobic groups exposed to the hydrophilic phase at all pH values. The ANS fluorescence intensities decreased by 5.2%, 2.6%, and 0.8% at pH 7.0, 6.0, and 5.0, respectively. The decreased intensities at pH 7.0 and 6.0 were from the depletion interactions between WP and EPS. On the other hand, the formation of WP/EPS complexes barely affected the fluorescence intensity of WPs at pH 5.0.
Figure 6. (a), (b), and (c) are the ANS fluorescence emission spectra of WP-EPS at pH 7.0, 6.0, and 5.0, respectively.
Previous researchers reported that the interaction between EPS and milk proteins was influenced by the molecular weight, chain stiffness, and charge density of EPS.[Citation5] Moreover, the interaction between EPS and WPs initiated at higher pH (6.1) compared with caseins (5.4).[Citation5] The decrease in fluorescence intensity at pH 6.0 indicated that electrostatic repulsion plays the dominant role, although weak attraction occurs at pH 6.0. The attractive interaction is the main force between the WP and EPS molecules, which has no influence on the exposure of hydrophobic residues. This further confirmed the role of electrostatic force on the interaction between WP and EPS molecules. Understanding these changes in the interaction between EPS and WP could help us better understand and control the acid gelation process to obtain the desired acid milk products.
To better compare the interaction between EPS and WP at different pH values, CD spectroscopy was used to investigate the changes of the secondary structure. As described in , the addition of EPS increased [θ] 216 (deg.cm2.dmol−1) values significantly at pH 7.0. This increased β-sheet structure after the addition of EPS is due to the electrostatic repulsion between the EPS and WP molecules. At pH 6.0, the addition of EPS also increased the β-sheet structure, but to a much smaller extent (). This phenomenon can be caused by two reasons: the decreased electrostatic repulsion and the presence of weak attractive interactions. On the other hand, the formation of the WP/EPS complex at pH 5.0 also increased the secondary structure of WPs.
Figure 7. (a), (b), and (c) are the CD spectra of WP-EPS at pH 7.0, 6.0, and 5.0, respectively.
The results from fluorescence and CD spectroscopy demonstrated that the addition of EPS has minimal effect on the Trp quenching and exposure of hydrophobic residues at pH 7.0 and 6.0, while it increased the β-sheet structure. The presence of weak attractive interaction started from pH 6.0. In contrast, the electrostatic attractions at pH 5.0 decreased the quenching of Trp but had minimal effect on the exposure of hydrophobic groups to the hydrophilic environment.
Conclusions
This study researched the interaction between EPS and WP molecules as functions of pH and ionic strength. The interaction between WP and EPS was dominated by electrostatic interaction. The depletion interaction can be decreased by the screening effect of NaCl, which was able to inhibit the aggregation of WP. Furthermore, the presence of high ionic strength could initiate the attractive interactions between WP and EPS. On the other hand, decreasing the pH resulted in great changes in the structure of WPs, especially for the hydrophobic residues exposed to the hydrophilic phase. The repulsive interaction between WP and EPS at pH 7.0 and 6.0 had little influence on Trp quenching, while the formation of WP/EPS complexes exposed more Trp to the hydrophilic phase. The addition of EPS increased the secondary structure of WP at all pH values and the attractive interaction was confirmed to start from pH 6.0. WPs play an important role in the structure of fermented dairy products. They present in the form of aggregate before acidification and could form complexes with EPS. The results from this research can help us better understand the interactions between EPS and WP and its contribution to the structure development during the fermentation process of yogurt product.
Funding
This work was supported by the grant of state key laboratory of dairy biotechnology, P. R. China (No. SKLDB2013-07) and Guangxi University Science Foundation for Doctor (XBZ160258).
Additional information
Funding
References
- Corredig, M.; Sharafbafi, N.; Kristo, E. Polysaccharide-protein Interactions in Dairy Matrices, Control and Design of Structures. Food Hydrocolloids. 2011, 25,1833–1841.
- De Kruif, C.G.; Tuinier, R. Polysaccharide Protein Interactions. Food Hydrocolloids 2001, 15, 555–563.
- Zhao, Z.; Xiao Q. Effect of Chitosan on the Heat Stability of Whey Protein Solution as a Function of pH. Journal of the Science of Food and Agriculture 2017, 97, 1576–1581.
- Mounsey, J.; O’Kennedy, B.; Fenelon, M.A.; Brodkorb, A. The Effect of Heating on β-Lactoglobulin–chitosan Mixtures as Influenced by pH and Ionic Strength. Food Hydrocolloids 2008, 22, 65–73.
- Girard, M.; Schaffer-Lequart, C. Attractive Interactions between Selected Anionic Exopolysaccharides and Milk Proteins. Food Hydrocolloids 2008, 22,1425–1434.
- Folkenberg, D.M.; Dejmek, P.; Skriver, A.; Ipsen R. Interactions between EPS-producing Streptococcus Thermophilus Strains in Mixed Yoghurt Cultures. Journal of Dairy Research 2006, 73, 385–393.
- Ayala-Hernandez, I.; Goff, H.D.; Corredig, M. Interactions between Milk Proteins and Exopolysaccharides Produced by Lactococcus Lactis Observed by Scanning Electron Microscopy. Journal of Dairy Science 2008, 91, 2583–90.
- Kristo, E.; Miao, Z.; Corredig, M. The Role of Exopolysaccharide Produced by Lactococcus Lactis Subsp. Cremoris in Structure Formation and Recovery of Acid Milk Gels. International Dairy Journal 2011, 21, 656–662.
- Yang, T.; Wu, K.; Wang, F.; Liang, X.; Liu, Q.; Li, G.; Li, Q. Effect of Exopolysaccharides from Lactic Acid Bacteria on the Texture and Microstructure of Buffalo Yoghurt. International Dairy Journal 2014, 34, 252–256.
- Tuinier, R.; Dhont, J.K.G.; & De Kruif, C.G. Depletion-induced Phase Separation of Aggregated Whey Protein Colloids by an Exocellular Polysaccharide. Langmuir 2000, 16, 1497–1507.
- Zisu, B.; Shah, N.P. Effects of pH, Temperature, Supplementation with Whey Protein Concentrate, and Adjunct Cultures on the Production of Exopolysaccharides by Streptococcus Thermophilus 1275. Journal of Dairy Science 2003, 86, 3405–3415.
- Amatayakul, T.; Halmos, A.L.; Sherkat, F.; Shah, N.P. Physical Characteristics of Yoghurts Made Using Exopolysaccharide-producing Starter Cultures and Varying Casein to Whey Protein Ratios. International Dairy Journal 2006, 16, 40–51.
- McSweeney, P.; Fox, P.F. Advanced Dairy Chemistry Proteins Part A, 3rd ed.; Springer: New York, 2003.
- Jr, F.Y., Zhang, M.; Chen, J.; Liang, Y. Structural Changes of α -Lactalbumin Induced by Low pH and Oleic Acid. Biochimica et Biophysica Acta 2006, 1764, 1389–1396.
- Râpeanu, G.; Bahrim, G.; Aprodu, I. pH and Heat-induced Structural Changes of Bovine Apo-a-lactalbumin. Food Chemistry 2012, 131, 956–963.
- Renard, D.; Lefebvre, J. Effects of pH and Salt Environment on the Association of i-Lactoglobulin Revealed by Intrinsic Uorescence Studies. International Journal of Biological Macromolecules 1998, 22, 41–49.
- Mills, O.E.; Creamer, L.K. A Conformational Change in Bovine Beta-lactoglobulin at Low pH. Biochimica et Biophysica Acta 1975, 379, 618–626.
- Zinoviadou, K.G.; Scholten, E.; Moschakis, T.; Biliaderis, C.G. Properties of Emulsions Stabilised by Sodium Caseinate-chitosan Complexes. Internaional Dairy Jounal 2012, 26, 94–101.
- Stone, A.K.; Teymurova, A.; Dang, Q.; Abeysekara, S.; Karalash, A.; Nickerson, M.T. Formation and Functional Attributes of Electrostatic Complexes Involving Napin Protein Isolate and Anionic Polysaccharides. European Food Research and Technology 2014, 238, 773–780.
- Woody, R. Appliction of the Bergson Model to the Optical Properties of Chiral Disulphide. Tetrahedron 1973, 29, 1273–1283.
- Manderson, G.A.; Creamer, L.K.; Hardman, M.J. Effect of Heat Treatment on the Circular Dichroism Spectra of Bovine Beta-lactoglobulin A, B, and C. Journal of Agriculture and Food Chemistry 1999, 47, 4557–67.
- De Jongh, H.H.J.; Gröneveld, T.; de Groot, J. Mild Isolation Procedure Discloses New Protein Structural Properties of β-Lactoglobulin. Journal of Dairy Science 2001, 84, 562–571.
- Chandrapala, J.; Zisu, B.; Palmer, M.; Kentish, S.; Ashokkumar, M. Effects of ultrasound on the Thermal and Structural Characteristics of Proteins in Reconstituted Whey Protein Concentrate. Ultrasonics Sonochemistry 2011, 18, 951–957.
- Matsuura, J.E.; Manning, M.C. Heat-Induced Gel Formation of Beta-lactoglobulin: A Study on the Secondary and Tertiary Structure as Followed by Circular Dichroism Spectroscopy. Journal of Agriculture and Food Chemistry 1994, 42, 1650–1656.
- Shimizu, M.; Saito, M.; Yamauchi, K. Emulsifying and Structural Properties of Beta-Lactoglobulin at Different pHs. Agricultural and Biological Chemistry 1985, 49, 189–194.
- Permyakov, E.; Berliner, L.J. α-Lactalbumin: Structure and Function. FEBS Letters 2000, 473, 269–274.
- Uhrínová, S.; Smith, M.H.; Jameson, G.B.; Uhrín, D.; Sawyer, L.; Barlow, P.N. Structural Changes Accompanying pH-induced Dissociation of the Beta-Lactoglobulin Dimer. Biochemistry 2000, 39, 3565–3574.