
ABSTRACT
The objective of this research was to create supervised classification models of pear ripeness with the use of hyperspectral imaging system in the visible and short near infrared (425–1000 nm) regions. Spectra and images of 450 pear samples were studied, which were selected from three ripeness stages (unripe, ripe, and overripe). Three classification algorithms—partial least square-discriminant analysis (PLS-DA), soft independent modeling of class analogy (SIMCA), and linear discriminant analysis (LDA) were compared. Successive projection algorithm (SPA) was used to select optimal wavelengths, and gray level co-occurrence matrix (GLCM) was applied to extract four textural feature variables. The overall results revealed that the best model was PLS-DA, of which the correct classification rate (CCR) was 87.86% with the input consisted of the spectra and texture feature of images. Hence, combining spectral with texture analyses were effective for improving pear ripeness prediction. In addition, the same dataset for ripeness classification got a good performance of firmness prediction by PLS in the regression analysis. In addition, using the same input of ripeness classification to make a study on firmness prediction by partial least square analysis revealed a potential for further research, with correlate coefficient of prediction set rpre of 0.84 and root mean square error of prediction of 0.78 N.
Introduction
Pear is an economically important fruit that is consumed as fresh fruit as well as used for garnishing cakes and pastries, flavored for juices and milk products, and processed into jams and other products.[Citation1] Consequently, together with the recent concern for food quality and safety, automatic technologies for judging the fresh quality of pear are being sought (FDA, 2014). At present, fruits are sorted manually or automatically on the basis of their external quality attributes. However, internal quality features such as soluble solids content (SSC), pH, and particularly firmness are very important in the quality evaluation.[Citation1–Citation4] In addition, as the pear is a non-climacteric fruit, optimum ripening stage is one of the most fundamental aspects that influence on the future of the eating quality of fruit as well as fruit postharvest storage. The method adopted to distinguish the ripening stage of pear is still relying on the people’s experience and intuitionistic judgment. This approach is inefficient and subjective, and, thus, is unable to cope with large-scale production and trading, as well as modern fruits processing. Therefore, it is essential to develop a fast, nondestructive, chemical-free, and efficient technique that can classify the pear fruits based on these physiological properties to assure more fruit quality, ripeness classification, and increasing of the consumer acceptance and satisfaction. Nondestructive testing has been successfully implemented to evaluate the internal quality parameters for many fruits and vegetables.[Citation5–Citation10]
As many researchers have reported, optical sensing and imaging technologies such as machine vision and spectroscopy are considered as an effective tool for nondestructive inspection and postharvest fruit quality, safety detection, sorting, and process automation.[Citation11–Citation15] Machine vision has success in categorizing fruits with respect to size, color, and other appearance indices.[Citation16,Citation17] However, its capacity for determining internal quality of fruits is limited.[Citation12,Citation13] A review of applications of machine vision in food industry has been reported by Cubero et al.[Citation11] Application of near infrared (NIR) spectroscopy as one of the most advanced and efficient technique has been widely studied for food quality and food safety analysis during the past two decades.[Citation1,Citation2,Citation18–Citation24] However, as spectroscopy generally measures an aggregate amount of light reflected or transmitted from a specific area of a sample (point measurement), it does not contain spatial information about the product.
In recent years, hyperspectral imaging (HSI) has emerged as a nondestructive, noncontact, and nonconventional technique that integrates two mature technologies of conventional imaging and spectroscopy to provide both spatial and spectral information simultaneously.[Citation10,Citation25] The hyperspectral images form a three-dimensional hyperspectral cube known as “hypercube,” which is composed of two-dimensional spatial image and one-dimensional spectrum. Therefore, HSI is capable of representing both physical and chemical attributes by analyzing the image features and performing predicting model using the spectral information, respectively.[Citation11–Citation15,Citation26] Therefore, there has been a growing interest to work on HSI systems for nondestructive analysis in agricultural production.[Citation5–Citation10,Citation25,Citation27,Citation28] The technique was also applied to detect the ripening process of fruits such as strawberry, peach, banana, and tomato[Citation29–Citation32], which showed a potential use of hyperspectral imaging for the fruits ripeness/quality assessment. However, major bottlenecks such as the long acquisition time and high cost have limited the use of this technology in an online system directly.[Citation13,Citation33,Citation34] One way to solve this problem is to implement the HSI technique along with multivariate statistical methods to decrease the data size by identifying a few key wavelengths for real-time multispectral imaging implementation.[Citation34,Citation35] This variable (wavelength) reduction approach diminishes the complexity of the data and improves the model’s predictive capability.
Literature review showed that despite the above research attempts, the majority of studies on using HSI for assessment of food quality were performed only using 1-D spectral data. Combinations of 1-D spectral profile and 2-D image features are more effective than when they are used independently for evaluating food quality.[Citation15] Among image features, texture analysis particularly gray level co-occurrence matrix (GLCM) plays an important role in many applications ranging from food industry to medical imaging.[Citation36] Some research works have been conducted to food quality using GLCM.[Citation28,Citation29,Citation36,Citation37] On the other hand, to the best of our knowledge, literature review showed that no study has been reported on using hyperspectral imaging for determining the ripeness of pear. Therefore, in this study, we mainly use successive projection algorithm (SPA) and make a fusion of the spectral and textural features to acquire the different input of classifiers. We investigated the ripeness stage of pear by combining the feature spectra and images based on hyperspectral imaging technique in the visible and short near infrared (SNIR) spectral region between 425 and 1000 nm. Therefore, the specific objectives of this study were the following: (1) to test whether the hyperspectral imaging system can get a good evaluation of pear ripeness; (2) to compare three types of classification algorithms: partial least square-discriminant analysis (PLS-DA), soft independent modeling of class analogy (SIMCA), and linear discriminant analysis (LDA); (3) to optimize the calibration models by wavelength feature and texture feature using GLCM parameters; and (4) to analyze the relationship between firmness and ripeness.
Materials and methods
Pear samples
In this study, a total of 450 pear fruits of the same size and without physical defects at 90, 100, and 110 days after full bloom (DAFB), grown in 2015 in a commercial orchard in far western China, Xinjiang region, China were randomly collected. The fruits were classified into groups of three different ripeness levels, based on the subjective evaluation of the skin texture of the fruit (a sample of 150 fruits at each stage of DAFB). (i) Unripe: hard texture, (ii) Ripe: firm and soft texture, and (iii) Over-ripe: over soft texture.
Samples were classified into three groups: unripe, ripe, and over-ripe according to the days after full bloom. Consequently, samples at 90 DAFB were considered as the unripe group. Similarly, fruits collected at 100 and 110 DAFB were considered as ripe and over-ripe group, respectively. After the arrival in the laboratory, all samples were individually washed, numbered, and then stored at 20°C and 60% relative humidity.[Citation4] The tested fruits in each maturity stage (150 samples) were randomly classified into two subgroups. The first subgroup of 120 samples was used as a calibration set for developing partial least square model. The remaining subgroup of 30 fruits was used as prediction set to verify the prediction power of the calibration models. Their physical parameters were measured before hyperspectral image acquisition. Mass was determined by an precision electronic balance with an accuracy of 0.01 g (YP2001N, Shanghai Precision & Scientific Instrument Co., Ltd., Shanghai, China). The height of the fruit was obtained with digital caliper (Shenhan measurements tools Co., Ltd., Shanghai, China). After acquisition of hyperspectral images, each fruit sample was tested for its firmness and SSC. The firmness was first measured using an with a 3.5 mm Magness-Taylor (MT) probe, which was attached to a fruit sclerometer (Model: gY-1, Hangzhou Huier Instrument, Co. Ltd., Hangzhou, China) with accuracy of ±0.1 N. Peak force required to puncture fruit skin was taken as fruit firmness. Duplicate puncture tests were performed on opposite sides of equatorial region of each fruit and average value was reported. For determination of SSC, the fruit samples were juiced with a commercial juice extractor (Model: HL-56, Ningbo Borine Electrical Appliance Co., Ltd., Shanghai, China). The juice was filtered and centrifuged afterwards. The SSC of juice was measured thrice using a digital refractometer (Model: PR-101a, Atago Co., Ltd., Tokyo, Japan), and the average values were noted. The juice’s soluble solid content was expressed in values of %. These methods are studied and used by many researchers.[Citation1,Citation2,Citation22] Mass/height/firmness/SSC was used as dependent response variables and correspondingly ripeness as factor. The one-way analyses of variance (ANOVA) were calculated by IBM SPSS (Version 16.0, Inc., Chicago, IL, USA).
Hyperspectral imaging system, image acquisition and processing
The hyperspectral imaging system () employed in this research is the same as reported in the earlier studies[Citation4,Citation34] and to enhance readability and completeness of this study it is described briefly here. It is a pushbroom hyperspectral imaging system covering the spectral range of 325–1100 nm with a spectral resolution of approximately 2.8 nm. The system was mainly composed of five components: a thermo-electrically cooled electron multiplying charge-coupled device (EMCCD) camera (Andor Luca EMCCD DL-604M, Andor Technology plc., N. Ireland), a imaging spectrograph (ImSpector VNIR-V10E-EMCCD, Spectral Imaging Ltd, Oulu, Finland) coupled with a standard 23 mm C-mount zoom lens (OLE23-f/2.4, Spectral Imaging Ltd, Oulu, Finland), two 500 Watt (W) quartz light area source (Antefore International Co., Ltd., Taiwan, China) adjusted at an angle of 45° providing a uniform lighting conditions for a sample in the field of view (FOV) of the optics, a programmable, motorized positioning sample table (EZHR17EN, AllMotion, Inc., USA), and a computer (Dell OPTIPLEX 990, Intel (R) Core (TM) i5-2400 CPU @3.10GHZ). In this study, the distance between samples and the lens was 400 mm. The camera was set to run continues node with 22 ms exposure time. As the images outside the 425–1000 nm were noisy with low signal to noise ratio, only the images of the wavelength range between 425 and 1000 nm were used for data analysis and algorithm development in this investigation. To avoid stray light that might affect the reflectance from samples, all the components (except computer) were fixed inside a dark chamber.
Figure 1. Schematic of the hyperspectral imaging system (a) and its picture (b).
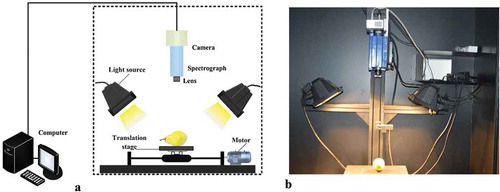
Before image acquisition, the pear samples were manually oriented on the displacement platform toward the camera. During capturing an image, sample was transported to the field of view of the imaging system with a black displacement platform running at the speed of 0.8 mm s−1. The camera–spectrograph unit used to scan the pear samples line by line as the transportation plate with a stepper motor moved the samples through the field of view of the optical system. Each collected spectral image was stored as a three-dimensional data cube (x, y, λ). The spatial components (x, y) included 700 × 1004 pixels, and the spectral component (λ) included 747 bands with 0.77 nm interval within 425–1000 nm. The spectral images were acquired by Spectral Image Software (Isuzu Optics Crop., Taiwan). All spectral images acquired were processed and analyzed using the Environment for Visualizing Images software program (ENVI 4.6, Research System Inc., Boulder, CO., USA) and Matlab 2013a (The MathWorks Inc., Natick, USA) with the image processing toolbox.
The hyperspectral images were corrected with a white and a dark reference. A Teflon white broad with 99% reflection efficiency was used to obtain a typically white reference image. The position of white broad was adjusted such that its height was the same as the sample on the positioning plate. Since the signal of the camera chip is not zero when no light hits the detectors, a dark current image was also acquired to remove the dark current effect of the CCD detectors. The corrected image (R) is estimated as follows[Citation13–Citation15]:
where R0 is the recorded hyperspectral image, D the dark image (with 0% reflectance) recorded by turning off the lighting source with the lens of the camera completely closed, and W is the white reference image. The corrected images will be the basis for the subsequent image analysis to extract information about the spectral properties of each fruit.
Data analysis
Extraction of spectral data: After the preprocessing, segmentation was implemented to segregate each pear from the background for each hypercube and calculate their mean spectra. The first step consisted of building a binary mask to recognize each pear from the background using the threshold segmentation in the hypercube. This was accomplished on the spectral image at 585 nm, which gave the maximum contrast between the pears (brighter) and the background. Subsequently, 100% of the sample images were correctly segmented, after discarding regions that looked similar to pear in color by the naked eye. Next, all active pixels in the segmented image were employed as a region of interest (ROI) for extracting reflectance spectra. Consequently, the relative reflectance (spectrum) of each pixel within the ROI was extracted, and then the reflectance spectra of all pixels within ROI were averaged at each wavelength to represent the ROI. Following this procedure, a total of 60 mean spectral reflectance values were obtained (,). Identification of ROIs and extraction of spectral data from the ROIs were performed using the region of interest (ROI) function of ENVI v4.6 software (ITT Visual Information Solutions, Boulder, CO, USA).
Figure 2. RGB image for (a) unripe, (b) ripe, and (c) overripe pears. (d) Extraction of GLCM at different directions (0°, 45°, 90°, and 135°) and distance (D) for each pixel in the cropped square image.
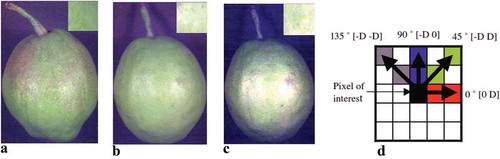
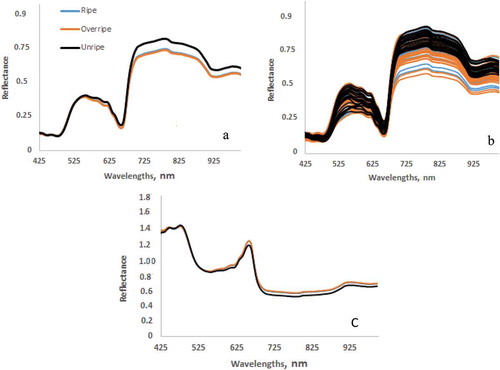
Figure 3. Average reflectance spectra (a), spectra (b), and absorbance (c) of 150 pear samples of three different ripen groups.
Optimal wavelengths selection utilizing SPA
Many researchers have studied a variety of methods to develop procedures that identify key wavelengths for use in robust models in the food industry such as typical wavelength selection methods, for example partial least squares regression (PLSR) and stepwise regression (SWR) [Citation38,Citation39]; spectral curves and correlation coefficients[Citation40]; stepwise regression[Citation41]; successive projections algorithm (SPA)[Citation4]; uninformative variable elimination (UVE)[Citation15]; simulated annealing (SA)[Citation42]; artificial neural network (ANN); and genetic algorithm (GA). [Citation35] Several reviews on wavelength selection methods and their application in food industry are also available.[Citation35,Citation43] In order to simplify the model and improve the performance of the identification ability, the successive projections algorithm (SPA) was conducted to select effective wavelengths in this study. A total of four wavelengths (513, 778, 866, and 987 nm) were identified as the key wavelengths by this algorithm. The selected wavelengths were then used to replace the full wavelengths for classification of different ripeness. Through wavelength selection, the raw spectral dataset was reduced to a matrix with a dimension of m × x, where m was the number of samples, and x was the number of selected wavelengths. The SPA is a forward variable selection method designed to extract optimal wavelengths from the whole wavelengths by minimizing the vector space of colinearity and eliminating redundant information from original spectral matrix.[Citation44] On the basis of Galvão et al.[Citation45], the principle of variable selection by SPA involves three main steps. At the first step, candidate subsets of variables with minimum colinearity are generated by projections on the columns of the spectral matrix. The second step consists of evaluating candidate subsets of variables by the value of root mean square error (RMSE) obtained from validation set of multiple linear regression (MLR) calibration. The final step tries to eliminate uninformative variables as a result of a variable removal procedure without significant loss of prediction capability. In this study to preserve the useful information of the spectral data and reduce the number of variables, the SPA was used by coding in the Matlab 2013a (The MathWorks, Natick, USA).
Extracting textural features using GLCM
As large variations were found in pears during three studied ripeness stages in terms of surface textures, texture is one of the significant image features, which can be used as an effective tool for ripeness classification.[Citation29] As shown in , the tested fruits classified into three ripeness categories: unripe, ripe, and overripe. The pears containing equal or more than 30% green area were classified as unripe fruits. RGB image was built for each fruit by picking up the Red (666 nm), Green (558 nm), and Blue (452 nm) bands from the corrected hyperspectral image to form a color image. As shown in the top right corner of , a small window (50 × 50 pixels) was cropped from the middle of each color image to find the texture change from fruit to fruit. Many researchers have studied a variety of algorithms to extract texture data, such as gray level co-occurrence matrix (GLCM)[Citation46], the gray level-gradient co-occurrence matrix (GLGCM),[Citation35] and wavelet.[Citation47]
Texture is one of the essential characteristics used in identifying objects or regions of interest of an image. GLCM, a popular texture analysis method, estimates image properties related to the second-order statistics. The image in its digital form is usually stored Ly in the computer as a two-dimensional array. If Lx = (1, 2,…, Nx) and Ly = (1, 2,…, Ny) are the horizontal and vertical spatial domains, then Lx×Ly is the set of resolution cells and the image I is a function that assigns some gray-tone value G = (1, 2,…, N) to each cell; I:Lx×Ly→G. Texture information contained in image I is defined as specified by the statistical distribution of the spatial relationships of gray level properties. This information can be summarized in GLCM that are matrices of relative frequencies P (i; j; d; θ) with which two neighboring pixels separated by distance d at orientation θ occur in the image, one with gray level i and the other with gray level j.[Citation36] In this study, the textural features were calculated from GLCM at different directions (0°, 45°, 90°, and 135°) and distance (D) by Matlab 2013a with the image processing toolbox for each pixel in the cropped square image (). In this research, to reduce the computational complexity, only correlation (Eq.3), contrast (Eq. 4), energy (Eq. 5), and homogeneity (Eq. 6) were used from GLCM. In this case, these characteristics refer to variations in the brightness values, or gray levels. These textural parameters first described by Haralick and Shanmugam[Citation48] used in spectral and spatial image analysis for remote sensing applications, and then widely used in texture classification in agricultural produces by Pydipati et al.[Citation49], ElMasry et al.[Citation29], Tournier et al.,[Citation50] and Pu et al.[Citation36]
where P(i,j) is the (I,j)th entry of the co-occurrence probability matrix. Also μx, μy, σx, and σy are the means and standard deviations, respectively, of the sums of rows and columns in the GLCM matrix.
Classification models
As the hyperspectral images combined spectral of each pixel and image at each wavelength together, it is convenient to classify the ripeness using the built classification models by extracting the feature of each pixel and inputting them to the corresponding classification model. In this study, classification algorithms were developed by the partial least square-discriminant analysis (PLS-DA), soft independent modeling of class analogy (SIMCA), and linear discriminant analysis (LDA). In brief, PLS-DA is a linear classification method used in statistics, pattern recognition, and machine learning that predicts the class number for each sample based on modeling with PLS regression.[Citation28] Historically, SIMCA, proposed by Wold et al.[Citation51] in 1977, was the first class-modeling method introduced in the literature. SIMCA uses a parametric method namely modeling properties of principal component technique (PCA). This method considers each class separately. For each class, a PCA that leads to a principal component (PC) model is performed. The validation set is used with every class models. An unknown sample is assigned to the class described by the model that produces the smallest residue during the prediction. SIMCA puts more emphasis on similarity within a class than on discrimination between classes. LDA (also known as Fisher discriminant analysis) is a linear and parametric method with discriminating characteristics. LDA focuses on finding optimal boundaries between classes. LDA like PCA is a feature reduction method. However, while PCA selects a direction that retains maximal structure in a lower dimension among the data, LDA selects the directions that achieve a maximum separation among the different classes.[Citation51]
Regression model
Regression is an approach for relating two or more sets of variables to each other. It corresponds to modeling one (or several) Y-variables on the basis of a well-chosen set of relevant X-variables, where X in general consists of more than one variable. Regression methods have played an important role as a tool in analyzing food samples of various types. In this study, the firmness prediction was conducted by the partial least squares (PLS) regression method. PLS looks for components that compromise between explaining the variation in the X-block and predicting the responses in Y.[Citation21] The accuracy of the calibration and validation were assessed by correlation coefficient (r), root mean square error of calibration (RMSEC), root mean square error of prediction (RMSEP), and ratio performance deviation (RPD) as follows[Citation28,Citation52]:
where ŷi is the predicted value of the i-th observation, yi is the measured value of the i-th observation, ym is the mean value of the calibration or prediction set, n, nc, and np are the total number of observations in the whole data set, in calibration, and the number of observations in prediction set, respectively, and SD is the standard deviation. Generally, a good model should have higher correlation coefficients; lower RMSEC and RMSEP values, but also a small difference between RMSEC and RMSEP.[Citation21]
Results and discussion
Samples selection
The changes in fruit firmness and SSC are closely associated with ripeness.[Citation1–Citation4,Citation53,Citation54] The statistical values of physical parameters, SSC, and firmness of pear for each class are presented in . As shown in this table, mass and size of the samples did not change with maturation, but firmness decreased significantly as fruit gradually ripened. Mean SSC tended to increase with development and peaked at the over-ripe stage. The results of the ANOVA of physical parameters, firmness and SSC in different ripening stage are shown in . As shown in this table, there was no apparent discrepancy between the mass/height of samples at different ripeness. Significant differences for firmness parameter were observed among the groups and had a descending tendency along with the development of ripeness. The difference of SSC among groups was also significant.
Table 1. Physical parameters, SSC, and firmness of pear for each class.
Table 2. One-way ANOVA of quality parameters of pear.
Spectral feature analysis
The Vis/NIR (425–1000 nm) spectral features of 150 pear samples are displayed in . As can be observed, the general trends of the spectral features for three categories of pear ripeness were similar. However, the amplitudes of variation of spectral absorbance were a bit different, which might be related to the alterations of biochemical and textural characteristics in pear samples during ripening. In the average reflectance spectra of each three studied group (), it was found that reflectance of both ripe and overripe fruits were lower than in that of unripe ones. On the other hand, the samples containing higher moisture contents had lower reflectivity across their spectra. As shown in , five main absorption bands appeared at approximately 490 nm, 540 nm, 650 nm, 780 nm, and 920 nm. Specifically, the absorbance in the visible region of 400–500 is associated with pigments. The absorption band at approximately 920 nm was due to the second overtone band of O–H stretch. In addition, the weaker absorption band near 780 nm was related to the third overtone band of O–H stretch.[Citation1] Comparison of the spectra of 150 pear samples (), however, showed that the different ripening stages could not be easily discriminated through the origin spectra. There were some overlaps particularly between the neighboring groups.
Classification results analysis based on original spectra
As it was stated earlier, three classification models namely PLS-DA, SIMCA, and LDA were established based on spectra (full spectra and optimal wavelength) and texture. The results of these models are shown in and . As it is clear from , the PLS-DA model yields a slightly better result in comparison with the two other models with higher correct classification rate (CCR) of 91.67% in the calibration set and 86.67% in the prediction set. Many researchers also have reported that the CCR of PLS-DA model was higher than other classification models for classification of agricultural production.[Citation28,Citation55,Citation56] However, Sirisomboon et al. reported that SIMCA showed obviously better performance than PLS-DA in classification of green soybean pods. As LDA would be difficult to calculate when the number of samples was far less than variables, only the SIMCA and PLS-DA classification models were developed to make a comparison. Their performances were presented in .
Table 3. Classification results of the ripeness for the calibration set and the prediction set by PLS-DA and SIMCA based on the original data.
Table 4. Classification results for the prediction set of pear samples by three studied models using optimal wavelengths selected by SPA.
Figure 4. Scores scatter plot of PC1 and PC2 of PCA conducted on feature wavelengths.
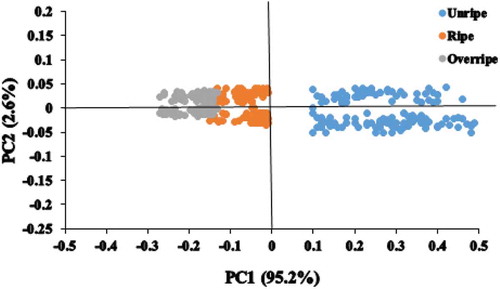
Figure 5. Pear textural features at different ripeness stage using GLCM.
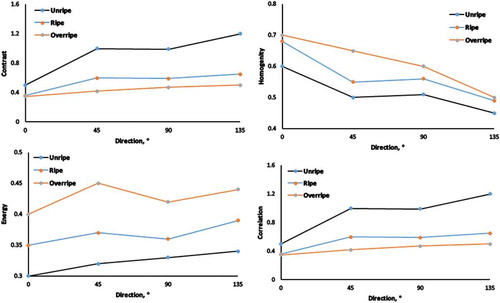
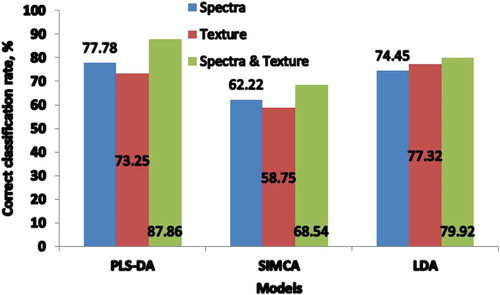
Figure 6. Results of different classifiers using three types of subsets.
Optimal wavelength selection using the SPA
As stated before, it is important to select the wavelengths that contribute to the quality attribute of the product. The hyperspectral images contain abundant information, which is time consuming for data processing and unsuitable for online detection. In order to reduce the dimensional and redundant information, SPA was applied to select the feature wavelengths. This processing was conducted in by coding in the Matlab 2013a (The MathWorks, Natick, USA). The maximum number of effective variables selected by SPA was set as 30 on the basis of experience and practical consideration.[Citation4] After calculating, four wavelengths (513, 778, 866, and 987 nm) were selected.
PCA conducted on the spectra of selected optimal wavelengths of the calibration set displayed that the first two components explained 97.8 % (PC1—95.2% and PC2—2.6%) of the differences of pear fruit at different ripening stages (). Most of the observed values were distinguished into three studied groups. It showed that selected wavelengths could be used for discriminating the ripeness of pear.
Compared to the results of the three studied models based on full spectra, the performance of optimal wavelengths based SIMCA and LDA models was worse. CCR of PLS-DA and SIMCA decreased from 86.67% to 77.78% and 73.33% to 62.22%, respectively. Consequently, the PLS-DA classifier with CCR of 77.78% showed the best result. In addition, as it can be found from , the highest CCR of 80% appeared in the unripe group. To sum up, except the SIMCA model, two other models achieved good predictive accuracy, and the feature wavelengths could be considered valid.
Textural variables analysis
The average of four studied textural features (contrast, homogeneity, energy, and correlation) of pear at different three ripeness stages are shown in . Compared with unripe fruits, contrast of ripe and overripe fruits was much lower. This means that unripe fruits contain high local variations in all directions (0°, 45°, 90°, and 135°). Considering the homogeneity values also showed same conclusion. As it can be found from this figure, the overripe fruits were more homogeneous, while the unripe fruits had the lowest homogeneity for all directions. The high correlation values of unripe fruits show that this stage has smooth texture compared with overripe fruits (lowest correlation values) that are rough in their texture (). The energy of fruits of the ripe and overripe groups was higher in those of the unripe group, which meant that the unripe pears were less homogeneous (). In general, for all direction in all three studied ripeness stages, any intersections were among all parameters. Therefore, it is possible for ripeness classification based on these statistics. This finding was in agreement with the results found on other fruits such as strawberry and persimmon.[Citation29,Citation58]
Lastly, three different subsets (spectra of feature wavelengths, texture features at feature wavelengths, and spectra of feature wavelengths combined the texture features) were adopted as different inputs to the classification models. show the obtained results. As it can be found from this figure, the PLS-DA classifier with the input of spectra combined the texture features had the highest CCR of 87.86%, which increased by 10.08% compared with the PLS-DA classifier with the input of spectra of feature wavelengths. The LDA classifier showed best result with the CCR of 79.92%, if only using the subset of spectra combined the texture features as the input.
The results of above sections indicated the possibility of developing a nondestructive technique using hyperspectral imaging for ripeness classification of pear fruit. The overall results revealed that the best model was PLS-DA, of which the correct classification rate (CCR) was 87.86% with the input consisted of the spectra and texture feature of images. Hence, combining spectral with texture analyses are effective for improving pear ripeness prediction. In the next section, the PLS models were established between reflectance spectra and the firmness.
Prediction of firmness
Owing to the firmness had obvious linear correlations with the maturity stages in ANOVA analysis, the input of classifiers also could act as the input of firmness prediction if the data processing strategy used to ripeness classification was reasonable. Consequently, we investigated firmness prediction using the PLS regression analysis with the spectra of feature wavelengths and the texture features. As stated before, the model was assessed by correlation coefficient (r), root mean square error of calibration (RMSEC), root mean square error of prediction (RMSEP), and ratio performance deviation (RPD) as shown in . As it can be seen in , the PLS models can predict firmness with r = 0.84, RMSEP = 0.78 N, and RPD = 2.03. These parameters for the calibration models were found to be r = 0.85, RMSEC = 0.79 N, and RPD = 2.11. Fan et al. [Citation4] have studied the predicting ability of SPA-PLS models for SSC and firmness of pears. They found that correlation coefficient (r) and RMSEP were 0.85 and 0.521 for SSC and 0.84 and 0.786 for firmness.
Figure 7. Firmness predicted using the PLS models.
Conclusion
Ripening is an important stage, widely used for the quality warranty of fruits. In this study, hyperspectral imaging in the spectral region of 425–1000 was applied to classify the ripening stage of pears by applying three types of classifiers namely PLS-DA, SIMCA, and LDA based on the spectra (full spectra and optimal wavelength), texture, and combination of spectral and textural information. SPA was used to select optimal wavelengths and GLCM was applied to extract four textural feature variables. The results revealed that high average prediction accuracy with a CCR of 87.86% was achieved by integrating the optimal wavelengths obtained by SPA and the textural variables obtained by GLCM, which was better than that of 77.78% based on optimal wavelengths or that of 77.32% based on textural feature alone. The same dataset for ripeness classification also got a good performance of firmness prediction by PLS in the regression analysis. Overall, the results of this study suggested that hyperspectral imaging together with chemometrics could be nondestructively used to classify the ripening stage of pear. More research is needed to include more samples as well as different regions and different postharvest treatments to ascertain the discrimination power of this method.
Additional information
Funding
Related Research Data
References
- Li, J.; Huang, W.; Zhao, C.; Zhang, B. A Comparative Study for the Quantitative Determination of Soluble Solids Content, pH and Firmness of Pears by Vis/NIR Spectroscopy. J. Food Eng. 2013, 116(2), 324–332. DOI: 10.1016/j.jfoodeng.2012.11.007.
- Paz, P.; Sánchez, M. T.; Pérez-Marín, D.; Guerrero, J. E.; Garrido-Varo, A. Instantaneous Quantitative and Qualitative Assessment of Pear Quality Using near Infrared Spectroscopy. Comput. Electron. Agric. 2009, 69(1), 24–32. DOI: 10.1016/j.compag.2009.06.008.
- Travers, S.; Bertelsen, M. G.; Petersen, K. K.; Kucheryavskiy, S. V. Predicting Pear (Cv. Clara Frijs) Dry Matter and Soluble Solids Content with near Infrared Spectroscopy. Lebenson Wiss Technol. 2014, 59(2, Part 1), 1107–1113. DOI: 10.1016/j.lwt.2014.04.048.
- Fan, S.; Huang, W.; Guo, Z.; Zhang, B.; Zhao, C. Prediction of Soluble Solids Content and Firmness of Pears Using Hyperspectral Reflectance Imaging. Food Anal. Methods. 2015, 8, 1936–1946. DOI: 10.1007/s12161-014-0079-1.
- Lu, R.;. Detection of Bruises on Apples Using Near-Infrared Hyperspectral Imaging. T Asae. 2003, 46(2), 523–530.
- Peng, Y.; Lu, R. Analysis of Spatially Resolved Hyperspectral Scattering Images for Assessing Apple Fruit Firmness and Soluble Solids Content. Postharvest Biol. Technol. 2008, 48(1), 52–62. DOI: 10.1016/j.postharvbio.2007.09.019.
- Ariana, D. P.; Lu, R. Detection of Internal Defect in Pickling Cucumbers Using Hyperspectral Transmittance Imaging. T Asabe. 2008, 51(2), 705–713. DOI: 10.13031/2013.24367.
- Gowen, A. A.; Taghizadeh, M.; O’Donnell, C. P. Identification of Mushrooms Subjected to Freeze Damage Using Hyperspectral Imaging. J. Food Eng. 2009, 93(1), 7–12. DOI: 10.1016/j.jfoodeng.2008.12.021.
- Leiva-Valenzuela, G. A.; Lu, R.; Aguilera, J. M. Prediction of Firmness and Soluble Solids Content of Blueberries Using Hyperspectral Reflectance Imaging. J. Food Eng. 2013, 115(1), 91–98. DOI: 10.1016/j.jfoodeng.2012.10.001.
- Lee, W. H.; Kim, M. S.; Lee, H.; Delwiche, S. R.; Bae, H.; Kim, D. Y.; Cho, B. K. Hyperspectral Near-Infrared Imaging for the Detection of Physical Damages of Pear. J. Food Eng. 2014, 130, 1–7. DOI: 10.1016/j.jfoodeng.2013.12.032.
- Cubero, S.; Aleixos, N.; Moltó, E.; Gómez-Sanchis, J.; Blasco, J. Advances in Machine Vision Applications for Automatic Inspection and Quality Evaluation of Fruits and Vegetables. Food. Bioproc. Tech. 2011, 4(4), 487–504. DOI: 10.1007/s11947-010-0411-8.
- Wu, D.; Sun, D. W. Advanced Applications of Hyperspectral Imaging Technology for Food Quality and Safety Analysis and Assessment: A Review — Part II: Applications. Innov. Food Sci. & Emerg. Technol. 2013, 19(0), 15–28. DOI: 10.1016/j.ifset.2013.04.016.
- Qin, J.; Chao, K.; Kim, M. S.; Lu, R.; Burks, T. F. Hyperspectral and Multispectral Imaging for Evaluating Food Safety and Quality. J. Food Eng. 2013, 118(2), 157–171. DOI: 10.1016/j.jfoodeng.2013.04.001.
- Huang, H.; Liu, L.; Ngadi, M. Recent Developments in Hyperspectral Imaging for Assessment of Food Quality and Safety. Sens. J. 2014, 14(4), 7248–7276. DOI: 10.3390/s140407248.
- Pu, Y. Y.; Feng, Y. Z.; Sun, D. W. Recent Progress of Hyperspectral Imaging on Quality and Safety Inspection of Fruits and Vegetables: A Review. Compr. Rev. Food Sci. Food Saf. 2015a, 14(2), 176–188. DOI: 10.1111/1541-4337.12123.
- Moreda, G. P.; Ortiz-Cañavate, J.; García-Ramos, F. J.; Ruiz-Altisent, M. Non-Destructive Technologies for Fruit and Vegetable Size Determination – A Review. J. Food Eng. 2009, 92(2), 119–136. DOI: 10.1016/j.jfoodeng.2008.11.004.
- Alfatni, M. S.; Mohamed Shariff, A. R.; Abdullah, M. Z.; Ben Saeed, O. M.; Ceesay, O. M. Recent Methods and Techniques of External Grading Systems for Agricultural Crops Quality Inspection – Review. Ijfe. 2011, 7(3), Art. 10. DOI: 10.2202/1556-3758.1932.
- Costa, G.; Noferini, M.; Andreotti, C. Non-Destructive Determination of Internal Quality in Intact Pears by near Infrared Spectroscopy. Acta Hortic. 2002, 596, 821–825. DOI: 10.17660/ActaHortic.2002.596.142.
- Liu, Y. D.; Ying, Y. B.; Fu, X. P.; Lu, H. S. Experiments on Predicting Sugar Content in Apples by FT-NIR Technique. J. Food Eng. 2007a, 80, 986–989. DOI: 10.1016/j.jfoodeng.2006.06.035.
- Liu, Y. D.; Chen, X. M.; Sun, X. D.; Ying, Y. B. Non-Destructive Measurement of Pear Internal Quality Indices by Visible and Near-Infrared Spectrometric Techniques. New Zeal. J. Agr. Res. 2007b, 50, 1051–1057. DOI: 10.1080/00288230709510385.
- Nicolai, B. M.; Beullens, K.; Bobelyn, E.; Peirs, A.; Saeys, W.; Theron, K. I.; Lammertyn, J. Nondestructive Measurement of Fruit and Vegetable Quality by Means of NIR Spectroscopy: A Review. Postharvest Biol. Technol. 2007, 46, 99–118. DOI: 10.1016/j.postharvbio.2007.06.024.
- Shao, Y. H.; He, Y.; Bao, Y. D.; Mao, J. Y. Near-Infrared Spectroscopy for Classification of Oranges and Prediction of the Sugar Content. Int. J. Food. Prop. 2009, 12, 644–658. DOI: 10.1080/10942910801992991.
- Louw, E. D.; Theron, K. I. Robust Prediction Models for Quality Parameters inJapanese Plums (Prunussalicina L.) Using NIR Spectroscopy. Postharvest Biol. Technol. 2010, 58, 176–184. DOI: 10.1016/j.postharvbio.2010.07.001.
- Morales-Sillero, A.; Fernandez-Cabanas, V. M.; Casanova, L.; Jimenez, M. R.; Suarez, M. P.; Rallo, P. Feasibility of NIR Spectroscopy for Non-Destructive Characterization of Table Olive Traits. J. Food Eng. 2011, 107, 99–106. DOI: 10.1016/j.jfoodeng.2011.05.039.
- Liu, D.; Sun, D. W.; Zeng, X. A. Recent Advances in Wavelength Selection Techniques for Hyperspectral Image Processing in the Food Industry. Food. Bioproc. Tech. 2015, 7, 307–323. DOI: 10.1007/s11947-013-1193-6.
- Khodabakhshian, R.; Emadi, B.; Khojastehpour, M.; Golzarian, M. R. Combination of Conventional Imaging and Spectroscopy Methods for Food Quality Evaluation. 4th International Workshop on Computer Science and Engineering, United Arab Emirates, Dubai 2014.
- Chao, K. L.; Yang, C. C.; Kim, M. S. Line-Scan Spectral Imaging System for Online Poultry Carcass Inspection. J. Food Process. Eng. 2011, 34(1), 125–143. DOI: 10.1111/j.1745-4530.2008.00341.x.
- Xiong, Z.; Sun, D. W.; Pu, H.; Zhu, Z. Combination of Spectra and Texture Data of Hyperspectral Imaging for Differentiating between Free-Range and Broiler Chicken Meats. Lebenson Wiss Technol. 2015, 60, 649–655. DOI: 10.1016/j.lwt.2014.10.021.
- ElMasry, G.; Wang, N.; ElSayed, A.; Ngadi, M. Hyperspectral Imaging for Nondestructive Determination of Some Quality Attributesfor Strawberry. J. Food Eng. 2007, 81(1), 98–107. DOI: 10.1016/j.jfoodeng.2006.10.016.
- Cen, H.; Lu, R.; Mendoza, F. A.; Ariana, D. P. Peach Maturity/Quality Assessment Using Hyperspectral Imaging-Based Spatially Resolved Technique. In: Proc. SPIE 8027, Sensing for agriculture and food quality and safety III, 80270L, 02 June 2011, Bellingham, USA.
- Rajkumar, P.; Wang, N.; Eimasry, G.; Raghavan, G. S. V.; Gariepy, Y. Studies on Banana Fruit Quality and Maturity Stages Using Hyperspectral Imaging. J. Food Eng. 2012, 108(1), 194–200. DOI: 10.1016/j.jfoodeng.2011.05.002.
- Zhu, Q.; He, C.; Lu, R.; Mendoza, F. Ripeness Evaluation of ‘Sun Bright’ Tomato Using Optical Absorption and Scattering Properties. Postharvest Biol. Technol. 2015, 103, 27–34. DOI: 10.1016/j.postharvbio.2015.02.007.
- Lleo, L.; Roger, J. M.; Herrero-Langreo, A.; Diezma-Iglesias, B.; Barreiro, P. Comparison of Multispectral Indexes Extracted from Hyperspectral Images for the Assessment of Fruit Ripening. J. Food Eng. 2011, 104(4), 612–620. DOI: 10.1016/j.jfoodeng.2011.01.028.
- Huang, W.; Li, J.; Wang, Q.; Chen, L. Development of a Multispectral Imaging System for Online Detection of Bruises on Apples. J. Food Eng. 2015, 146, 62–71. DOI: 10.1016/j.jfoodeng.2014.09.002.
- Liu, D.; Sun, D. W.; Zeng, X. A. Recent Advances in Wavelength Selection Techniques for Hyperspectral Image Processing in the Food Industry. Food. Bioproc. Tech. 2014a, 7, 307–323. DOI: 10.1007/s11947-013-1193-6.
- Pu, H.; Sun, D. W.; Ma, J.; Cheng, J. H. Classification of Fresh and Frozen-Thawed Pork Muscles Using Visible and near Infrared Hyperspectral Imaging and Textural Analysis. Meat Sci. 2015b, 99, 81–88. DOI: 10.1016/j.meatsci.2014.09.001.
- Li, X. L.; Nie, P. C.; Qiu, Z. J.; He, Y. Using Wavelet Transform and Multi-Class Least Square Support Vector Machine in Multi-Spectral Imaging Classification of Chinese Famous Tea. Expert Syst. Appl. 2011, 38(9), 11149–11159. DOI: 10.1016/j.eswa.2011.02.160.
- Chong, L. G.; Jun, C. H. Performance of Some Variable Selection Methods When Multi Collinearity Is Present. Chemometr. Intell. Lab. 2005, 78(1), 103–112. DOI: 10.1016/j.chemolab.2004.12.011.
- Barbin, D. F.; ElMasry, G.; Sun, D. W.; Allen, P. Nondestructive Determination of Chemical Composition in Intact and Minced Pork by Near-Infrared Hyperspectral Imaging. Food Chem. 2013a, 138(2–3), 1162–1171. DOI: 10.1016/j.foodchem.2012.11.120.
- Qiao, J.; Wang, N.; Ngadi, M. O.; Gunenc, A.; Monroy, M.; Gariepy, C. Prediction of Drip-Loss, pH, and Color for Pork Using a Hyperspectral Imaging Technique. Meat Sci. 2007, 76(1), 1–8. DOI: 10.1016/j.meatsci.2006.06.031.
- Tao, F.; Peng, Y.; Li, Y.; Chao, K.; Dhakal, S. Simultaneous Determination of Tenderness and Escherichia Coli Contamination of Pork Using Hyperspectral Scattering Technique. Meat Sci. 2012, 90(3), 851–857. DOI: 10.1016/j.meatsci.2011.11.028.
- Chang, Y. L.;. A Simulated Annealing Feature Extraction Approach for Hyperspectral Images. Future Gener. Comput. Syst. 2011, 27(4), 419–426. DOI: 10.1016/j.future.2010.08.008.
- Pu, H.; Kamruzzaman, M.; Sun, D. W. Selection of Feature Wavelengths for Developing Multispectral Imaging a Systems for Quality, Safety and Authenticity of Muscle Foods- a Review. Trends Food Sci. Technol. 2015c, 45, 86–104. DOI: 10.1016/j.tifs.2015.05.006.
- Araujo, M. C. U.; Saldanha, T. C. B.; Galva, R. K. H.; Yoneyama, T.; Chame, H. C.; Visani, V. The Successive Projections Algorithm for Variable Selection in Spectroscopic Multicomponent Analysis. Chemometr. Intell. Lab. 2001, 57, 65–73. DOI: 10.1016/S0169-7439(01)00119-8.
- Galvão, R. K. H.; Araujo, M. C. U.; Fragoso, W. D.; Silva, E. C.; Jose, G. E.; Soares, S. F. C. (A Variable Elimination Method Toimprove the Parsimony of MLR Models Using the Successive Projections Algorithm. Chemometr. Intell. Lab. 2008, 92(1), 83–91. DOI: 10.1016/j.chemolab.2007.12.004.
- He, H. J.; Wu, D.; Sun, D. W. Potential of Hyperspectral Imaging Combined with Chemometric Analysis for Assessing and Visualizing Tenderness Distribution in Raw Farmed Salmon fillets. J. Food Eng. 2014, 126, 156–164. DOI: 10.1016/j.jfoodeng.2013.11.015.
- Pu, H.; Sun, D. W.; Ma, J.; Liu, D.; Cheng, J. H. Using Wavelet Textural Features of Visible and near Infrared Hyperspectral Image to Differentiate between Fresh and Frozen Thawed Pork. Food. Bioproc. Tech. 2014, 7(11), 3088–3099. DOI: 10.1007/s11947-014-1330-x.
- Haralick, R. M.; Shanmugam, K. S. Combined Spectral and Spatial Processing of ERTS Imagery Data. Remote Sens. Environ. 1974, 3(1), 3–13. DOI: 10.1016/0034-4257(74)90033-9.
- Pydipati, R.; Burks, T. F.; Lee, W. S. Identification of Citrus Disease Using Color Texture Features and Discriminant Analysis. Comput. Electron. Agric. 2006, 52(1), 49–59. DOI: 10.1016/j.compag.2006.01.004.
- Tournier, C.; Grass, M.; Zope, D.; Salles, C.; Bertrand, D. Characterizations of Bread Break down during Mastication by Image Texture Analysis. J. Food Eng. 2012, 113(4), 615–622. DOI: 10.1016/j.jfoodeng.2012.07.015.
- Wold, S.; Sjostrom, M. SIMCA: A Method for Analyzing Chemical Data in Terms of Similarity and Analogy. In Chemometrics: Theory and Application. ACS Symposium Series; Kowalski, B., Eds.; American Chemical Society: Washington DC, 1977; Vol. 52. pp. 243.
- Suykens, J. A. K.; Vandewalle, J. Least Squares Support Vector Machine Classifiers. Neural Process. Lett. 1999, 9(3), 293–300. DOI: 10.1023/A:1018628609742.
- Khodabakhshian, R.; Emadi, B.; Khojastehpour, M.; Golzarian, M. R.; Sazgarnia, A. Nondestructive Evaluation of Maturity and Quality Parameters of Pomegranate Fruit by Visible/Near Infrared Spectroscopy. Int. J. Food. Prop. 2017, 20, 41–52. DOI: 10.1080/10942912.2015.1126725.
- Khodabakhshian, R.; Emadi, B.; Khojastehpour, M.; Golzarian, M. R.; Sazgarnia, A. Development of a Multispectral Imaging System for Online Quality Assessment of Pomegranate Fruit. Int. J. Food. Prop. 2017, 20, 107–118. DOI: 10.1080/10942912.2016.1144200.
- Galtier, O.; Abbas, O.; Le Driau, Y.; Rebufa, C.; Kister, J.; Artaud, J.; Dupuy, N. Comparison of PLS1-DA, PLS2-DA and SIMCA for Classification by Origin of Crude Petroleum Oils by MIR and Virgin Olive Oils by NIR for Different Spectral Regions. Vib. Spectrosc. 2011, 55, 132–140. DOI: 10.1016/j.vibspec.2010.09.012.
- Mireei, S. A.; Sadeghi, M. Detecting Bunch Withering Disorder in Date Fruit by near Infrared Spectroscopy. J. Food Eng. 2013, 114(3), 397–403. DOI: 10.1016/j.jfoodeng.2012.08.032.
- Sirisomboon, P.; Hashimoto, Y.; Tanaka, M. Study on Non-Destructive Evaluation Methods for Defect Pods for Green Soybean Processing by Near-Infrared Spectroscopy. J. Food Eng. 2009, 93(4), 502–512. DOI: 10.1016/j.jfoodeng.2009.02.019.
- Wei, X.; Liu, F.; Lee, H.; Qiu, Z.; Shao, Y.; He, Y. Ripeness Classification of Astringent Persimmon Using Hyperspectral Imaging Technique. Food. Bioproc. Tech. 2014, 7, 1371–1380. DOI: 10.1007/s11947-013-1164-y.