
ABSTRACT
The low stability of anthocyanins limits their use in industry, which can be surpassed by gliadins linkage. This work was aimed to study the anthocyanins-gliadins bonding properties. HPLC-DAD-ESI-MS2 analysis indicated that the main litchi pericarp anthocyanin (LPA) was cyanidin-3-glucoside-5-rhamnoside (C3G5R). Ultraviolet and fluorescence data revealed the presence of anthocyanin-protein complexes, with strong binding affinity by a combination of hydrogen bonds and van der Waals forces. The combination of C3G5R and gliadins changed its secondary structure. The scavenging effect of the anthocyanin-protein complex over 2,2-diphenyl-1-picrylhydrazyl was comparable to LPA alone. These results may broaden gluten usage to stabilize anthocyanins and so their use in the food, pharmaceutic, and cosmetic industries due to their potential use as colorants and antioxidants.
Introduction
The use of plant proteins, and their modified forms, is increasingly being investigated in order to improve the nutritional and physicochemical properties of foods. The chemical structure of phenolics allow their interaction with diverse plant food components, not only proteins, but also lipids, via hydrophobic and ionic interactions, as well by covalent and hydrogen bonding.[Citation1–Citation3] The formation of complexes between phenolics and proteins can affect the rheological, functional, and biological properties of foods.[Citation3,Citation4] Recent studies have demonstrated that phenolic-protein complexes in the Nigella species have significant antioxidant and antihypertensive inhibitory properties, despite the weak correlation between the phenolics content of the isolated protein fractions and their bioactivities.[Citation5]
The coloring of many plants, flowers, and fruits is conferred by a group of natural phenolic compounds, named anthocyanins,[Citation6] which show possible beneficial properties such as anticarcinogenic properties, prevention of cardiovascular diseases, along with other biological effects attributed to the antioxidant activity.[Citation7–Citation10] Litchi (Litchi chinensis Sonn.) is a tropical fruit from South China, with a bright red attractive pericarp, which contains a large amount of anthocyanins.[Citation11] Cyanidin-3-glucoside, cyanidin-3-rutinoside, malvidin-3-glucoside, and quercetin-3-rutinoside were identified as the major monomeric anthocyanins pigments.[Citation12–Citation15] Besides their color features, litchi pericarp anthocyanins (LPA) have attracted some interest due to their antioxidant activity.[Citation11] Most of the anthocyanin 3-glucosides can be regarded as potential colorants to use in food products.[Citation16] However, their use as food colorants is often limited due to the reduced stability of the molecular structure that is influenced by several factors, such as extraction solvent and temperature, and mainly by the pH value of the matrix under question.[Citation17–Citation20]
Gluten is the major storage protein fraction of wheat flour and is divided into two groups: gliadins and glutenins. In fact, gliadins, the alcohol-soluble fraction of gluten, are a family of heterogeneous polypeptides of molecular weight ranging from 30 to 55 kDa.[Citation21] Moreover, the repetitive domains of gliadins consist of short repeated sequences, with high content of proline and glutamine, which are often considered as strong allergens. It has been reported that anthocyanins-gliadins complexes are very soluble in acidic conditions,[Citation22] thus promoting the utilization of these proteins. However, researches concerning the binding of anthocyanins to gliadins, and the functional properties of their complexes are seldom reported. Thus, information regarding the nature and behavior of the interaction between LPA and gliadins is missing and of great interest.
The overall objective of this research was to investigate the spectroscopic characteristics of LPA-gliadins complexes, using ultraviolet (UV) analysis and fluorescence measurements. The antioxidant activity of the anthocyanin-protein complexes was also determined. The results provide new insights on the interaction of biomacromolecules and bioactive small molecules in foods, with potential general relevance for human health.
Materials and methods
Samples, chemicals, and reagents
Litchi (Litchi chinensis), variety Guiwei, fruits were ordered from a local supermarket (Guangzhou, China) and arrived in the laboratory within 24 h postharvest. The fruits were quickly peeled and the pericarp was stored at −20°C. Gluten was supplied by Shandong Qufeng Food Science Co. Ltd (Shandong, China). Methanol and trifluoroacetic acid (HPLC grade) were purchased from Fisher Scientific (Waltham, Massachusetts, USA), DPPH was purchased from Sigma (St. Louis, MO, USA), and other chemicals used were of analytical grade. Folin-ciocalteu reagent was offered by Bio-Rad Co. (Shanghai, China).
Extraction and isolation of gliadins
Gliadins were separated from gluten by extraction with 70% aqueous ethanol and stirring for 2 h at 40°C.[Citation23] The extraction process was repeated twice, and the combined suspension was centrifuged (15,000 × g for 30 min) at room temperature. The clear supernatant was concentrated using a rotary evaporator, after which the product was lyophilized and stored at −20°C.
Isolation of litchi pericarp anthocyanins
Frozen litchi pericarp fragments were extracted under acidic conditions using 70% ethanol (pH 3.5) at 40°C for 2 h. The crude anthocyanin aqueous solution was loaded onto an AB-8 weak polarity resin (0.3–1.25 mm particle size, Nankai Hecheng Science & Technology Co., Tianjin, China) column (15 × 3.5 cm, ID, Labmart Scientific Instruments Co. Ltd., Beijing, China), and the fraction eluted with 70% ethanol (pH 3.5) was collected. The eluated was vacuum evaporated at 40°C and the concentrate was freeze dried to obtain LPA extracts.
Polyphenol analysis
Total phenol content
Total phenols of LPA extracts were determined by the Folin-ciocalteu assay.[Citation24] Standard solutions of gallic acid of different concentrations ranging from 0 to 0.5 mg/mL were prepared and colorimetrically quantified at 765 nm, using a UV-2100 spectrophotometer (Unico Instrument Co. Ltd., Shanghai, China). All the results were obtained from triplicated samples.
Total anthocyanins
Total anthocyanins content of LPA was determined according to a pH differential method based on color changes of anthocyanins with pH, as proposed by Lee et al.[Citation25] For each sample, the absorbance (proportional to anthocyanins’ content) was measured at pH 1.0 and pH 4.5. The anthocyanins content was calculated according to Eq. (1):
where TA is the total anthocyanins content expressed as cyanidin-3-glucoside equivalent (C3G) (mg C3G/g), Amax and A700 represent the absorbancies at 541 nm and 700 nm, respectively, V is the volume of extract (mL), M is the molecular weight of cyanidin-3-glucoside (449.4 g/mol), DF is the dilution factor, Ɛ is the extinction coefficient of cyanidin-3-glucoside (26,900 L/mol/cm), L is the width of the cuvette (cm), and mf is the weight of sample (g).
Anthocyanin HPLC-DAD-ESI-MS2 analysis
The anthocyanins profiles of LPA extracts were obtained by high-performance liquid chromatography (HPLC), with diode array detector (DAD) coupled with mass spectrometry (with electrospray ionization interface, ESI) (1100 series, Agilent Technologies Co. Ltd., Santa Clara, CA, USA) according to the method previously reported by Zhu et al.,[Citation26] with slight modifications. Samples were dissolved in methanol to 0.5 mg/mL and filtered through 0.22 μm membrane before injection. Mobile phases were (A) methanol, and (B) 0.1% aqueous trifluoroacetic acid. A VP-ODS-C18 (150 mm × 4.6 mm, 5 μm particle size, SHIMADZU) column was used and 20 μL of sample solution was injected. The elution conditions were set as follows: a linear gradient from 22% to 55% of mobile phase A for 50 min, then holding on for another 5 min at a flow rate of 0.8 mL/min. The absorbency of the eluate was monitored at 520 nm. MS conditions consisted of sheath gas (N2) at a flow rate of 10 L/min, spray voltage of 40 psi, capillary heat temperature of 325°C, and an orifice voltage of −30 V. The effluent was subsequently detected by ESI-MS with a positive ion mode.
Ultraviolet absorption measurements
A 3.0 mL solution containing approximately 5 × 10⁻⁶ mol/L of gliadins solution was titrated and mixed with a series of LPA amounts (60, 120, 180, 240, 300, 360, 420, 480, 540, 600 μL) at a concentration of 5 × 10⁻⁴ mol/L, to obtain final ratios of LPA/gliadins of 2, 4, 6, 8, 10, 12, 14, 16, 18, and 20, respectively. The ultraviolet (UV) absorption spectroscopy of the complex was recorded in the range of 190–400 nm at 25°C, in a quartz cuvette.[Citation6] The UV absorption spectroscopy of individual LPA (5 × 10⁻⁶ mol/L) and gliadins (5 × 10⁻⁶ mol/L) solution was also detected in an Evolution 220 UV-Vis spectrophotometer (Thermo Fisher Co., California, USA) as control.
Fluorescence quenching measurements
The fluorescence intensities of gliadins and anthocyanins-gliadins complexes were recorded by an F-4600 Luminescence Phosphorescence Spectrophotometer (Hitachi Ltd., Tokyo, Japan), using 5 nm excitation and 5 nm emission slit widths.[Citation27] A 3.0 mL solution, containing 5 × 10⁻⁶ mol/L gliadins, was titrated by successive additions of the LPA solution (to obtain final ratios of LPA/gliadins of 2, 4, 6, 8, 10, 12, 14, 16, 18, and 20, respectively). Titrations were done manually using a micropipettor and incubated at 15°C, 25°C, and 35°C for 30 min. Changes on the fluorescence emission intensity were measured in the range of 290–450 nm with the excitation wavelength set to 280 nm. Appropriate blanks corresponding to the phosphate buffered saline (PBS) were subtracted to correct background fluorescence. All the measurements were performed in triplicate and the results were expressed as mean±standard deviation. In order to obtain the quenching constants, the data were plotted as a Stern–Volmer plot, according to Eq. (2):
The binding equilibria between free and bound biomolecules were obtained by Eq. (3):
where F0 and F represent the fluorescence intensities of gliadins in the absence and in the presence of the LPA quencher, respectively, Ksv is the Stern–Volmer dynamic quenching constant, [Q] is the concentration of LPA, KA and n are the binding constant and the number of binding sites, respectively.
DPPH radical scavenging activity
DPPH radical scavenging activity was assessed as proposed by Ningappa et al.,[Citation28] with some modifications. Different LPA extracts, at various concentrations ranging from 6 to 300 µg/mL, as well as corresponding LPA-gliadins complexes, were dissolved in 1.0 mL of deionized water, respectively. Then, each sample solution was mixed with 1.0 mL of a freshly prepared ethanolic solution of 0.2 mM DPPH. After incubation at room temperature in the dark for 30 min, the absorbency was measured at 517 nm. The negative control was equally measured, but without any extracts. The scavenging effect of sample was measured by monitoring the absorbency decay at 517 nm in comparison with the negative control. Inhibition concentration at which concentration the radical was 50% scavenged (IC50 value) was calculated from % inhibition values obtained at all tested samples.
Statistical analyses
All statistical analyses were performed using SPSS software package 12.0. IC50 was calculated by Probit Regression with SPSS. Antioxidant data were expressed as mean ± standard deviation (SD). The significance of difference between groups was determined using analysis of variance (ANOVA). The statistical significance was defined as p < 0.05.
Results and discussion
Anthocyanin profiles of litchi pericap extract
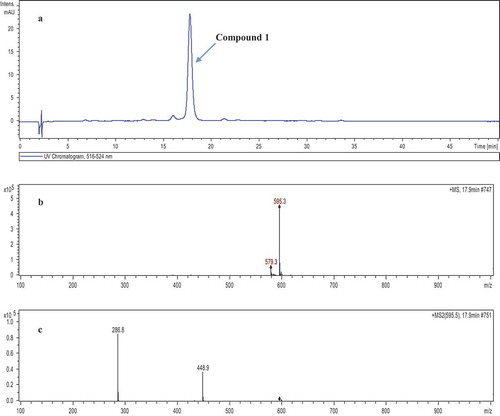
Litchi pericap extracts reacted showed a high phenol content of 90.5 ± 1.3% (w/w) gallic acid equivalents. Moreover, the total anthocyanins (TA) content of LPA was 548.2 ± 21.5 mg/g (in dry weight basis), based on the pH differential method of quantification. The major anthocyanins of LPA were identified by HPLC-DAD-ESI-MS2 and their chromatographic characteristics are shown in . There was a clear signal of LPA in the visible spectra, and its stronger absorption was found around 516–524 nm. It was found that compound 1 (retention time, tR = 17.9 min, λmax = 520 nm) showed a positive molecular ion peak ([M + H]+) at m/z 595.3 with MS2 yielding major fragment ions at m/z 448.9 and 286.8. The signal of ion at m/z 286.8 may imply the presence of a cyanidin parent structure, which came from [M+H2O-180]+ at m/z 448.9, corresponding to the elimination of a glucose molecule. The ion at m/z 448.9, a loss of 146 mass unit (amu), came from the rhamnose cleavage of the parent ion at m/z 595.3. Thus, the mass spectrum of LPA suggests the presence of abundant diglycosylated cyanidin compounds in litchi pericarp. Despite cyanidin-3-rutinoside has been reported as the most important pigment of litchi (variety Huaizhi) pericarp tissues,[Citation15] cyanidin-3-glucoside-5-rhamnoside (C3G5R) and malvidin-3-glucosidade were also detected in small amounts in a studied performed by Zhaoqi et al.,[Citation15] in Lichi chinensis Sonn.
Figure 1. High performance liquid chromatography (HPLC) analysis of main litchi pericarp anthocyanins at 520 nm (a) and ESI-MS (b), MS2 (c) information of compound 1.
Ultraviolet absorption spectroscopy of gliadins
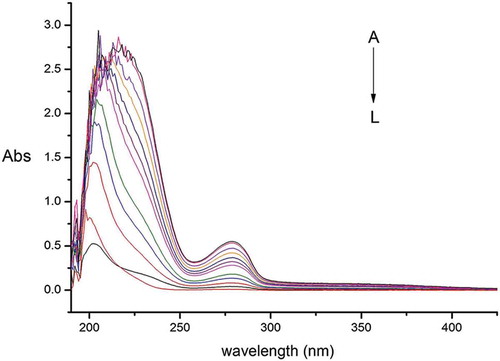
shows the UV absorption spectra of LPA, gliadins, and the LPA-gliadins mixtures, showing that gliadins have two absorption peaks at 209 and 278 nm. The appearance of a strong absorption peak near 210 nm is related to the secondary structure of α-helixes, while the weak and wide peak near 277 nm results from the absorption of tryptophan and tyrosine.[Citation29] also evidences that the absorption intensity and maximum absorption wavelength of the LPA-gliadins mixtures increased with the addition of LPA, indicating the formation of anthocyanin-protein complexes. These results are in agreement with the findings of Zuo et al.,[Citation30] who reported that the secondary structures of BSA changed by the addition of delphinidin-3-O-glucoside (D3G), causing a decrease of the α-helix content of BSA. Therefore, it was presumed that C3G5R, the main phenolic compound in LPA, can affect the secondary structure of gliadins. Moreover, the gradual increase of the absorption peak that appears at 277 nm may also arise from the flavan-3-ol unit of cyanidin.
Figure 2. Ultraviolet absorption spectra of litchi pericarp anthocyanins (LPA)-gliadins at different proportions: L, C — LPA concentration of 5 × 10⁻⁶ mol/L; K, C — gliadins concentration of 5 × 10⁻⁶ mol/L; J-A, LPA/gliadins ratio of 2, 4, 6, 8, 10, 12, 14, 16, 18, 20.
Fluorescence quenching study of gliadins interaction with anthocyanins
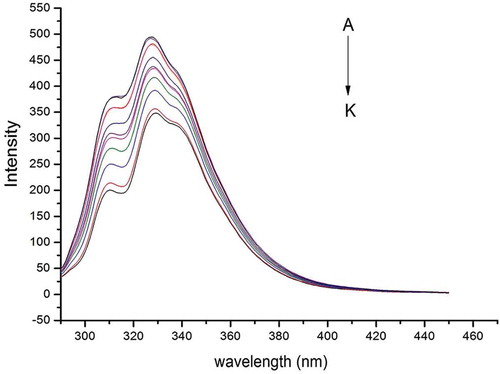
Proteins fluorescence is attributed to three intrinsic fluorophores present in proteins: tryptophan, tyrosine, and phenylalanine residues, in which tryptophan plays a major role in many proteins, since the quantum yield of phenylalanine residue is very low, and the fluorescence of the tyrosine residue is almost completely quenched when ionized or located close to an amino group, a carboxyl group, or a tryptophan residue.[Citation27,Citation31] However, there is no observation of fluorescence on natural anthocyanin compounds. shows that after excitation at 280 nm, the maximum emission wavelength of gliadins was recorded at 304 and 340 nm, which was attributed to the presence of tyrosine and tryptophan residues, respectively. The fluorescence intensity of tyrosine was not as strong as the one produced by tryptophan, making more observable the peak change at 340 nm. When increasing amounts of LPA solution were gradually added to the gliadins solution, the protein intrinsic fluorescence intensities decreased further, indicating that C3G5R interacted with the gliadins. In addition, the peak at 340 nm was lightly shifted to 338 nm, which is related with changes of the polarity environment around the chromophore molecule,[Citation32] which also implied changes in the hydrophobic properties in tryptophan domains. When the ∆ values between the excitation and emission wavelengths were set at 15 or 60 nm, the synchronous fluorescence could provide the characteristic information of tyrosine or tryptophan residues on the protein, respectively.[Citation33] By investigating the synchronous fluorescence spectra of tyrosine and tryptophan residues, the conformational changes in gliadins were explored.
Figure 3. Fluorescence emission spectra (λex = 280 nm) obtained in the presence of increasing concentrations of litchi pericarp anthocyanins (LPA) at temperature of 298 K in the presence of gliadins: A, C – gliadins concentration of 5 × 10⁻⁶ mol/L; for B-K the ratio LPA/gliadins was 2, 4, 6, 8, 10, 12, 14, 16, 18, 20.
The dynamic quenching is known to be controlled not only by temperature, but also by viscosity, or preferably by lifetime.[Citation34] Since a temperature increment is in favor of diffusion enhancement to magnify the dynamic quenching constant, a Stern–Volmer curve of gliadins fluorescence quenching at different temperatures (15°C, 25°C, and 35°C) was constructed to determine the main quenching type of the LPA (C3G5R) and gliadins. The results are shown in , indicating that the curve has a good linear relationship as described by Eq. (3). The quenching constants (Ksv) decreased with increasing temperature, which suggested that the stability of the complex becomes lower.[Citation6] Therefore, the type of fluorescence quenching of gliadins by C3G5R may be static rather than dynamic collision, forming a ground state complex between the fluorophore and the quencher. Moreover, the binding constant (KA) and the number of binding sites (n) indicated a strong combination of LPA and gliadins in a single site. The high linear correlation coefficient (R2) demonstrated that assumptions underlying the derivation of Eq. (3) were acceptable.
Table 1. Stern–Volmer quenching constants of litchi pericarp anthocyanins (LPA) —gliadins binding at different temperatures.
Bovine serum albumin (BSA) and human serum albumin (HSA) are proteins vastly used proteins as carriers for bioactive, small molecules on interaction studies of biomacromolecules and bioactive small molecules during transport in blood and subsequent absorption.[Citation35,Citation36] However, gliadins, which are classified according to their structure into a-, b-, c-, and x-type, are the predominant factor in gluten toxicity.[Citation37,Citation38] Investigation concerning the interaction mode of BSA and anthocyanin in different solutions (phosphate buffer (PBS), NaCl and PBS-NaCl) indicates changes in the mechanisms and in the functionality of bioactive small molecules and biomacromolecules.[Citation39] These findings are in close agreement with our results, which show that the value of the binding constant (KA) decreased as the temperature increased. Furthermore, Zhou et al.[Citation39] also showed that anthocyanins could interact with BSA through both tyrosine and tryptophan residues by hydrogen bonds and van der Waals forces, and the same binding mode was observed in deionized water and three buffer solutions. Moreover, the presence of hydroxyl substituents in the B ring of anthocyanins influenced the binding to HSA. At pH 4 and 5, wherein the hemiacetal form of anthocyanins is predominant, additional hydroxyl groups on the B-ring decreased the interaction with HSA, for instance, pelargonidin>cyanidin>delphinidin, showing that the number of –OH groups in the B-ring played an important role in the interaction of anthocyanins with proteins.[Citation6] If the binding of C3G with gliadins is compared to that of C3G5R (both possessing two –OH substituents in the B-ring), it is expectable that there may be no detected differences.
Thermodynamic study on the interaction of anthocyanins with gliadins
The binding forces of drugs with biological macromolecules include non-covalent bonds such as hydrogen bonds, Van der Waals forces, electrostatic attraction, and hydrophobic interactions.[Citation40] The thermodynamic constants (∆H, ∆S, and ∆G, Eq. (4)) can be calculated using the Van’t Hoff equation Eq. (5)) at different temperatures, as follows:
where K is the binding constant obtained from Eq. (3) at the corresponding temperature and R is the ideal gas constant. The free energy change (∆G) is calculated from the enthalpy change (∆H). The obtained results, according to Eq. (4) and (5), are shown in . It is usually considered that, when ∆H > 0, ∆S > 0, the main interaction force is the hydrophobic interaction; when ∆H < 0, ∆S > 0, it is the electrostatic attraction, and when ∆H < 0, ∆S < 0, hydrogen bonds and van der Waals forces are the main forces.[Citation41] As seen in , the values of ∆H and ∆S are negative, from which can be inferred that the main type of binding forces between C3G5G and gliadins are hydrogen bonds and van der Waals forces. ∆G < 0 indicates that the interaction of C3G5G with gliadins is spontaneous. Moreover, the ∆H of the binding process indicates it can be considered independent of temperature, since ΔH = −36.43 Kj/mol.
Table 2. Thermodynamic parameters for litchi pericarp anthocyanins (LPA)—gliadins binding at different temperatures.
Antioxidant capacity of LPA-gliadins complexes
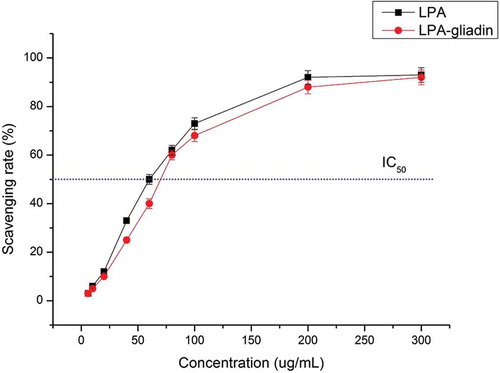
Previous studies have indicated that anthocyanins could be beneficial in scavenging free radicals and reducing lipid peroxidation of litchi fruit pericarp.[Citation11] The antioxidant capacity of LPA extracts before and after interaction with gliadins showed that LPA could strongly scavenge the DPPH radical (DPPH·) to a high extent, as well as when linked to gliadins (). There was a dose–effect relationship between the concentration of LPA and its scavenging rate on DPPH·, with a maximum scavenging rate at 93.6 ± 1.8% with no significant differences compared to wen linked to gliadins (p > 0.05). The IC50 values of LPA and LPA-gliadins were 60.7 ± 0.9 and 68.2 ± 0.6 µg/mL, respectively, indicating that the DPPH·scavenging activity of LPA was slightly weakened (p < 0.05) when linked to gliadins. Current knowledge suggests that factors such as protein binding may impair polyphenols absorption and bioavailability, and even mask their antioxidant activities.[Citation42,Citation43] However, in the present study, the antioxidant capacity of C3G5R was only slightly affected (p > 0.05) by the binding of gliadins. This might be caused by real amount of polyphenols and proteins combined in vitro with rhamnose present in C3G probably hindering hydrophobic interaction with proteins through the –OH.
Figure 4. DPPH scavenging rate of litchi pericarp anthocyanins (LPA) and LPA-gliadins (for LPA-gliadins the ratio of LPA/gliadins was 10).
Conclusion
Investigation concerning the interaction mode of gluten proteins (gliadins) and LPA allows increasing understanding of the interaction mechanisms and functional changes of bioactive small molecules and biomacromolecules. In this research, the interaction of LPA with BSA was studied by spectroscopic methods including ultraviolet and fluorescence spectroscopies. Diglycosylated cyanidin C3G5R, the main anthocyanin found in litchi pericarp, showed a strong combination with gliadins in a single site through hydrogen bonds and van der Waals forces, indicating a similar interaction as that of C3G and BSA. The comparison of antioxidant activities of C3G5R before and after interaction with gliadins suggested no significant differences (p < 0.05) on maximum scavenging effect on DPPH·, however, the antioxidant capacity of anthocyanin was slightly weakened because of the combination. Hence, this work allowed further understanding of the functional properties of anthocyanins and opens the possibility for its application in flour products.
Nomenclature
| ANOVA | = | Analysis of variance |
| BSA | = | Bovine serum albumin |
| C3G5R | = | Cyanidin-3-glucoside-5-rhamnoside |
| C3G | = | Cyanidin-3-glucoside equivalent |
| DAD | = | Diode array detector |
| DPPH | = | 2,2-diphenyl-1-picrylhydrazyl |
| D3G | = | Delphinidin-3-O-glucoside |
| ESI | = | Electrospray ionization interface |
| HAS | = | Human serum albumin |
| HPLC | = | High performance liquid chromatography |
| IC50 | = | Inhibition concentration at which concentration the radical is 50% scavenged |
| LPA | = | Litchi pericarp anthocyanin |
| MS | = | Mass spectrometry |
| PBS | = | Phosphate buffer saline |
| SD | = | Standard deviation |
| UV | = | Ultraviolet |
Additional information
Funding
Related Research Data
References
- Hagerman, A. E.; Butler, L. G. Protein Precipitation Method for the Quantitative Determination of Tannins. J. Agric. Food Chem. 1978, 26, 809–812.
- Rubino, M. I.; Arntfield, S. D.; Nadon, C. A.; Bernatsky, A. Phenolic Protein Interactions in Relation to the Gelation Properties of Canola Protein. Food Res. Int. 1996, 29, 653–659.
- Alu, M. H.; Rababah, T.; Ereifej, K.; Brewer, S.; Alli, I. Phenolic – Protein Interactions in Oilseed Protein Isolates. Food Res. Int. 2013, 52, 178–184.
- Alu’Datt, M. H.; Rababah, T.; Alli, I. Effect of Phenolic Compound Removal on Rheological, Thermal and Physico-Chemical Properties of Soybean and Flaxseed Proteins. Food Chem. 2014, 146, 608–613.
- Alu’datt, M. H.; Rababah, T.; Alhamad, M. N.; Gammoh, S.; Ereifej, K.; Alodat, M.; Hussein, N. M.; Kubow, S.; Torley, P. J. Antioxidant and Antihypertensive Properties of Phenolic-Protein Complexes in Extracted Protein Fractions from Nigella Damascena and Nigella Arvensis. Food Hydrocoll. 2016, 56, 84–92.
- Tang, L.; Zuo, H.; Shu, L. Comparison of the Interaction between Three Anthocyanins and Human Serum Albumins by Spectroscopy. J. Lumin. 2014, 153, 54–63.
- Umar, L. S.; Xia, W.; Phenolics, F. Pros and Cons: A Review. Food Rev. Int. 2005, 21, 367–388.
- Nichenametla, S. N.; Taruscio, T. G.; Barney, D. L.; Exon, J. H. A Review of the Effects and Mechanisms of Polyphenolics in Cancer. Crit. Rev. Food Sci. Nutr. 2006, 46, 161–183.
- Chou, T.; Kurin, E.; Mučaji, P.; Nagy, M.; Hidalgo, M.; Sánchez-Moreno, C.; Pascual-Teresa, S.; Iacopini, P.; Baldi, M.; Storchi, P.; Sebastiani, L.; Chou, T.; Wang, S.; Wang, D.; Liu, Z. Flavonoid–Flavonoid Interaction and Its Effect on Their Antioxidant Activity. J. Food Compos. Anal. 2010, 67, 621–681.
- Barba, F. J.; Esteve, M. J.; Tedeschi, P.; Brandolini, V.; Frígola, A. A Comparative Study of the Analysis of Antioxidant Activities of Liquid Foods Employing Spectrophotometric, Fluorometric, and Chemiluminescent Methods. Food Anal. Methods 2013, 6, 317–327.
- Duan, X.; Jiang, Y.; Su, X.; Zhang, Z.; Shi, J. Antioxidant Properties of Anthocyanins Extracted from Litchi (Litchi Chinenesis Sonn.) Fruit Pericarp Tissues in Relation to Their Role in the Pericarp Browning. Food Chem. 2007, 101, 1365–1371.
- Lee, H. S.; Wicker, L. Quantitative Changes in Anthocyanin Pigments of Lychee Fruit during Refrigerated Storage. Food Chem. 1991, 40, 263–270.
- Zhang, D.; Quantick, P. C.; Grigor, J. M. Changes in Phenolic Compounds in Litchi (Litchi Chinensis Sonn.) Fruit during Postharvest Storage. Postharvest Biol. Technol. 2000, 19, 165–172.
- Sarni-Manchado, P.; Le Roux, E.; Le Guernevé, C.; Lozano, Y.; Cheynier, V. Phenolic Composition of Litchi Fruit Pericarp. J. Agric. Food Chem. 2000, 48, 5995–6002.
- Zhang, Z.; Xuequn, P.; Yang, C.; Ji, Z.; Jiang, Y. Purification and Structural Analysis of Anthocyanins from Litchi Pericarp. Food Chem. 2004, 84, 601–604.
- Cabrita, L.; Fossen, T.; Andersen, M. Colour and Stability of the Six Common Anthocyanidin 3-Glucosides in Aqueous Solutions. Food Chem. 2000, 68, 101–107.
- Putnik, P.; Kovačević, D. B.; Penić, M.; Fegeš, M.; Dragović-Uzelac, V. Microwave-Assisted Extraction (MAE) of Dalmatian Sage Leaves for the Optimal Yield of Polyphenols, HPLC-DAD Identification and Quantification. Food Anal. Methods 2016, 9, 2385–2394.
- Putnik, P. Influence of Acidity and Extraction Time on the Recovery of Flavonoids from Grape Skin Pomace Optimized by Response Surface Methodology. Chem. Biochem. Eng. Quart. J. 2017, 30, 455–464.
- Putnik, P.; Bursać, K. D.; Dragović-Uzelac, V. Optimizing Acidity and Extraction Time for Polyphenolic Recovery and Antioxidant Capacity in Grape Pomace Skin Extracts with Response Surface Methodology Approach. J. Food Process. Preserv. 2016, 40, 1256–1263.
- Ekici, L.; Simsek, Z.; Ozturk, I. Effects of Temperature, Time, and pH on the Stability of Anthocyanin Extracts: Prediction of Total Anthocyanin Content Using Nonlinear Models. Food Anal. Methods 2013, 7, 1328–1336.
- Tatham, A. S.; Shewry, P. R. The S-Poor Prolamins of Wheat, Barley and Rye: Revisited. J. Cereal Sci. 2012, 55, 79–99.
- Mazzaracchio, P.; Tozzi, S.; Boga, C.; Forlani, L.; Pifferi, P. G.; Barbiroli, G. Interaction between Gliadins and Anthocyan Derivatives. Food Chem. 2011, 129, 1100–1107.
- Booth, M. R.; Ewart, J. A. Studies on Four Components of Wheat Gliadins. Biochim. Biophys. Acta 1968, 181, 226–233.
- Scalbert, A. Quantitative Methods for the Estimation of Tannins in Plant Tissues. In Plant Polyphenols: Synthesis, Properties, Significance; Hemingway, R. W.; Laks, Eds.; Springer: US, 1992; pp. 259–280.
- Lee, J.; Durst, R. W.; Wrolstad, R. E. Determination of Total Monomeric Anthocyanin Pigment Content of Fruit Juices, Beverages, Natural Colorants, and Wines by the pH Differential Method: Collaborative Study. J. AOAC Int. 2005, 88, 1269–1278.
- Zhu, Z.; Guan, Q.; Koubaa, M.; Barba, F. J.; Roohinejad, S.; Cravotto, G.; Yang, X.; Li, S.; He, J. HPLC-DAD-ESI-MS2 Analytical Profile of Extracts Obtained from Purple Sweet Potato after Green Ultrasound-Assisted Extraction. Food Chem. 2017, 215, 391–400.
- Wu, Q.; Li, S.; Fu, X.; Yang, T.; Chen, H.; Guan, Y.; Xie, B.; Sun, Z. Spectroscopic Studies on Binding of Lotus Seedpod Oligomeric Procyanidins to Bovine Serum Albumin. J. Appl. Spectrosc. 2014, 80, 884–892.
- Ningappa, M. B.; Dinesha, R.; Srinivas, L. Antioxidant and Free Radical Scavenging Activities of Polyphenol-Enriched Curry Leaf (Murraya Koenigii L.) Extracts. Food Chem. 2008, 106, 720–728.
- Qiang, L. M.; Lü, M. X.; Dong, X. R.; Cao, S. X.; Lu, K.; Zhao, Y. F. Comparison of Non-Covalent Interactions between a Series of N -Phosphoryl Dipeptide or Methyl Esters and Protein by Electrospray Ionization Mass Spectrometry. Int. J. Pept. Res. Ther. 2011, 17, 61–67.
- Zuo, H.; Tang, L.; Li, S.; Huang, J. Combined Multispectroscopic and Molecular Docking Investigation on the Interaction between delphinidin-3-O-glucoside and Bovine Serum Albumin. Luminescence 2015, 30, 110–117.
- Cao, W. G.; Jiao, Q. C.; Fu, Y.; Chen, L.; Liu, Q. Mechanism of the Interaction between Bromophenol Blue and Bovine Serum Albumin. Spectrosc. Lett. 2003, 36, 197–209.
- Chen, J.; Jiang, X. Y.; Chen, X. Q.; Chen, Y. Effect of Temperature on the metronidazole–BSA Interaction: Multi-Spectroscopic Method. J. Mol. Struct. 2008, 876, 121–126.
- Zhang, Q.; Ni, Y.; Kokot, S. Binding Interaction of Dopamine with Bovine Serum Albumin: A Biochemical Study. Spectrosc. Lett. 2012, 45, 85–92.
- Yuan, T.; Weljie, A. M.; Vogel, H. J. Tryptophan Fluorescence Quenching by Methionine and Selenomethionine Residues of Calmodulin: Orientation of Peptide and Protein Binding. Biochemistry 1998, 37, 3187–3195.
- Cahyana, Y.; Gordon, M. H. Interaction of Anthocyanins with Human Serum Albumin: Influence of pH and Chemical Structure on Binding. Food Chem. 2013, 141, 2278–2285.
- Zhang, Y.; Yue, X.; Kim, B.; Yao, S.; Bondar, M. V. Bovine Serum Albumin Nanoparticles with Fluorogenic Near-IR- Emitting Squaraine Dyes. ACS Appl. Mater. Interfaces 2013, 5, 8710.
- Wieser, H. Chemistry of Gluten Proteins. Food Microbiol. 2007, 24, 115–119.
- Kim, C. Y.; Quarsten, H.; Bergseng, E.; Khosla, C.; Sollid, L. M. Structural Basis for HLA-DQ2-mediated Presentation of Gluten Epitopes in Celiac Disease. Proc. Natl. Acad. Sci. 2004, 101, 4175–4179.
- Zhou, R.; Dong, X.; Song, L.; Jing, H. Interaction Mode and Nanoparticle Formation of Bovine Serum Albumin and Anthocyanin in Three Buffer Solutions. J. Lumin. 2014, 155, 244–250.
- Rawel, H. M.; Meidtner, K.; Kroll, J. Binding of Selected Phenolic Compounds to Proteins. J. Agric. Food Chem. 2005, 53, 4228–4235.
- Ross, P. D.; Subramanian, S. Thermodynamics of Protein Association Reactions: Forces Contributing to Stability. Biochemistry 1981, 20, 3096–3102.
- Riedl, K. M.; Hagerman, A. E. Tannin-Protein Complexes as Radical Scavengers and Radical Sinks. J. Agric. Food Chem. 2001, 49, 4917–4923.
- Arts, M. J. T. J.; Haenen, G. R. M. M.; Wilms, L. C.; Beetstra, S. A. J. N.; Heijnen, C. G. M.; Voss, H. P.; Bast, A. Interactions between Flavonoids and Proteins: Effect on the Total Antioxidant Capacity. J. Agric. Food Chem. 2002, 50, 1184–1187.