
ABSTRACT
To establish a universal analytical tool that could be used as a bioactive quality determination procedure on medicinal plant extracts, a range of spectrophotometric assays, HPLC, near infrared reflectance spectroscopy and chemometric analysis were employed for determination of the bioactive quality of 16 widely spread medicinal plants. Macro-constituents (total carbohydrates, soluble polysaccharides, proteins, amino acids) and secondary plant metabolites (total phenols, flavonoids, hydroxycinnamic acids, flavons, and flavonols) were determined, and HPLC method for the simultaneous determination of phenolic acids and flavonoids was developed, and its linearity, limits of detection and quantification, precision, and accuracy were validated. The evaluated medicinal plant extracts were characterised by a marked protein (marigold – 4.22 g/kg dw), amino acid (marigold – 61.14 g/kg dw), and carbohydrate content (dandelion – 113.5 g/kg dw), while Lamiaceae plants were distinguished as the predominant sources of polyphenolic bioactives (<2.26 g GAE/L). The developed HPLC method enabled separation of 24 polyphenolic compounds within a short analysis time (30 min) and revealed rosmarinic and chicoric acids as the prevalent polyphenolic constituents. NIR spectroscopy coupled with chemometric analysis of all determined analytical parameters indicated the suitability of NIR analysis for amino acids, carbohydrates, and polyphenols determination in medicinal plant extracts.
Introduction
Owing to the growing number of research studies acknowledging the health benefits of different medicinal plants within the last two decades, their use and consumption are rapidly increasing.[Citation1] Especially, the interest of food and pharmaceutical domains has increased for exploitation of medicinal plants and spices as the sources of bioactive functional ingredients aimed to their further implementation in novel, added value products. For that purpose, it is imperative to identify the constituents within plant substrates that confer bioactive properties. The herbal medicine industry is evolving its own rigid quality control systems; however, currently, the quality of medicinal herb preparations is defined based on: i) authentication of the starting whole plant material by classical taxonomy, ii) phytochemical profiling (finger-printing) of herbal extracts/preparation by chromatographic techniques, and iii) quantitative assay of either one or a few phytochemical ‘marker(s)/active(s) and their ratios.[Citation2] Most countries have developed regulations for controlling the quality of herbal remedies destined for the internal market or for export, but the quality requisites of different national pharmacopoeias vary between countries. Therefore, a universal and reliable analytical tool is required in order to obtain accurate and sufficiently ample results in the analysis of phytochemical composition of plant substrates.
Generally, only one or two markers of pharmacologically active compounds are used to evaluate the quality and authenticity of single herb or preparation. This type of determination does not give a complete overview of herbal products because multiple ingredients work synergistically and are usually responsible for their therapeutic effects. Therefore, various analytical techniques must be applied to obtain fingerprints of herbal medicines.[Citation3] However, numerous advanced techniques of qualitative and quantitative analyses of bioactive compounds described in the literature may not always be suitable for implementation in other laboratories. Moreover, the majority analytical techniques require time-demanding and complicated sample preparation or analysis procedures that very often cannot be reproduced by large number of scientists and laboratories worldwide. Chromatography is the most often used analytical technique on account of its great efficiency in separating different components of an extract.[Citation4,Citation5] However, it is suggested that with the help of spectroscopic and spectrophotometric fingerprints, the authentication and identification of herbal medicines would be more appropriate. This would allow consideration of multiple ingredients in the extracts of herbal medicines rather than one or two marker ingredients for evaluating the quality of herbal products.
Determination of polyphenolic compounds, as one of the most highly valuable group of bioactive compounds, can be considered as the primary step in estimation of the pharmacological activity of medicinal plants.[Citation6] Although there have been different approaches for the analysis of polyphenolic compounds, the separation and quantification of phenolic compounds remains difficult, especially the simultaneous determination of different groups of phenolics in a sole analysis. Up to this point, there have been numerous research studies published on the development of versatile HPLC-DAD methods for the analysis of polyphenolic compounds from medicinal plants. Usually, these methods allow separation of specific subgroups of polyhenols, most often phenolic acids,[Citation7–Citation11] derived from a limited number of plant substrates. Moreover, the vast abundance of scientific data on the bioactive, especially polyphenolic fingerprints of different medicinal plants often require difficult and time-demanding pursuits, since individual scientific papers most often present the profile of only one or several botanically related plants. This imposes a need for systematised data and the ability to find polyphenolic fingerprints of a larger number of medicinal plants in one study. Development of a unique HPLC-DAD method, coupled with the results of quantitative, spectrophotometric assays of other potentially pharmacologically active constituents and qualitative near infrared reflectance spectroscopy (NIR), could provide rapid and reliable analytical tool for setting up a platform for the analysis of bioactive quality of medicinal plants and spices, but potentially also any other plant material. NIR has proven to be a successful analytical method that does not require pre-treatment of samples and is used for analysis of a variety of food products and beverages.[Citation12,Citation13] However, this technique has so far not been used for bioactive quality evaluation of medicinal plant extracts.
Therefore, the present study proposed the application of i) spectrophotometric, ii) HPLC-DAD, and iii) NIR spectroscopy, combined by a iv) chemometric data analysis as a tool for bioactive quality control of medicinal plant extracts. For that purpose, screening of 16 medicinal plant extracts was conducted with the quantitative estimation of the macroconstituent contents (proteins, amino acids, carbohydrates, soluble polysaccharides) and bioactive compounds (total polyphenols, hydroxycinnamic acids, and flavonoids) and qualitative profiling of NIR spectra to deduce whether the obtained data can be related with the results obtained by the HPLC method. Results obtained from the spectrophotometric and HPLC-DAD methods were correlated with NIR spectra of medicinal plant extracts by means of principal component analysis (PCA) and partial least square regression (PLSR) to establish significant correlations and reveal whether the proposed analytical tools enable a successful and accurate bioactive quality assessment of medicinal plants extracts.
Materials and methods
Chemicals and reagents
All chemicals used for the experimental procedures were of analytical grade. All external polyphenol standards were purchased from Sigma-Aldrich (USA) as follows: gallic acid, protocatehuic acid, p-hydroxybenzoic acid, caftaric acid, 5-O-caffeoylquinic acid (chlorogenic acid), caffeic acid, vanillic acid, ferulic acid, p-coumaric acid, chicoric acid, syringic acid, rosmarinic acid, ellagic acid and trans-cinnamic acid, luteolin-7-O-glucoside, apigenin-7-O-glucoside, quercetin-3-O-rutinoside (rutin), quercetin-3-O-glucoside, kaempferol-3-glucoside, myricetin, quercetin, luteolin, kaempferol and apigenin. The purity of the standards was higher than 98%. The standard stock solutions were prepared by dissolving the standards (1 mg each) in 70% aqueous methanol (V = 10 mL). Lower concentrations for the calibration were prepared by dilution of the stock solutions with 70% aqueous methanol.
Plant material
Medicinal plants originating from the northeastern (Žumberak, Croatia) and coastal regions (Dalmatia) of Croatia were collected in 2015 and dried and supplied by Suban (Strmec Samoborski, Croatia). Sixteen different plant species were evaluated: lemon balm (Melissa Officinalis L.), peppermint (Mentha piperita L.), sage (Salvia officinalis L.), lavender (Lavandula angustifolia L.), thyme (Thymus vulgaris L.), rosemary (Rosmarinus officinalis L.), dandelion (Taraxacum officinale L.), marigold (Calendula officinalis L.), chamomille (Matricaria recutita), yarrow (Achillea millefolium), St. John’s wort, linden (Tilia cordata), olive leaf (Olea europaea L.), horsetail (Equisetum arvense), nettle (Urtica dioica), plantain (Plantago lanceolata). The homogeneity of samples was ensured by the proper sampling from a large quantity of plant material (1 kg bags of dried plant for each species) that was used for the experimental part.
Preparation of medicinal plant extracts
To simulate the household preparation conditions, simple, conventional aqueous extraction of medicinal plants was conducted. The extraction was carried out by pouring 100 mL of distilled water heated to 80°C over 2 g of ground tea. The extraction was carried out on a magnetic stirrer operating at 250 rpm, 80°C, and 60 min, after which the obtained extract was filtered through a tea strainer and filled up to 100 mL.
Spectrophotometric determinations
The total carbohydrate and polysaccharide contents of plant extracts were determined by the phenol-sulfuric acid method, using glucose as the standard.[Citation14] The total carbohydrate content was determined from the original extracts, while the precipitate formed after ethanol precipitation of extracts represented the soluble polysaccharides content. The protein content was measured according to the Bradford method, using bovine serum albumin (BSA) as the standard.[Citation15] For the determination of amino acids, the ninhydrin assay method was used as described by,[Citation16] established for determination of these compounds in black tea samples. The amino acid concentration of the samples was determined from the calibration curve of glutamic acid according to its absorbance at 570 nm.
Total phenol content (TPC) of medicinal plant extracts was determined by the Folin-Ciocalteu spectrophotometric assay, according to a modified method of Lachman et al.[Citation17] All determinations were carried out in triplicates, and the results were expressed as mg gallic acid equivalents (GAE)/L. The total hydroxycinnamic acid content was determined using the Arnow reagent, according to the method previously described in the European Pharmacopoeia[Citation18] for Fraxini folium, with some modifications. The results were expressed as mg caffeic acid equivalents (CAE)/L of sample using the calibration curve of caffeic acid (within the concentration range of 0–200 mg/L). The total flavone and flavonol contents of medicinal plant extracts were determined according to a modified method of Chang et al.[Citation19] established for determination of these compounds in honey and propolis samples. The method is based on aluminium chloride complex formation, since aluminium chloride forms acid stable complexes with the C-4 keto group and either the C-3 or the C-5 hydroxyl group of flavones and flavonols.[Citation20] The results were expressed as mg quercetin equivalents/L, using the standard curve of quercetin (within a concentration range of 0–200 mg/L). The antioxidant capacity was determined by using the spectrophotometric ABTS radical scavenging assay.[Citation21] The results were analysed statistically using the Statistica 7.0 software to determine the average value and standard error. Variance analysis, with a significance level of α = 0.05%, was performed to determine the differences between the bioactives content of the whole data set. Correlation analysis (correlation coefficient r determination) was also run with the same statistical package.
HPLC–DAD analysis
The HPLC analysis was conducted using an Agilent 1100/1200 Series HPLC device (Agilent, Santa Clara, USA) and a Photodiode Array Detector (Agilent, Santa Clara, USA) with a reversed-phase column ACE C-18 column (Agilent, Santa Clara, USA) (250 × 4.6 mm, 5 µm i.d.). Temperature of the column was controlled at 25°C, while the injection volume was V = 10 µL. For the HPLC analysis, all samples were filtered through a 0.45 µm filter (Nylon Membranes, Supelco, Bellefonte, USA) before injection. The solvents consisted of 0.1% o-phosphoric acid in water (solvent A) and 0.1% o-phosphoric acid in methanol (solvent B) at a flow rate of q = 1 mL/min. The elution was performed with a gradient starting at 10% B, reaching 100% B in 30 min. UV detection and chromatograms were recorded at 278 and 320 nm. Prior to each run, the HPLC-DAD system was allowed to warm, and the baseline was monitored until it was stable before sample analysis. Peak identification was achieved by comparison of both the retention time and UV absorption spectrum with those obtained with standards.
Validation parameters
Linearity, limits of detection, and quantification: The linearity of the detector response for the prepared standards was assessed by means of linear regression regarding the amounts of each standard, and the area of the corresponding peak on the chromatogram. Limits of detection and quantification were determined by calculation of the signal-to-noise ratio. Signal-to-noise ratios of approximately 3:1 and 10:1 were used for estimating the detection limit and quantification limit, respectively, of the method.
Precision: The repeatability of the injection integration was determined for the standard phenolics by injection of the standard solutions containing reference compounds for 10 times, and the R.S.D. was calculated for the integration area.
Accuracy: The accuracy of the method was determined by analysing the percentage of recovery of the main constituents in selected medicinal plant extracts. The prepared extracts were spiked with three different amounts of standard compounds and analysed under the previously established HPLC analysis conditions. The obtained average contents of the target compounds were used as the ‘real values’ to calculate the spike recoveries.
NIR measurements
The NIR spectra (range extends from 904 nm to 1699 nm) of medicinal plant extracts were collected with the setup for NIRS studies that included: a laptop, NIR-128–1.7-USB/6.25/50μm scanning monochromator from Control Development, Inc., provided with Spec32 software, the polychromatic source of light, optical cables, and tray for cuvette. The two cables served to provide incident light and to collect the light reflected by the product being tested. Complete NIR instrument setup has been previously described in details by Bicanic et al.[Citation22] Medicinal plant extracts (1 mL) were dispensed in quartz cuvette, and three consecutive runs for every extract were initially recorded across the entire spectral range at 1 nm intervals. Then, the arithmetic averages of three measurements were computed, and the data obtained were used to perform Principal Component Analysis (PCA) by means of statistical software STATISTICA v. 10 (StatSoft Inc., USA). No mechanical or chemical treatment of the samples was needed prior to NIRS measurements.
Chemometric analysis
Principal Components Analysis (PCA) was used for identifying patterns in data and displaying the data in order to highlight similarities and differences. Its goal is to extract the important information from the data table and to express this information as a set of new orthogonal variables called principal components or factors. PCA also represents the pattern of similarity of the observations and the variables by displaying them as points in maps.[Citation23,Citation24] Pre-processed spectra were used to perform principal component analysis (PCA) by means of statistical software StatSoft STATISTICA v. 10 and were plotted in 3D using Wolfram Mathematica v10 (Wolfram Research, USA).
Partial least squares regression (PLSR), which is a technique that generalises and combines features from principal component analysis and multiple regression, was used to predict and analyse a set of dependent variables from a set of independent variables or predictors. This prediction is achieved by extracting a set of orthogonal factors called latent variables which have the best predictive power from the predictors. PLS regression is particularly useful when prediction of a set of dependent variables from a (very) large set of independent variables (i.e., predictors) is needed.[Citation25] Calibration and validation were conducted for medicinal plant extracts spectra, by dividing the data set into calibration and validation sets. All samples were chosen by the pattern of two of every four samples for the external validation set, and the remaining samples were used as the calibration set. Pre-processing was conducted on the calibration set. As the first group of scatter-corrective pre-processing method, the Standard Normal Variate (SNV) was used followed by the Savitzky-Golay (SG) polynomial derivative Filter.[Citation26] For the PLSR Unscrambler software X 10.4. trial version (CAMO software, Norway) was used. PLSR model performance was assessed for each dataset and compared based on the correlation coefficient (R2) for predicted vs. measured compositions, root mean square errors of calibration and validation RMSEC and RMSEV, which were based on calculated root mean squared error (RMSE) (Eq. 1), and ratio of performance to deviation RPD (Eq. 2)
where n denotes the number of spectra, ci represents the measured value of observed compound concentration, is the predicted value of observed compound concentration and SD is the standard deviation, while RMSEC, RMSEV, and RMSEP differ in determination of the concentration estimates
(calibration, validation, and prediction datasets).
RMSEP presents the best estimate of the future performance of a calibration model. The concentration estimates, , in the RMSEP are determined by applying the calibration model to a subset of data that was not employed in determining the model parameters. The RMSEP may be calculated for a validation set in order to determine the optimal number of factors in a model or to a test set in order to test the performance of the optimal model on future data. RMSEC is a measure of how well the calibration model fits the calibration set.[Citation27]
The RPD is defined as the ratio of the standard deviation of the validation set samples divided by the RMSEP. Errors were calculated for both calibration and validation set, and the RPD for the validation set, using the corresponding datasets of training data and test data. According to AACC International Approved Methods 39-00.01, RPD ≥ 2.5 is suitable for screening in breeding programmes, RPD ≥ 5 is acceptable for quality control, and RPD ≥ 8 is good for process control, development, and applied research.[Citation28]
Results and discussion
Spectrophotometric determinations of proteins, amino acids, carbohydrates, polysaccharides, and polyphenolic compounds
The results belonging to the preliminary spectrophotometric assays for the screening of plant species based on their quantitative content of basic macroconstituents (proteins, amino acids, polysaccharides and carbohydrates) and bioactive polyphenolic compounds are displayed in . Determination of macroconstituents of medicinal plants, such as proteins, total carbohydrates, and polysaccharides, is important for the regular quality control of those herbs and herbal products.[Citation29,Citation30] However, the significance of those compounds in the bioactive quality analysis of their extracts should be taken into account, since the contribution of macroconstituents and polyphenolic compounds has a marked influence on the overall biological activity of the extracts. For example, it is well established that certain amino acids and polysaccharides exert antioxidant capacity,[Citation31] while polyphenolic compounds may undergo various interactions and form protein-polyphenol and polyphenol-polysaccharide complexes.[Citation32,Citation33] Therefore, apart from the basic analysis of the proximate composition of plant material (proteins, fat, carbohydrates, ash, water), the exact composition of the extracts also needs to be determined, which in combination with other analytical techniques and a thorough statistical analysis can provide a fast and reliable analytical tool for the potential scale-up application of the extracts.
Table 1. Spectrophotometrically determined contents of proteins, aminoacids, carbohydrates and soluble polysaccharides as well as total polyphenols, hydroxycinnamic acids, flavons and flavonols and ABTS radical scavenging antioxidant capacity of medicinal plant extracts.
Among the 16 evaluated medicinal plant species, water extracts of plants deriving from the Lamiaceae family were characterised by a predominantly high content of proteins (2.5–4.9 g/kg), in comparison to other plant species. Marigold extract also exhibited a significantly higher protein content (4.2 g/kg), which may be related to the highest amino acids content (61.14 g/kg) determined in this sample. Although in certain plant extracts (marigold, nettle, peppermint) high contents of amino acids corresponded to the highest content of proteins, some discrepancies were also observed, indicating on the specificity of each plant species composition. The observed results, however, indicate that the Bradford and ninhydrin assays can be employed successfully for the routine analysis of medicinal plant extracts, when dealing with quality and bioactive properties prospecting of medicinal plants. The main function of amino acids involves roles in protein biosynthesis and the body`s metabolic processes. Amino acids content therefore presents an important parameter not only from the nutritive, dietary aspect but also for the pharmacological value of medicinal plants and their products.[Citation34] The majority of national normative documentation currently does not have standardised the amino acids content; however, if evaluated, the contents of those compounds may point to a good source of amino acids in a certain food product or widely applicable water extracts of medicinal plants.
With regard to carbohydrate content, peppermint and dandelion were distinguished by the most abundant content of total carbohydrates, with up to 113.67 g/kg of those compounds present in the water extracts. No correlation (r = 0.301) between the total carbohydrates and soluble polysaccharides was established for the 16 evaluated medicinal plants. The highest contents of soluble polysaccharides, amounting to 16.87 g/kg, were determined in marigold and chamomile extracts. The content of soluble polysaccharides in the analysis of biological activity of medicinal plants and their extracts may be of marked importance, since in recent years, bioactive polysaccharides isolated from natural sources have attracted much attention in the field of biochemistry and pharmacology. They exhibit various biological activities affected by different chemical structures, among which anticarcinogenic and inhibitory effects on various tumour cells are the most well known.[Citation35]
With regard to bioactive, polyphenolic compounds, peppermint exhibits the highest TPC, amounting up to almost 1.9 g/L of aqueous extract, followed by an insignificantly lower content of TPC in lemon balm (1.7 g/L). Generally, all plants from the Lamiaceae family comprised markedly higher TPC content, with only dandelion and olive leaf from the other plant species generating similar TPC values, while the other plant species afforded significantly lower contents of total phenolics. Since the predominant group of polyphenols in herbs and spices are phenolic acids and flavonoids (mainly the flavone and flavonol subgroups), spectrophotometric assays for determination of those compounds were conducted in order to include those parameters as the bioactive indicators in the quality control of medicinal plants. Among the subgroup of phenolic acids, hydroxycinnamic acids represent the major part of that polyphenolic class, and therefore their content was determined using the Arnow reagent, which allows to exert the content of HcA in caffeic acid equivalents. Likewise, a method evaluating the contents of flavons and flavonols spectrophotometrically was also applied, to provide a measure that could indicate the abundance of these compounds in the evaluated plant extracts. The employed spectrophotometric method for determination of flavons and flavonols has been originally developed and applied for the analysis of propolis and honey samples. However, in the present study, it was employed to evaluate whether a reliable information on the flavons and flavonols contents can be obtained from the plant extracts. As can be seen, the contents of both polyphenolic subgroups, HcA and flavons and flavonols, differ among the sample set, which is evidenced by a low correlation observed between these parameters (r = 0.447). However, the results can provide an insight in the relative abundance of both HcA and flavons and flavonols since the distribution of each of these subgroups through the specific plant species is obtained. Based on these results, peppermint is again characterised by the highest content of both HcA (up to 2.4 g CAE/L) and flavons and flavonols (254 mg QE/L) in comparison to other plant species. With regard to HcA, apart from peppermint, lemon balm, dandelion, and rosemary also exhibit a markedly high content of these compounds. Generally, as in the case of total phenols, HcA is the most abundant in the plant species deriving from the Lamiaceae family, while the other plant species afford lower HcA contents. Similar trend of total phenols and HcA rankings were also confirmed by a high correlation established between those bioactive parameters (r = 0.885). In case of flavons and flavonols, the contents of those compounds exhibited a different ranking, depending on the plant species. Peppermint again exhibited the highest content of these compounds, followed by sage, dandelion and chamomille. A lower correlation established between the total phenols and flavons and flavonols (r = 0.538) implies that chemically diverse subgroups of polyphenolics constitute the total phenols, to which flavons and flavonols contribute in a minor portion.
The antioxidant capacity of screened plant species indicate a similar ranking as in the case of TPC (r = 0.849), and a good correlation with HcA content (r = 0.785); however, no obvious relation with flavons and flavonols (r = 0.281) indicates that this subgroup of polyphenols contributes less to the antioxidant properties of plant species. This reveals the marked influence of structure-activity relationship of polyphenolics, since it is well known that the antioxidant capacity of these compounds depends in a higher extent on their chemical structure than their overall content.[Citation36,Citation37]
Chromatographic determination of polyphenolic compounds
Preliminary experiments were performed to develop a fast method that will allow to obtain the best peak resolution and separation of diverse compounds belonging to the polyphenolic group. By adapting techniques previously found in scientific literature sources,[Citation38–Citation43] a method was developed using both a mixture of representative standards and several real samples (plant extracts). The developed HPLC method allowed the separation of 24 major polyphenolic compounds. Optimisation of the simultaneous chromatographic method enabled an efficient separation of 3 hydroxybenzoic acids, 11 hydroxycinnamic acids, and 10 free or glycosilated flavonoids from the standard mixture.
The HPLC method was validated by defining the linearity, limits of quantification, and detection of all 24 polyphenolic compounds, while for polyphenolics represented in the highest content in evaluated plants also, the parameters of precision and accuracy were assessed for the developed method. For qualitative purposes, the method was evaluated by taking into account the precision in the retention time, which was highly repeatable with RSD values lower than or equal to 1% for the evaluated standards.
Linearity, limit of detection (LOD), limit of quantification (LOQ), accuracy, and precision were evaluated for quantitative purposes ( and ).
Table 2. Regression curves, linearity, limit of quantification (LOQ), and limits of detection (LOD) of polyphenolic compounds.
Table 3. Accuracy and precisions of five polyphenolic markers determined by HPLC-UV.
As shown in , standard curves of each polyphenolic compound showed high linearity in the determined concentration range with high correlation coefficient (r2 = 0.9999). The LOD and LOQ values ranged from 0.31 to 3.98 µg/mL, and from 1.05 to 13.24 µg/mL, respectively, indicating high capability and appropriateness of the method for the quantification of each phenolic compound investigated. Generally, no specific trend or irregularities in the LOD and LOQ of each polyphenolic compound were observed, that is, it could not be established that each subgroup of polyphenolics (hydroxybenzoic acids, hydroxycinnamic acids, and flavonoids) exhibits lower or higher LOD and LOQ. The highest LOD and LOQ, significantly higher than all other evaluated polyphenolics, were determined for ellagic acid.
The accuracy was evaluated from the recovery of phenolic compounds available in the plant extract and from the spiked plant extracts (). The high accuracy values (all > 96%) and a high repeatability indicated a satisfactory accuracy of the proposed method. Likewise, the accuracy was independent of both the type of polyphenolic compound (its chemical structure) and concentration. As indicated previously, precision of the injection integration exhibited RSD values lower than 1 for the examined standards ().
Quantitative analysis of medicinal plant extracts
Applicability of the method was tested by screening 16 different medicinal plant species, and the obtained results are presented in . Both the qualitative and the quantitative phenolic profiles were different in each plant species studied. Phenolic acids constituted quantitatively the prevalent compounds, in comparison to flavonoid compounds, confirming that phenolic acids are the main bioactive constituents of these medicinal plants. The diversity of polyphenolic compounds was confirmed, since several phenolic acids were determined in only one plant species. Therefore, it can be regarded that the content of those compounds (chicoric acid in dandelion,[Citation44,Citation45] p-hydroxybenzoic acid in peppermint, ferulic acid in yarrow, and ellagic acid in horsetail) specific for just one plant species represents a biomarker of a certain plant species.
Table 4. The HPLC profile of phenolic acids and flavonoids (mg/L) in different medicinal plant species extracts.
It was found that rosmarinic acid was quantitatively the most abundant polyphenolic compound, with up to ~670 mg/L in lemon balm and peppermint extracts. Among hydroxycinnamic acids, rosmarinic acid, an ester of caffeic acid, is one of the most abundant phenolic acids occurring in plants, especially in Lamiaceae species, so it is often used as chemotaxonomic marker of that plant family.[Citation46] Among hydroxybenzoic acids, gallic acid (up to 5.76 mg/L) and protocatehuic acid (up to 36.75 mg/L) were identified only in chamomille and linden extracts, while protocatehuic acid was additionally identified in dandelion and p-hydroxybenzoic acid in peppermint extracts. High content of p-hydroxybenzoic acid and the absence of p-coumaric and trans-ferulic acids in peppermint extract is in accordance with the results of Zgórka and Glowniak[Citation47] and Generalić-Mekinić et al.[Citation48]
Apart from rosmarinic acid, high contents of chicoric acid (292.85 mg/L) in dandelion and chlorogenic acid in lavender and chamomille (<204 mg/L) also denoted that plant species as highly valuable sources of polyphenolics. Lamiaceae species exhibited the highest content of total flavones and flavonols (339.20 mg/L in rosemary and 271 mg/L in sage extract). Because of natural diversity of polyphenolic compounds and their derivatives in plant derived substrates, the lack of appropriate standards for all those compounds disabled the exact quantification of total polyphenolics by liquid chromatography. To closely establish the amounts of hydroxycinnamic acids and flavons and flavonoids, as the representative polyphenolic of medicinal plants, the authors quantified all of the hydroxycinnamic acids as the sum of their derivatives by using the calibration curve of chlorogenic acid and expressing the results as corresponding derivatives. This approach enabled to determine very high contents of remaining non-identified HCA derivatives in plantain (391.39 mg/L) and chamomille (376.02 mg/L). Likewise, high contents of luteolin-7-glucoside (230.66 mg/L) and quercetin derivatives (196.82 mg/L) were determined in sage and rosemary extracts, respectively.
By summarising all of the identified polyphenolic compounds, the results reveal rosemary and lemon balm extracts as the most abundant ones with polyphenolic compounds, with almost up to 1 g/L of these compounds determined by the developed HPLC method. Apart from the Lamiaceae plants distinguished by the highest polyphenolic content, chamomille extract from the Asteraceae family was likewise characterised by a very high and diverse content of polyphenolics as well as plantain extract among other plant species. The obtained results confirm how diverse and botanically distinct substrates can be successfully analysed by applying the developed method, with a considerably shortened time of analysis and a small amount of modifier required in the mobile phase. The present method offers considerable advantages, particularly in laboratories that process large number of samples as a part of routine measurements. As evidenced by the data, the present procedure offers a wide range of application in phenolic acid analysis commonly used in various disciplines. The specificity, precision, and reproducibility obtained using the present approach gave results comparable or better to more complex, more laborious, and time-consuming procedures.
Chemometric analysis of NIR spectroscopy data
Near-infrared reflectance spectroscopy has the advantage of being economically affordable, efficient, safe, and environment friendly. It can be used for the simultaneous determination of several traits with a single measurement as well as for rapid screening in quality detection systems.[Citation49] In the present study, NIR spectroscopy was used to detect which of the observed bioactive compounds (proteins, amino acids, carbohydrates, polysaccharides, total phenols, hydroxycinnamic acids, flavons and flavonols, antioxidant capacity, sum of hydroxycinnamic acids and flavonoids determined by the developed HPLC analysis) in medicinal plant extracts could be validated in the range of 904–1699 nm. In this range, the sample absorbs the light with frequencies matching characteristic vibrations, including those generated from C-H, O-H, N–H, C=O, and other functional groups can be detected.[Citation50] Principal Components Analysis (PCA) for the whole NIR spectra (904–1699 nm) was used to identify the patterns in the data set and highlight similarities and differences. Results of cluster analysis (PCA) in the plane of first three principal components are presented in .
Figure 1. Principal component analysis of pre-procesed spectra for 15 different medicinal plant extracts (three measurements per extract and mean value) presented by first three factors for whole spectra range (904–1699 nm).
The first principal component (PCA 1) accounted for 98.6% of the total explained variance for the separation, while the second (PCA 2) (1.3%) and third (PC3) (0.2%) showed minor contribution to variations. The key factor for such high total variance in PCA 1 is most likely attributed to the carbohydrates content, which is later going to be confirmed by the highest calibration and prediction models obtained for carbohydrates using the Partial least squares regression (PLSR) (). Nowadays, NIRS-chemometrics have proven their effectiveness for both qualitative and quantitative carbohydrate analysis, and their use in carbohydrate determination in a variety of raw materials has been well described.[Citation51] Each group of medicinal plant extracts was tightly clustered and well segregated with exception of dandelion samples which were slightly dispersed but still showed good clustering. Significant dispersion of dandelion was may be due to the abundance of all determined compounds in that plant species, which was characterised by the highest carbohydrates content and also a very high protein, amino acids, and total polyphenols content, indicating that the PCA analysis enabled to distinguish this sample from others according to its bioactive quality.
Table 5. Calibration and validation set results of PLS models obtained from NIR spectra (raw) for the contents of all determined bioactive compounds.
Coordinates of cases from one factor, which captures most of the variance, can be used for correlation with obtained result of, for example, concentrations. Arithmetic averages of three NIR measurements for each medicinal plant extract were computed, and the obtained data was used to perform another PCA analysis. The coordinates of the most significant factor (PCA 1) were then correlated with all above-stated spectrophotometrically and HPLC-determined compounds (their concentrations) presented in and . The best results were obtained for the correlation of first factor and amino acid concentrations for 14 medicinal plant extracts (with the exception of peppermint and dandelion, which were characterised by a high carbohydrate content that interfered in the amino acids analysis and was therefore not included in the further chemometric analysis) with correlation coefficient r2 = 0.87. Those results indicate that amino acids contribute to the spectroscopic characteristics of analysed plant extracts in the NIR region and can imply that amino acids presence may also be easily determined using this technique. Previous studies have revealed that amino acids content can be predicted using NIR spectroscopy in different food raw materials, especially grains such as ground wheat and barley,[Citation52] milled rice,[Citation3,Citation53] or soybeans.[Citation54] Although the application of NIR spectroscopy for analysis of polyphenolic compounds in different food products has also been reported,[Citation7,Citation53,Citation55] in the present paper, the NIR response revealed to be more related to amino acids, rather than polyphenolics, thus revealing the applicability of NIR spectroscopy for a rapid qualitative analysis of amino acids in medicinal plant extracts.
Partial least squares regression (PLSR) was applied for further analysis of the relationships between the NIR spectra and the observed contents of macromolecules and bioactives in medicinal plant extracts. The spectral range of the NIR instrument used (904–1699 nm), allowed observing vibrations generated from C–H, O–H, and other functional groups. The absorption band at 900–950 nm includes C–H stretch third overtone including relation to either the C–H3 stretch third overtone or with compounds containing C–H aromatic groups. The absorption band at 1100 nm is related to the O–H second overtone of water as well as to related R–OH, while the C–H3 stretch first overtone or with compounds containing C–H aromatic groups band is related to the absorption at 1650–1699 nm.[Citation49] Based on the NIR spectra, all of the medicinal plant extracts evaluated in the present study contained the above stated groups, so the chemometric modelling of the whole data set served as a tool to examine the possibility of predicting the content of certain components on the basis of the NIR spectrum.
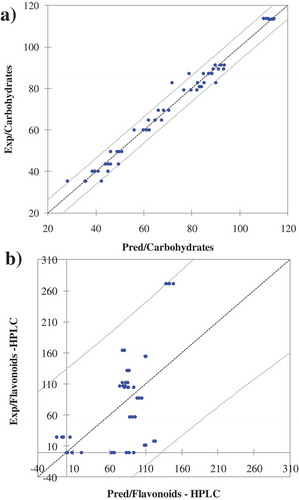
For the PLSR, the collected NIR spectra chattering noise was subtracted after background correction, and spectra were smoothed by use of Unscrambler Software, revealing the spectra from 905 to 1030 nm and from 1342 to 1698 nm. PLSR models were used on the pre-treated spectra with smoothing points of 4 to calculate the first derivatives of the spectra. The data matrix used for modelling consisted of 60 rows (4 spectra for each plant) and 796 columns (NIR spectra wavelengths). For each medicinal plant extract, a set of 2 spectra was chosen to serve as a training dataset (32 spectra in total), and another 2 spectra were selected to form testing dataset (32 spectra in total). Indicators for excellent prediction models are suggested to be values of r2 greater than 0.95 and RPD values greater than 6.5.[Citation56,Citation57] All models generated in the present study are presented in , and examples for best (carbohydrate, R2 = 0.91 and RPD = 6.2) and the poorest (flavonoids, R2 = 0.3 and RPD = 2.4) predictions are presented in . Highly acceptable models have lower RMSE values, r2 > 0.8 and RPD greater than 3, where excellent models have high r2 value (>0.9) and the RPD over 5.[Citation56–Citation58] As indicated previously, the AACC International Approved Methods 39–00.01 states the use of RPD as a criteria/indicator of the model prediction assessments where the extent of RPD ≥ 2.5 suggests the model is suitable for screening in breeding programmes, RPD ≥ 5 is acceptable for quality control, and RPD ≥ 8 is good for process control, development, and applied research.[Citation28] In the present study, the results revealed that from 10 observed parameters, 7 of them could be very well predicted based on the NIR spectra. The best validation was achieved for carbohydrate content (RPD = 6.2), followed by proteins (r2 = 0.87 and RPD = 5.2) and five parameters with the RPD over 4 (total phenols, antioxidant capacity, HCA-HPLC, amino acids and polysaccharides). The RPD obtained for the 7 out of 10 observed parameters shows that it would be possible to use NIR spectroscopy for their screening and for two of them (proteins and carbohydrates) even for quality control.
Figure 2. Predicted vs. experimental data (CI 95%) for the parameters with the a) best (carbohydrates content) and the b) poorest (flavonoids content) correlation with the NIR spectra.
Conclusions
In the present study, the applicability of a range of spectrophotometric assays for determination of macroconstituents and polyphenolic bioactives of medicinal plant extracts was confirmed with the aim of establishing a universal tool for bioactive quality evaluation of medicinal plant extracts and their preparations. HPLC method, developed to simultaneously separate and quantify specific polyphenolic compounds from plant extracts, enabled the separation of 24 polyphenolic compounds, in a short analysis time of 30 min, which allowed to reveal specific polyphenolic compounds characteristic for just one plant species. The present study serves as an assembly of information on macroconstituent and polyphenolic content and fingerprints of 16 widely spread medicinal plants. The applicability of NIR spectroscopy for the analysis of medicinal plant extracts was confirmed and in combination with chemometric analyses revealed as a suitable technique for detection and prediction of amino acids, carbohydrates, and total polyphenols content of medicinal plants.
Acknowledgements
This study is a contribution to the project ‘Application of microreactors in the analysis of antioxidant activity of medicinal plants (MICRO-AA)’, project number HR.3.2.01-0069, which is funded by the European Social Fund (ESF) through the Human Resources Development programme.
References
- Tapsell, L. C.; Hemphill, I.; Cobiac, L.; Sullivan, D. R.; Fenech, M.; Patch, C. S.; Roodenrys, S.; Keogh, J. B.; Clifton, P. M.; Williams, P. G.; Fazio, V. A.; Inge, K. E. Health Benefits of Herbs and Spices: The Past, the Present, the Future. The Medicinal Journal of Australia 2006, 185, S1–S24.
- Nutraingredients. Chemometrics, the Benchmark for Quality Control of Herbal Extracts. http://www.nutraingredients.com/Product-innovations/Chemometrics-The-Benchmark-for-Quality-Control-of-Herbal-Extracts Retrieved July 6th, 2016.
- Liang, Y.; Peishan, X.; Chan, K. Quality Control of Herbal Medicines. Journal of Chromatography B 2004, 812, 53–70.
- Escarpa, A.; González, M. C. Approach to the Content of Total Extractable Phenolic Compounds from Different Food Samples by Comparison of Chromatographic and Spectrophotometric Methods. Analytica Chimica Acta 2001, 427, 119–127.
- Tsao, R.; Yang, R. Optimization of a New Mobile Phase to Know the Complex and Real Polyphenolic Composition: Towards a Total Phenolic Index Using High-Performance Liquid Chromatography. Journal of Chromatography A 2003, 1018, 29–40.
- Rodriguez, M. V.; Martínez, M. L.; Cortadi, A.; Campagna, M. N.; Di Sapio, O.; Derita, M.; Zacchino, S.; Gattuso, M. Quality Control of Herbal Medicines with Spectrophotometry and Chemometric Techniques – Application to Baccharis L. Species Belonging to Sect –Caulopterae DC. (Asteraceae). In Macro To Nano Spectroscopy;; Uddin, J.; Eds.; In Tech Open: Rijeka, Croatia, 2012; 399–420.
- Li, W.; Qu, H. Rapid Quantification of Phenolic Acids in Radix Salvia Miltiorrhiza Extract Solutions by FT-NIR Spectroscopy in Transflective Mode. Journal of Pharmaceutical and Biomedical Analysis 2010, 52, 425–431.
- Olkowski, A. A.; Amarowicz, R.; Yu., P.; McKinnon, J. J.; Maenz, D. D. A Rapid HPLC Method for Determination of Major Phenolic Acids in Plant Material. Polish Journal of Food and Nutrition Sciences 2003, 12, 53–57.
- Parejo, I.; Viladomat, F.; Bastida, J.; Codina, C. Development and Validation of a High-Performance Liquid Chromatographic Method for the Analysis of Antioxidative Phenolic Compounds in Fennel Using a Narrow Bore Reversed Phase C18 Column. Analytica Chimica Acta 2004, 512, 271–280.
- Liaudanskas, M.; Viškelis, P.; Jakštas, V.; Raudonis, R.; Kviklys, D.; Milašius, A.; Janulis, V. Application of an Optimized HPLC Method for the Detection of Various Phenolic Compounds in Apples from Lithuanian Cultivars. Journal of Chemistry 2014, 10 pages, Article ID 542121. doi:10.1155/2014/542121.
- Vagiri, M.; Ekholm, A.; Andersson, S. C.; Johansson, E.; Rumpunen, K. An Optimized Method for Analysis of Phenolic Compounds in Buds, Leaves, and Fruits of Black Currant (Ribes Nigrum L.). Journal of Agricultural and Food Chemistry 2012, 60, 10501–10510.
- Nicolaï, B. M.; Beullens, K.; Bobelyn, E.; Peirs, A.; Saeys, W.; Theron, K. I.; Lammertyn, J. Nondestructive Measurement of Fruit and Vegetable Quality by Means of NIR Spectroscopy: A Review. Postharvest Biology and Technology 2007, 46, 99–118.
- Sirisomboon, P.; Tanaka, M.; Fujita, S.; Kojima, T. Evaluation of Pectin Constituents of Japanese Pear by near Infrared Spectroscopy. Journal of Food Engineering 2007, 78, 701–707.
- Laurentin, A.; Edwards, C. A. A Microtiter Modification of the Anthrone-Sulfuric Acid Colorimetric Assay for Glucose-Based Carbohydrates. Analytical Biochemistry 2003, 315, 143–145.
- Bradford, M. M. A Rapid and Sensitive Method for the Quantitation of Microgram Quantities of Protein Utilizing the Principle of Protein–Dye Binding. Analytical Biochemistry 1976, 72, 248–254.
- Wang, Q.; Peng, C.; Gong, J. Effects of Enzymatic Action on the Formation of Theabrownin during Solid State Fermentation of Pu-Erh Tea. Journal of the Science of Food and Agriculture 2011, 91, 2412–2418.
- Lachman, J.; Hosnedl, V.; Pivec, V.; Orsák, M. Polyphenols in Cereals and Their Positive and Negative Role in Human and Animal Nutrition. In: Proceedings of Conference Cereals for Human Health and Preventive Nutrition; Vaculová, K., Ehrenbergerová, J.; Eds.; Agricultural Research Institute Kromeriz, Ltd.: Brno, Czech Republic, 1998; 118–125.
- European Pharmacopoeia. Fraxini Folium. European Pharmacopoeia, 4th ed.; EDQM: Strasbourg, France, 2002; 1342.
- Chang, C.; Yang, M.; Wen, H.; Chern, J. Estimation of Total Flavonoid Content in Propolis by Two Complementary Colorimetric Methods. Journal of Food and Drug Analysis 2002, 10, 178–182.
- Harnly, J. M.; Doherty, R. F.; Beecher, G. R.; Holden, J. M.; Haytowitz, D. B.; Bhagwat, S.; Gebhardt, S. Flavonoid Content of U.S. Fruits, Vegetables, and Nuts. Journal of Agricultural and Food Chemistry 2006, 54, 54–76.
- Re, R.; Pellegrini, N.; Proteggente, A.; Pannala, A.; Yang, M.; Rice-Evans, C. Antioxidant Activity Applying an Improved ABTS Radical Cation Decolorisation Assay. Free Radical Biology and Medicine 1999, 26, 1231–1237.
- Bicanic, D.; Streza, M.; Dόka, O.; Valinger, D.; Luterotti, S.; Zs., A.; Kurtanjek, Z.; Dadarlat, D. Non-Destructive Measurement of Total Carotenoid Content in Processed Tomato Products: Infrared Lock-In Thermography, Near-Infrared Spectroscopy/Chemometrics, and Condensed Phase Laser-Based Photoacoustics—Pilot Study. International Journal of Thermophysics 2015, 36, 2380–2388.
- Jolliffe, I. T. Principal Component Analysis; Springer-Verlag: New York, USA, 2002.
- Saporta, G.; Niang, N. Principal Component Analysis: Application to Statistical Process Control. In Data Analysis; Govaert, G.; Eds.; ISTE: London, UK, 2010; 1–23.
- Abdi, H. PLS-Regression; Multivariate Analysis. In Encyclopedia for Research Methods for the Social Sciences;; Lewis-Beck, M., Bryman, A., Futing, T.; Eds.; SAGE publications: Thousand Oaks, CA, USA, 2003; 792–795.
- Rinnan, A.; Van Den Berg, F.; Balling Engelsen, S. Review of the Most Common Pre-Processing Techniques for Near-Infrared Spectra. Trends in Analytical Chemistry 2009, 28, 1201–1222.
- Burns, D. A.; Ciurczak, E. W. Handbook of Near-Infrared Analysis, 3rd edn.; CRC press, Taylor and Francis group: Boca Raton, Florida, 2008; 207–231.
- AACC International. Approved Methods of Analysis, Method 39-00.01. Near-Infrared Methods—Guidelines for Model Development and Maintenance. Approved November 3, 11th Edn.; AACC International: St. Paul, MN, 1999. doi:10.1094/AACCIntMethod-39-00.01.
- Qureshi, M. N.; Stecher, G.; Bonn, G. K. Matrix Free Material Enhanced Laser Desorption Ionization Mass Spectrometric Analysis of Amino Acids in Althaea Officinalis, Matricaria Chamomilla and Taraxacum Officinale. Analytical Letters 2013, 46, 29–34.
- Qureshi, M. N.; Stecher, G.; Sultana, T.; Abel, G.; Popp, M.; Bonn, G. K. Determination of Carbohydrates in Medicinal Plants-Comparison between TLC, MF-MELDI-MS and GC-MS. Phytochemical Analysis 2011, 22, 296–302.
- Damgaard, T.; Lametsch, R.; Otte, J. Antioxidant Capacity of Hydrolyzed Animal By-Products and Relation to Amino Acid Composition and Peptide Size Distribution. Journal of Food Science and Technology 2015, 52, 6511–6519.
- Arts, M. J.; Haenen, G. R.; Voss, H. P.; Bast, A. Masking of Antioxidant Capacity by the Interaction of Flavonoids with Protein. Food and Chemical Toxicology 2001, 39, 787–791.
- Bandyopadhyay, P.; Ghosh, A. K.; Ghosh, C. Recent Developments on Polyphenol–Protein Interactions: Effects on Tea and Coffee Taste, Antioxidant Properties and the Digestive System. Food & Function 2012, 3, 592–605.
- Trineeva, O. V.; Safonova, E. F.; Sinkevich, A. V.; Slivkin, A. I. Assay of Amino Acids in Medicinal Plants by TLC (Using Stinging Nettle Leaves and Common Sea Buckthorn Fruits as Examples). Pharmaceutical Chemistry Journal 2015, 49, 323–328.
- Stimpel, M.; Proksch, A.; Wagner, H.; Lohman-Matthes, M. L. Macrophage Activation and Induction of Macrophage Cytotoxicity by Purified Polysaccharide Fractions from the Plant Echinacea Purpurea. Infection and Immunity 1984, 46, 845–849.
- Horžić, D.; Komes, D.; Belščak, A.; Kovačević Ganić, K.; Iveković, D.; Karlović, D. The Composition of Polyphenols and Methylxanthines in Teas and Herbal Infusions. Food Chemistry 2009, 115, 441–448.
- Guo, Q.; Zhao, B.; Shen, S.; Hou, J.; Hu, J.; Xin, W. ESR Study on the Structure– Antioxidant Activity Relationship of Tea Catechins and Their Epimers. Biochimica Et Biophysica Acta 1999, 1427, 13–23.
- Wellwood, C. R. L.; Cole, R. A. Relevance of Carnosic Acid Concentrations to the Selection of Rosemary, Rosmarinus Officinalis (L.), Accessions for Optimization of Antioxidant Yield. Journal of Agricultural and Food Chemistry 2004, 52, 6101–6107.
- Wang, H.; Provan, G. J.; Helliwell, K. Determination of Rosmarinic Acid and Caffeic Acid in Aromatic Herbs by HPLC. Food Chemistry 2004, 87, 307–311.
- Wen, D.; Li, C.; Di, H.; Liao, Y.; Liu, H. A Universal HPLC Method for the Determination of Phenolic Acids in Compound Herbal Medicines. Journal of Agricultural and Food Chemistry 2005, 53, 6624–6629.
- Fecka, I.; Turek, S. Determination of Polyphenolic Compounds in Commercial Herbal Drugs and Spices from Lamiaceae: Thyme, Wild Thyme and Sweet Marjoram by Chromatographic Techniques. Food Chemistry 2008, 108, 1039–1053.
- Durling, N. E.; Catchpole, O. J.; Grey, J. B.; Webby, R. F.; Mitchell, K. A.; Foo, L. Y.; Perry, N. B. Extraction of Phenolics and Essential Oil from Dried Sage (Salvia Officinalis) Using Ethanol–Water Mixtures. Food Chemistry 2007, 101, 1417–1424.
- Belščak-Cvitanović, A.; Komes, D.; Benković, M.; Karlović, S.; Hečimović, I.; Ježek, D.; Bauman, I. Innovative Formulations of Chocolates Enriched with Plant Polyphenols from Rubus Idaeus L. Leaves and Characterization of Their Physical, Bioactive and Sensory Properties. Food Research International 2012, 48, 820–830.
- Ivanov, G. I.; Content, P. Antioxidant Activities of Taraxacum Officinale F.H. Wigg (Dandelion) Leaves. International Journal of Pharmacognosy and Phytochemical Research 2014, 6, 889–893.
- Dias, M. I.; Barros, L.; Alves, R. C.; Oliveira, M. B. P. P.; Santos-Buelga, C.; Ferreira, I. C. F. R. Nutritional Composition, Antioxidant Activity and Phenolic Compounds of Wild Taraxacum Sect. Ruderalia. Food Research International 2014, 56, 266–271.
- Kivilompolo, M.; Hyötyläinen, T. Comprehensive Two-Dimensional Liquid Chromatography in Analysis of Lamiaceae Herbs: Characterisation and Quantification of Antioxidant Phenolic Acids. Journal of Chromatography A 2007, 1145, 115–164.
- Zgórka, G.; Glowniak, K. Variation of Free Phenolic Acids in Medicinal Plants Belonging to the Lamiaceae Family. Journal of Pharmaceutical and Biomedical Analysis 2001, 26, 79–87.
- Generalić Mekinić, I.; Skroza, D.; Ljubenkov, I.; Šimat, V.; Smole Možina, S.; Katalinić, V. In Vitro Antioxidant and Antibacterial Activity of Lamiaceae Phenolic Extracts: A Correlation Study. Food Technology and Biotechnology 2014, 52, 119–127.
- Zhang, B.; Rong, Z. Q.; Shi, Y.; Wub, J. G.; Shi, C. H. Prediction of the Amino Acid Composition in Brown Rice Using Different Sample Status by Near-Infrared Reflectance Spectroscopy. Food Chemistry 2011, 127, 275–281.
- The, C. D. Role of Visible and Infrared Spectroscopy Combined with Chemometrics to Measure Phenolic Compounds in Grape and Wine Samples. Molecules 2015, 20, 726–737.
- López, M. G.; Sarahí García-González, A.; Franco- Robles, E. Carbohydrate Analysis by NIRS-Chemometrics. In Chemistry » Analytical Chemistry » ”Developments in Near-Infrared Spectroscopy; Kyprianidis, K. G., Skvaril, J.; Ed.; InTech: Rijeka, Croatia, 2017; 81–95.
- Williams, P. C.; Preston, K. R.; Norris, K. H.; Starkey, P. M. Determination of Amino Acids in Wheat and Barley by Near-Infrared Reflectance Spectroscopy. Journal of Food Science 1984, 49, 17–20.
- Wu, D.; Chen, J.; Lu, B.; Xiong, L.; He, Y.; Zhang, Y. Application of near Infrared Spectroscopy for the Rapid Determination of Antioxidant Activity of Bamboo Leaf Extract. Food Chemistry 2012, 135, 2147–2156.
- Pazdernik, D. L.; Killam, A. S.; Orf, J. H. Analysis of Amino and Fatty Acid Composition in Soybean Seed, Using near Infrared Reflectance Spectroscopy. Agronomy Journal 1997, 89, 679–685.
- Shi, J. Y.; Zou, X. B.; Zhao, J. W.; Mel, H.; Wang, K. L.; Wang, X.; Chen, H. Determination of Total Flavonoids Content in Fresh Ginkgo Biloba Leaf with Different Colors Using near Infrared Spectroscopy. Spectrochimica Acta Part A. Molecular and Biomolecular Spectroscopy 2012, 94, 271–276.
- Ward, A.; Nielsen, A.; Møller, H. Rapid Assessment of Mineral Concentration in Meadow Grasses Sensors by near Infrared Reflectance Spectroscopy. Sensors 2011, 11, 4830–4839.
- Li-Chan, E.; Chalmers, J.; Griffiths, P. Applications of Vibrational Spectroscopy in Food Science, 1st ed.; John Wiley & Sons, Ltd: West Sussex, UK, 2011.
- Mangalvedhe, A. A.; Danao M-G., C.; Paulsmeyer, M.; Rausch, K. D.; Singh, V.; Juvik, J. A. Anthocyanin Determination in Different Hybrids Using near Infrared Spectroscopy. ASABE Annual International Meeting Paper 2015, 3–14.