
ABSTRACT
This work aimed to characterise and compare the volatile profiles of Oolong tea No. 12 obtained from eight provenances in Chiang Rai province of northern Thailand. Thirty-two samples were analysed using solid phase microextraction-gas chromatography-mass spectrometry (SPME-GC-MS). Sixty-seven volatile constituents were identified with their relative amounts. Principal Component Analysis (PCA) was used to compare profiles from all provenances and revealed three major clusters. The main volatile compounds responsible for the differentiation were linalool, geraniol, E-nerolidol, Z-jasmone, Z-methyl jasmonate, indole, and trans-linalool oxide. It appeared that the majority of the volatile compounds were significantly correlated with altitude. These resulting altitude-dependent profiles could be used as a means to improve or authenticate the products by local producers. This could be the first study to report the aromatic profiles from different Oolong teas planted and produced in northern Thailand.
Introduction
Tea (Camellia sinensis) belongs to the Theaceae family. It is a popular drink throughout the world due to its varied flavour as well as its pharmaceutical and mild stimulant properties.[Citation1–Citation3] Tea can be classified into the following three groups: green, oolong, and black teas, based on degree of fermentation. Green tea is unfermented, while oolong tea is semi-fermented, and black tea is fully fermented. The formation of key aromatic profiles may be related to these processes.[Citation4] Other factors contributing to aroma varieties of teas are species and cultivation, including origin and agricultural inputs.[Citation3]
Figure 3. PCA loadings plots revealed the compounds responsible for distinguishing Thai Oolong tea No. 12 samples.
Chiang Rai province, in northern Thailand, is an important area of the country for tea cultivation due to its climate and altitude. It is known nationwide for producing the most Oolong tea, especially from the No. 12 hybrid species. This tea, alongside other hybrids such as No. 17, 19, and 21, is planted extensively in Chiang Rai province. Oolong tea No. 12 has been successfully commercialised and made into popular beverages (with high rates of consumption) in Thailand. To determine the quality of Oolong teas produced in Chiang Rai province, the manufacturers rely on assessments from trained Taiwanese experts, which are time-consuming, expensive, and limited to a small number of tea samples per day.[Citation5] Thus, alternative tools for assessing or ensuring aroma quality should be employed. These tools or techniques must be fast, accurate, and more importantly, able to handle the complexity of key aromatic profiles of Oolong tea samples from different provenances .
Solid phase microextraction coupled with gas chromatography and mass spectrometry (SPME-GC-MS) has been successfully applied in the qualitative and quantitative analysis of volatiles in tea samples[Citation3,Citation6,Citation7] because it is quick, inexpensive, and does not require the use of solvents. The purpose of this study was to investigate the aromatic profiles of different Thai Oolong tea cultivars (hybrid No. 12), obtained from Chiang Rai province, using SPME-GC-MS analysis. It was hypothesised that the varying aroma compositions of Oolong tea No. 12 across the major Thai producers (as indicated by brands) could be observed and explained. The observed aromatic profile obtained from each producer may be used as reference information for ensuring product quality, therefore reducing the costs associated with expert testing. The differences in the resulting profiles will also help authenticate these products. The study results may lead to the effective selection of locations for Oolong tea plantations in Thailand, as well as the natural manipulation of their key aromatic volatiles.
Materials and methods
Tea samples
Eight provenances of Oolong tea No. 12, including sample No. 1 (N: 19.8582◦, E: 99.7400◦), sample No. 2 (N: 19.7858◦, E: 99.7006◦), sample No. 3 (N: 19.3600◦, E: 99.5087◦), sample No. 4 (N: 20.1984◦, E: 99.8160◦), sample No. 5 (N: 20.1649◦, E: 99.6183◦), sample No. 6 (N: 20.1591◦, E: 99.6172◦), sample No. 7 (N: 20.1984◦, E: 99.8160◦), and sample No. 8 (N: 19.8240◦, E: 99.5736◦), cultivated at different altitudes in Chiang Rai province, Thailand, were collected in October 2014. All samples were spherical with a diameter of 4 mm. They were purchased, packed in sealed aluminum foil bags, and stored in the dry place at room temperature until analysis. Three individual samples were obtained from each provenance.
Solid-phase microextraction (SPME) analysis
A 50/30 μm divinylbenzene-carboxen-polydimethylsiloxane (DVB/CAR/PDMS) fiber purchased from Supelco (Bellefonte, PA, U.S.A.) was chosen to extract the volatile components from all tea samples. For each extraction, the SPME fiber was preconditioned in the injection port of the Agilent 6890 gas chromatograph (Agilent Technologies, Inc., Palo Alto, CA, USA) at 220°C for one hour. One hundred grams of each dry Oolong tea No. 12 sample were mixed with 1 µL of toluene containing 2,6-dimethylpyridine at a concentration of 1,000 mg/L and placed in a 250-ml headspace vial. The sample bottle was preheated at 60°C for 30 min. The fiber was then exposed to the sample headspace for 30 minutes, prior to thermal desorption of the constituents at 250°C into the splitless injection port of the GC-MS for five minutes. SPME was performed in triplicate for each sample.
Gas chromatography-mass spectrometry (GC-MS) analysis
The volatile components of all Thai Oolong tea No. 12 samples were analysed using a Hewlett Packard model HP6890 gas chromatograph (Agilent Technologies) equipped with an HP model 5973 mass-selective detector. An HP-5MS (5% phenylpolymethylsiloxane) capillary column (30 m × 0.25 mm i.d., film thickness 0.25 μm; Agilent Technologies) was used in this study. The oven temperature was set to 60°C and then increased to 220°C at a rate of 3°C/min. The injector and detector temperatures were set to 250°C and 280°C, respectively. Purified helium (99.9%) was used as the carrier gas at a flow rate of 1 mL/min. Electron ionisation (EI) mass spectra were collected at 70 eV ionisation voltages over the range of m/z 29–300. The electron multiplier voltage was 1150 V. The ion source and quadrupole temperatures were set to 230°C and 150°C, respectively.
Identification of volatile components was performed by comparison of their Kovát retention indices, relative to C8-C17 n-alkanes, and comparison of the mass spectra of individual components with reference mass spectra in the Wiley 275, NIST05 databases, Adams,[Citation12] and literature data of volatile components in Oolong tea. The relative contents (amounts) of volatile compounds were calculated as ratios of their peak areas to the peak area of the internal standard (2,6-dimethylpyridine).
Intra-assay variation, for each detected volatile constituent, was calculated from the results obtained from a repeat analysis of one randomly chosen sample from each provenance. Inter-assay variation was assessed from all samples analysed from each provenance. The calculated values were expressed as % relative standard deviation (%RSD). Intra-assay variations ranged from 0.30 to 5.22, and inter-assay variations ranged from 1.64 to 10.98. All 32 samples were prepared and analysed over a period of one week. Run order was randomised to eliminate potential analytical-associated biases.
Calculation of flavour and terpene indices
The flavour index was obtained from a ratio of total % relative peak area of all terpenic compounds (group II) and total % relative peak area of non-terpenic compounds (group I) whereas terpene index was calculated as follows: terpene index = total % relative peak area of linalool and its derivatives/(total % relative peak area of linalool and its derivatives + total % relative peak area of geraniol and its derivatives). These results are demonstrated in .
Table 1. Volatile compounds of Oolong tea No. 12 cultivars produced in different areas in Chiang Rai province.
Statistical analysis
All statistical analyses were performed using Stata (IC 12.1) (StataCorp, College Station, Texas) and R statistical package (version 3.1.2) (http://www.r-project.org). For each observation, the missing values (results below the limit of quantification) were imputed with half of the average lowest relative amount obtained from all samples.
The PCA was performed in the log-transformed and non-log transformed datasets, with and without unit variance scaling, respectively. PCA was used to find relatively homogeneous clusters of observations based on measured characteristics. Loadings plots were also created to visualise the relationships among variables and would likely indicate discriminant variables.
A one-way analysis of variance (ANOVA) was used to compare volatile constituents between different groups of teas. A heatmap (with Pearson’s correlation coefficient values) was constructed to observe correlations among the detected constituents. In addition, a pairwise correlation (Pearson’s correlation test) between each volatile compound and altitude was tested.
Results and discussion
Volatile components of Thai Oolong tea No. 12 by SPME-GC-MS
Thai Oolong tea No. 12 samples planted at different locations were extracted by SPME and analysed for their key aroma volatile components. A 50/30 μm DVB/CAR/PDMS fiber was selected to extract the volatile compounds because of its multi-mode adsorption mechanism. This fiber is suitable with volatile and semi-volatile compounds containing carbon atoms ranging from three to 20. As indicated in the literature, the highest number of analytes was extracted using this fiber, in comparison to CAR/PDMS and DVB/PDMS fibers.[Citation7]
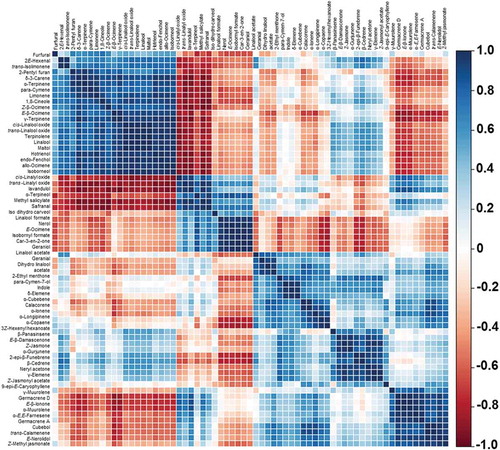
As seen in , a total of 67 odor volatile components were detected in these samples. No key odor volatile detected was specific to a single provenance . Several groups of compounds were well-correlated, especially those that belong to the same biosynthesis pathway. Examples of these compounds are linalool, its alkene precursor (limonene), and other structurally similar alcohols (cis and trans-linalool oxide). The heatmap of correlation matrix of the detected volatile compounds can be seen in . This matrix allowed the relationships between the detected volatile components to be assessed. Highly positively correlated volatiles were grouped in deep blue, and compounds in deep red showed negative or non-significant correlations. The results revealed a simple pattern of high positive correlations between ester compounds and their alcoholic precursor and between ester compounds and the other structurally similar esters. This indicated that the variations between provenances could be attributed to both the specific alcohol acyl transferase activity and the substrate availability.[Citation8] Strong negative correlations between aldehyde and ester components were also detected. This could be related to the alcohol dehydrogenase enzyme activity that is largely influenced by the production process of Oolong tea No. 12.
Figure 1. Heatmap of correlation matrix of the volatile compounds in Thai Oolong tea No. 12. The correlation coefficient of volatiles are colour coded from deep red (−1) to deep blue (1).
Dixon and Hammond[Citation9] reported that the odor characteristic of samples depended on the relative intensities of aroma compounds. Classes of volatile compounds detected in all Thai Oolong tea No. 12 samples obtained from different provenances were similar to those reported in a study by Wang, et al.,[Citation6] which used the same SPME technique. Nevertheless, other reports detected different compounds. These differences may be due to varying sample preparation and extraction techniques, as well as other variables.[Citation3,Citation8,Citation10] The results from this study were somewhat different from those published by Lin and co-workers.[Citation3] In their study, although oolong teas were analysed for their aromatic profiles, the samples derived from different species and provenances, which explain the resulting differences. Furthermore, they used the PDMS/DVB fiber which favors the extraction of hydrocarbons and terpenic compounds but not aldehydes and esters. Generally, the choice of SPME fiber plays a significant role in the extraction of key volatiles. Most key volatile compounds are physically trapped and their retention is influenced by the polarities of the SPME fiber composite. In this study, the DVB/CAR/PDMS fiber was chosen according to Du et al.[Citation11] In their study, a wider range of volatile compounds was detected when using DVB/CAR/PDMS in comparison to PDMS/DVB, although Pu-erh tea samples were studied.
PCA of Oolong tea No. 12 volatile components
PCA was performed on the obtained data matrix to characterise the relative profiles of Oolong tea No. 12 samples collected from eight different brands (). PCA results of untransformed (), unscaled data showed three different clusters (I, II, and III). Interestingly, PCA results of log transformed (), unit variance scaled data showed a slightly different pattern. In total, the results revealed four different clusters, which were mainly in agreement with the previous PCA results, except that the profile of sample No. 3 (cluster IV) was further away from sample No. 2 and sample No. 1 (cluster I). Cluster II and cluster III remained separated, although their axis locations have been changed.
Figure 2. PCA scores plots of all brands based on first and second principal components. Sample No. 1 (N: 19.8582◦, E: 99.7400◦), sample No. 2 (N: 19.7858◦, E: 99.7006◦), sample No. 3 (N: 19.3600◦, E: 99.5087◦), sample No. 4 (N: 20.1984◦, E: 99.8160◦), sample No. 5 (N: 20.1649◦, E: 99.6183◦), sample No. 6 (N: 20.1591◦, E: 99.6172◦), sample No. 7 (N: 20.1984◦, E: 99.8160◦), and sample No. 8 (N: 19.8240◦, E: 99.5736◦).
An additional cluster (cluster IV; sample No. 3) observed in the PCA results of , unit variance scaled data, was studied. The mean relative contents of the volatile constituents were inspected and compared against the mean values obtained from the other clusters (cluster I, II, and III). It was found that, although significantly different, the majority of the volatile constituents had similar patterns (in terms of numbers of detected volatile constituents and their relative amounts) to the samples from cluster I. In addition, their mean values were also much closer to the mean values of cluster I than those of clusters II and III (data not shown). These results suggested that samples No. 3 could be grouped into cluster I. As seen in , linalool, hotrienol, geraniol, E-nerolidol, Z-jasmone, Z-methyl jasmonate, indole, and trans-linalool oxide are considered to have the strongest discriminant properties because they were present in high amounts. However, based on the PCA results of log transformed, unit variance scaled data; other volatile compounds should also have discriminant properties.
Flavour and terpene indices
According to the complexity of volatile compounds detected in tea samples, aromatic quality in tea samples can be assessed using the Owuor flavour index.[Citation13] Generally, a better or preferable aroma quality is achieved with a high flavour index value. Thus, flavour index was investigated in these samples. To calculate the flavour index value, volatile components were separated into two groups. Group I samples were predominantly lipid degradation products such as C6 aldehyde, 2E-hexenal, and alcohols, contributing to a grassy smell and group II samples were mostly terpenic compounds and their derivatives, contributing to a sweet flowery aroma. The ratio between volatile group I and group II is reflective of flavour index. As can be seen in , the highest aroma quality was detected in samples in cluster III, followed by cluster I and cluster II, respectively.
In addition to the flavour index, terpene index values were also calculated. This index is a part of chemotaxonomic methods for classification of tea clones.[Citation14] These index values were obtained from calculating the ratios between relative areas of linalool to those of linalool and geraniol derivatives. The different terpene index values indicate different tea provenances. Similar terpene indices may reveal similar geographical characteristics – both cultivation and propagation route. Moreover, the terpene index is considered to be a reliable chemotaxonomic evaluation for differentiating clonal teas. It was demonstrated to be unique to certain clones, irrespective of variation in agronomic or manufacturing processes.6 For example, a terpene index of 1.0 was found in C. sinesis var. assamica while a terpene index of 0.1 was obtained from some C. sinesis var. sinesis.[Citation14]
According to our results, the terpene index values were similar for samples in clusters I and II. Samples in cluster III showed drastically different values. Generally, samples in cluster I and cluster II showed high terpene index values, which are associated with numerous aroma compounds, while the low terpene index values of samples in cluster III are associated with rosy, floral, and strong jasmine aromas from geraniol, E-Nerolidol, and Z-Jasmone, respectively. Although all tea provenances were from the same clones, some of them showed different terpene index values. Further study is needed to confirm our findings or to explain the underlying factors that may affect this terpene index.
Discrimination analysis of volatile components of Oolong tea No. 12 and the interpretation of the clustering phenomena
A discrimination analysis was performed, using ANOVA on the basis of the three-group clustering phenomenon. A pairwise ANOVA was performed for each compound. The average content of the individual identified volatiles of Oolong teas in all clusters (as seen in ) are listed in . Linalool, hotrienol, 2-pentyl furan, and γ-terpinene are primarily responsible for separating cluster I from the others, while furfural and 2E-hexenal, including calacorene and α-longipinene to a lesser extent, dominated in cluster II. Finally, in cluster III, the major discriminants included geraniol, E-nerolidol, and Z-jasmone, which were present in the greatest amounts. Detailed odor descriptions of these compounds are also provided in . In this study, only a few variables could be tested for their intrinsic, production-related, influences on the formation of key aromatic compounds. These variables included drying process and altitude. Other information associated with the production process was not available from the manufacturers. According to the 3-group clustering phenomenon, altitude stood out as a principle variable causing the division. It was found that each cluster was specific to a certain range of heights (measured in meters above mean sea level). Cluster I was specific to an altitude range of 400–700 m, cluster II was specific to an altitude range of 700–1,000 m, and cluster III was specific to an altitude range of 1,000–1,600 m. This suggested that, regardless of the production process of Oolong tea No. 12, the majority of the volatile compounds were naturally produced in an altitude-dependent manner. The drying process, the last step before packing, appeared to explain the separation of the No. 3 samples (cluster IV) from cluster I, as observed in the PCA scores of PC1 vs PC2 (). Although information on the drying process was not available from most producers, it is known that the No. 3 samples are dried by ancient charcoal stoves. This may influence the formation of some volatile compounds, resulting in high variation. Because the temperature in this method is not precisely controlled, it is possible that the yields would be different in each production batch. This production characteristic may be unique to the products of the No. 3 samples. The close relationship of the volatile profiles in the No. 7 and No. 8 samples could be attributed to similar cultivation temperatures. An average temperature of 15–20°C, with less diurnal temperature variation, was observed all year round at high altitudes. Shohael et al.[Citation15] reported that temperature caused significant variation in chemical composition. At high temperatures, as observed at lower altitudes, efficiency of antioxidant enzymes is reduced due to stress and temperature tolerance, causing large variation in aroma profiles.
Table 2. Relative content percentage and odor description of Oolong tea volatiles in different clusters.
Relationships between volatile compounds and altitude
Pairwise correlation tests between the relative contents of the compounds and altitude were performed (Pearson’s test). The cutoff for reporting the Pearson’s correlation coefficient value was set to ±0.8 (with a p-value less than 0.05), as it indicates a high degree of correlation. The volatile compounds that were most highly associated with altitude were: E-β-ocimene (r2 = 0.96), nerol (r2 = 0.95), trans-linalool oxide (r2 = 0.91), isoborneol (r2 = 0.88), E-nerolidol (r2 = 0.88), geraniol (r2 = 0.85), Z-jasmone (r2 = 0.85), indole (r2 = 0.85), α-damascenone (r2 = 0.84), and Z-methyl jasmonate (r2 = 0.81). Most of these volatiles provided a rose and jasmine floral odor. It is notable that, despite being negatively correlated with altitude, hotrienol had a peak at 547 m instead of 424 m. This might be attributed to the specific Oolong production process as observed in the No. 3 samples. The volatile compounds that were negatively, significantly correlated with altitude were: γ-terpinene (r2 = −0.89), linalool (r2 = −0.86), 2-pentyl furan (r2 = −0.85), hotrienol (r2 = −0.84), and δ-3-carene (r2 = −0.81). These compounds represented green and floral odors. These compounds have often been reported in previous studies.[Citation3,Citation6,Citation7] Although some compounds such as limonene, geranial, linalool acetate, dihydro linalool acetate, 3Z-hexenyl hexanoate, and α-muurolene were detected in relatively high quantities, their formation is independent of altitude. It is notable that some volatile compounds are highly specific to a certain altitude. They may not seem to correlate well with cultivating heights, but the formation of their amounts is also altitude dependent. For instance, furfural and 2E-hexenal were only detected in tea products obtained from an altitude range of 700–1,000 m. In addition, maltol, isoborneol, cis-linalyl oxide, trans-linalyl oxide, α-terpineol, nerol, and γ-elemene were not detected at all in the altitude range of 400–700 m. Conversely, furfural, 2E-hexenal, p-cymene, p-cymen-7-ol, α-ionene, 9-epi-E-caryophyllene, γ-muurolene, and germacrene D have not been reported in teas cultivated at 1000–1600 m.
Moreover, Owuor et al.[Citation20] reported that tea quality improved with planting at high altitudes where chemical composition was attributed to a slower growth rate as altitude increases. Tea growth rate is considered to have an influence on chemical compound variation and quality of tea.[Citation21] Mwakha[Citation22] and Obaga et al.[Citation23] also reported that shoot growth rate at high altitudes was slower than at low altitudes. A slower tea growth rate normally enhanced tea quality.[Citation24–Citation27] The amount of theaflavins in tea samples was enhanced by planting at higher altitudes, which may be correlated to favourable cold, humid conditions at higher altitudes for synthesis.[Citation28,Citation29] Therefore, the production of key volatile compounds detected at high altitudes in this study may have resulted from substrates and enzymes in biosynthesis pathways dependent on the humidity and temperature of the environment where the tea was grown. While the production process could play a key role in the formation or distribution of the volatile compounds in tea samples, planting altitude seems to strongly outweigh its contribution. In addition, if all the brands have a similar Oolong tea production process, the differences in the observed profiles is a result of other variables. In this case, it is likely to be planting altitude.
Conclusion
In summary, 67 highly volatile compounds of Oolong tea No. 12 grown at different altitudes in Thailand were identified by SPME-GC-MS. Cluster and correlation analyses indicated a strong relationships between relative amounts of some volatile compounds and cultivating altitude. This work may be used as a model to assess key volatile profiles and to authenticate the aroma quality of tea from different cultivars in Thailand. Gas chromatography-olfactory may also be used to confirm the aromatic profiles in tea samples.
Acknowledgments
The authors wish to thank Mae Fah Luang University for their assistance in obtaining Thai Oolong tea No. 12 samples, analytical and financial support.
Related Research Data
References
- Pekal, A.; Drozdz, P.; Pyrznska, K. Comparison of the Antioxidant Properties of Commonly Consumed Commercial Teas. Int. J. Food Prop. 2012, 15, 1101–1109.
- Ravichandran, R. Carotenoid Composition, Distribution and Degradation to Flavor Volatiles during Black Tea Manufacture and the Effect of Carotenoid Supplementation on Tea Quality and Aroma. Food Chem. 2002, 78, 23–28.
- Lin, J.; Zhang, P.; Pan, Z.; Xu, H.; Luo, Y.; Wang, X. Discrimination of Oolong Tea (Camellia Sinensis) Varieties Based on Feature Extraction and Selection from Aromatic Profiles Analysed by HS-SPME/GC–MS. Food Chem. 2013, 141, 259–265.
- Borse, B. B.; Mohan, J.; Rao, L.; Nagalakshmi, S.; Krishnamurthy, N. Fingerprint of Black Teas from India: Identification of the Regio-Specific Characteristics. Food Chem. 2002, 79, 419–424.
- Chen, Q. S.; Ouyang, Q.; Wang, Y.; Liu, A.; Li, H.; Zhao, J. Classification of Different Varieties of Oolong Tea Using Novel Artificial Sensing Tools and Data Fusion. LWT Food Sci. Technol. 2015, 60, 781–787.
- Wang, L.; Lee, J.; Chung, J.; Baik, J.; So, S.; Park, S. Discrimination of Teas with Different Degrees of Fermentation by SPME–GC Analysis of the Characteristic Volatile Flavor Compounds. Food Chem. 2008, 109, 196–206.
- Pripdeevech, P.; Moonggoot, S.; Popluechai, S.; Chukeatirote, E. Analysis of Volatile Constituents of Fermented Tea with Bacillus Subtilis by SPME-GC-MS. Chiang Mai J. Sci. 2014, 41, 395–402.
- González-Mas, M. C.; Rambla, J. L.; Alamar, M. C.; Gutiérrez, A.; Granell, A. Comparative Analysis of the Volatile Fraction of Fruit Juice from Different Citrus Species. PLoS ONE 2011, 6 (7), e22016.
- Dixon, M. D.; Hammond, E. G. The Flavor Intensity of Some Carbonyl Compounds Important in Oxidized Fats. J. Appl. Behav. Sci. 1984, 61, 1452–1456.
- Fanaro, G. B.; Duarte, R. C.; Santillo, A. G.; Pinto e Silva, M. E. M.; Purgatto, E.; Villavicencio, A. L. C. H. Evaluation of γ-radiation on Oolong Tea Odor Volatiles. Radiat. Phys. Chem. 2012, 81, 1152–1156.
- Du, L.; Li, J.; Li, W.; Li, Y.; Li, T.; Xiao, D. Characterization of Volatile Compounds of Pu-Erh Tea Using Solid-Phase Microextraction and Simultaneous Distillation–Extraction Coupled with Gas Chromatography–Mass Spectrometry. Food Res. Int. 2014, 57, 61–70.
- Adams, R. P. Identification of Essential Oil Components by Gas Chromatography/Mass Spectrometry, 4th; Allured publishing Corporation: Carol Stream, Illinois, USA, 2009.
- Owour, P. O.; Tsushida, T.; Harita, H.; Murai, T. Effect of Geographical Area of Production on the Composition of Volatile Flavor Compounds in Kenya Clonal Black CTC Teas. Exp. Agric. 1988, 24, 227–235.
- Takeo, T. Variation in the Aroma Compound Content of Semi-Feremented and Black Tea. Nihon Nogei Kagakkai Shi 1983c, 57, 457–459.
- Shohael, A. M.; Ali, M. A.; Yu, K.; Hahn, E.; Paek, K. Effect of Temperature on Secondary Metabolites Production and Antioxidantenzyme Activities in Eleutherococcus Senticosus Somatic Embryos. Plant Cell Tissue Organ Cult. 2006, 85, 219–228.
- Sawamura, M.; Tu, N. T. M.; Onishi, Y.; Ogawa, E. Characteristic Odor Components of Citrus Reticulata Blanco (Ponkan) Cold-Pressed Oil. Biosci. Biotechnol. Biochem. 2004, 68 (8), 1690–1697.
- Leffingwell, J. C.; Alford, E. D. Volatile Constituents of Perique Tobacco. J. Environ. Agric. Food Chem. 2005, 4 (2), 899–915.
- Burdock, G. A. Fenaroli’s Handbook of Flavor Ingredients; CRC Press: Boca Raton, Florida, USA, 2009.
- Pino, J. A.; Mesa, J.; Munoz, Y.; Marti, M. P.; Marbot, R. Volatile Components from Mango (Mangifera Indica L.) Cultivars. J. Agric. Food Chem. 2005, 53, 2213–2223.
- Owuor, P. O.; Obaga, S. O.; Othieno, C. O. The Effects of Altitude on the Chemical Composition of Black Tea. J. Sci. Food Agric. 1990, 50, 9–17.
- Mwakha, E. Tea Shoot Growth at Different Altitudes in Western Kenya. Tea 1985a, 6 (2), 19–24.
- Mwakha, E. Tea Shoot Growth in the Kenya Highlands. Tea 1985a, 6 (1), 5–13.
- Obaga, S. O.; Squire, G. R.; Langat, J. K. Altitude, Temperature, and Growth Rate of Tea Shoots. Tea 1988, 9 (1), 28–33.
- Owuor, P. O.; Horita, H.; Tsushida, T.; Murai, T. Comparison of the Chemical Composition of Black Teas from Main Tea Producing Parts of the World. Tea 1986a, 7 (2), 71–78.
- Owuor, P. O.; Obanda, A. M.; Tsushida, T.; Horita, H.; Murai, T. Geographical Variations of Theaflavins, Thearubigins and Caffeine in Kenya Clonal Black Teas. Food Chem. 1987a, 26, 223–230.
- Owuor, P. O.; Tsushida, T.; Horita, H.; Murai, T. Effects of Geographical Area of Production on the Composition of the Volatile Flavour Compounds in Kenyan Clonal Black CTC Teas. Exp. Agric. 1988, 24, 221–235.
- Owuor, P. O.; Othieno, C. O.; Howard, G. E.; Robinson, J. M.; Cooke, R. D. Studies on the Use of Shade in Tea Plantations in Kenya. Effects on Chemical Composition and Quality of CTC Black Tea. J. Sci. Food Agric. 1989a, 46, 63–70.
- Hilton, P. J.; Ellis, R. T. Estimation of the Market Value of Central Africa Tea by Theaflavins Analysis. J. Sci. Food Agric. 1972, 23, 227–232.
- Muthumania, T.; Verma, D. P.; Venkatesan, S.; Kumar, R. S. S. Influence of Altitude of Planting on Quality of South Indian Black Teas. J. Nat. Prod. Plant Resour. 2013, 3 (1), 18–23.