
ABSTRACT
The phenolics content and antioxidant activity of walnut (Juglans sigillata Dode) green husks were analysed during different stages of development. Contents of total phenolics and total flavonoids decreased from April 25th to June 7th, then increased during June and July, and decreased again at the beginning of August. Thirteen types of phenolic compounds were identified using HPLC of which juglone had the highest content. Because of seasonal variations, the trends of different phenolic compounds were different. Contents of both total phenolics and total flavonoids were strongly correlated with antioxidant activity; however, compared with totals, less significant correlations were observed between individual phenolic compounds and antioxidant activities.
Introduction
Phenolic compounds are secondary metabolites, which are constituents of both edible and non-edible parts of plants.[Citation1] Phenolics are considered active substances in plant defence mechanisms[Citation2] and have beneficial effects on human health due to their antioxidant, antimutagen, and free radical scavenging properties,[Citation3,Citation4] in addition to their use as natural preservatives.[Citation5] In recent decades, the use of natural substances has increased faster than the use of synthetic ones, because synthetic materials and products are relatively more complex than natural substances and therefore require a longer time to completely degrade to their natural components in the environment.[Citation5,Citation6] Therefore, the reuse of by-products from food, forest, or agricultural industries as natural antioxidants is of particular interest because of the economic and environmental benefits.[Citation7]
Secondary metabolites in Juglans have been studied extensively in previous research, and many phenolic compounds have been identified, particularly in Juglans regia because of the worldwide distribution. Juglans sigillata originated in the southwest of China and typically grows in the valleys and on the mountain slopes of Yunnan, Guizhou, Sichuan, and Tibet provinces at an altitude from 1300 to 3300 m. This species is a kind of walnut that resists disease and pests in a damp and hot climate and plays an important role in the local agricultural economics. Although the genotype is a vital factor that affects the types and contents of chemical substances in plants, in contrast to J. regia, relatively few studies have investigated the phenolic compounds constituent in J. sigillata. Only four types of galloyl glucosides were detected in the leaves,[Citation8] whereas gallic acid (GA), ellagic acid, tannic acids, (+)-catechin, (−)-epicatechin, (+)-catechin(4 → 8″)–(+)-catechin, (+)-catechin(4α 65 → 658)–(+)-catechin, five types of galloyl glucosides, and 9 α-tetralone derivatives were found in green husks.[Citation9–Citation12] GA, ellagic acid, pedunculagin, 2,3-O-4,4′,5,5′,6,6′-hexahydroxydiphenoyl-(α/β)-glucose, and six types of galloyl glucosides were found in stem bark.[Citation13]
Walnut green husks are primary by-products of walnut production and are an important source of natural phenolic compounds; however, because of the lack of research attention, the use of phenolic compounds constituent in green husks of J. sigillata is limited. Previous studies focused on comparisons among varieties, few studies have examined the accumulation of phenolics and antioxidant activity during different stages of development. With such information absent, when green husks are used as medicine, determining the dosage is difficult.
In the present study, contents of total phenolics, total flavonoids and primary phenolic compounds, and antioxidant activity of green husks from the walnut ‘Qianhe-7’ (J. sigillata Dode) were determined. The aims of this work were to determine the primary phenolic compounds in green husks, identify the changes in phenolics content and antioxidant activity during developmental stages of green husks, and confirm the relationship between phenolics content and antioxidant activity.
Materials and methods
Plant material and sample treatment
Walnut green husks were obtained from the walnut ‘Qianhe-7’ (J. sigillata) cultivated on Shuitang Farm (27°13′N, 104°71′E), Hezhang County, Guizhou Province, southwest China. Husks were collected eight times according to the growth stages of the fruit from April 25 to September 19, 2015. Walnut fruits were harvested randomly during each collection from middle branches exposed to sunlight and then transported in an icebox to the Technology and Engineering Research Center of Fruit Crops, Guizhou University, southwestern China. The walnut green husks were peeled carefully and quickly, frozen in liquid nitrogen, and stored at −70°C until analysed.
Reagents
Standards of phenolic compounds (GA, catechin, chlorogenic acid, caffeic acid, syringic acid, syringaldehyde, p-coumaric acid, ferulic acid, rutin, myricetin, quercetin, and juglone) were purchased from Sigma-Aldrich Chemical Co. (St. Louis, MO, USA). 2,2-Diphenyl-1-picrylhydrazyl (DPPH), 2,2′-azinobis-(3-ethylbenzothiazoline-6-sulphonic acid) diammonium salt (ABTS), 2,4,6-tri(2-pyridyl)-1,3,5-triazine (TPTZ), and methanol (chromatographic grade) were obtained from Aladdin Chemical Reagent Co. (Shanghai, China). Folin–Ciocalteu reagent was purchased from Solarbio Technology Co., Ltd. (Beijing, China). All aqueous solutions were prepared with ultrapure water purified with the Milli-Q Advantage A10 Water Purification System (Massachusetts, USA). All chemicals were analytical grade, unless otherwise noted.
Extraction of phenolic compounds
Phenolic compounds were extracted from walnut green husks by an ultrasonic method using 50% methanol (v/v) as the solvent. Briefly, each sample (0.5 g) was mixed with 10 mL of methanol, ground in a mortar to a fine texture and incubated in an ultrasonic bath for 40 min at 50°C, and then centrifuged at 8000 rpm for 10 min. The supernatant was concentrated to dryness by a rotary vacuum evaporator (RE-52A; Yarong, Shanghai, China) at 40°C. The dried substances were dissolved in 5 mL of methanol and stored at 4°C for analysis.
Total phenolics content
The total phenolics content (TPC) was determined using the method described by Conde-Hernández et al.[Citation14] with some modifications. Briefly, 0.4 mL of the extracted solution was mixed with 2 mL of ultrapure water and 0.4 mL of Folin–Ciocalteau reagent, incubated for 5 min at room temperature (25°C), and then 2.5 mL of 20% (w/v) Na2CO3 solution was added to the mixture, which was maintained for 2 h at room temperature. The absorbance was measured at 765 nm against a blank control on a UV–vis spectrophotometer (UV-2550; Shimadzu, Kyoto, Japan). GA was used as the reference standard, and the results are expressed as mg gallic acid equivalents (GAE) per gram fresh sample. The experimental standard curve was y = 11.925x − 0.0765 (R2 = 0.9995).
Total flavonoids content
The total flavonoids content (TFC) was determined using the method described by Feng et al.[Citation15] with some modifications. Briefly, 0.5 mL of the plant-extracted solution was mixed with 2 mL of ultrapure water and 1 mL of NaNO2 (5%, w/v) solution. After standing for 6 min, 1 mL of (10%, w/v) Al(NO3)3 solution was added to the mixture to which after 6 min, 3 mL of NaOH (4%, w/v) solution was added. The mixture was incubated for 15 min at room temperature. The TFC was assayed measuring the absorption at 510 nm using a spectrophotometer. Rutin was used as the reference standard, and the results are expressed as mg rutin equivalents (RE) per gram fresh sample. The experimental standard curve was y = 0.0945x + 0.0276 (R2 = 0.9986).
Identification and quantification of phenolic compounds
HPLC analysis was performed using a Shimadzu HPLC System (LC-15C series; Japan), consisting of a diode-array detector. An Agilent SB-C18 column (5 µm, 250 mm × 4.6 mm) was used, and the thermostat was set at 25°C. The mobile phase consisted of acetic acid (eluent A, pH 3) and methanol (eluent B). The injection volume of all samples was 10 µL. The flow rate was 0.9 mL/min, and the different gradient programs were as follow: 0–10 min, 10–20% B; 10–25 min, 20–50% B; 25–35 min, 50% B; and 35–40 min, 50–10% B. GA, catechin, chlorogenic acid, caffeic acid, vanillic acid, epicatechin, syringic acid, syringaldehyde, p-coumaric acid, and ferulic acid were detected at a wavelength of 280 nm. The other gradient program was as follows: 0–10 min, 10–40% B; 10–25 min, 40–60% B; 25–35 min, 60–80% B; and 35–45 min, 80–10% B. Rutin, myricetin, and juglone were detected at a wavelength of 251 nm.
Antioxidant activity determination
The FRAP (ferric reducing ability of plasma) assay for reducing power was performed according to the method of Benzie and Strain[Citation16] with some modifications. Briefly, the FRAP reagent was prepared by mixing 100 mM acetate buffer (pH 3.6) and 10 mM TPTZ in 40 mM HCl and 20 mM ferric chloride in a ratio 10:1:1 (v/v/v). For analysis, 0.2 mL of plant-extracted solution was allowed to react with 2 mL of FRAP reagent for 30 min at 37°C, and the absorbance at 593 nm was measured against a blank control also incubated at 37°C. A FeSO4 solution was used as the reference standard, and the results are expressed as mmol FeSO4 equivalents per gram fresh sample. The experimental standard curve was y = 2.4906x − 0.2286 (R2 = 0.9963).
The DPPH• (1,1-diphenyl-2-picrylhydrazyl free radical) scavenging capacity was measured using the method described by Motamed and Naghibi[Citation17] with some modifications. Briefly, 1 mL of extracted solution (5, 4, 3, 2, 1, and 0.5 mg/mL) was mixed with 2 mL of DPPH solution (0.1 mmol/L) for 30 min in the dark. The absorbance was measured at 517 nm against a blank control also incubated at the same condition. The sample concentration providing 50% inhibition (IC50) was calculated from the graph of inhibition percentage against sample concentration.
For the ABTS (scavenging capacity of 2,2′-azinobis-(3-ethylbenzothiazoline-6-sulfonic acid free radical)) assay, the procedure followed the method of Jun et al.[Citation18] with some modifications. The ABTS radical cation solution was mixed with 2.45 mM potassium persulfate and 7 mM ABTS stock solution in equal volumes and reacted for 12 h at room temperature in the dark. The solution was then diluted using 5 mM phosphate buffer saline (pH 7.4) to obtain an absorbance of 0.70 ± 0.02 at 734 nm. For analysis, 0.2 mL of extracted solution (6, 5, 4, 3, 2, 1, and 0.5 mg/mL) was reacted with 3 mL of ABTS solution for 6 min at room temperature in the dark. The absorbance was measured at 734 nm using a spectrophotometer, and the IC50 was calculated.
Statistical analyses
Statistical analyses were conducted using the SPSS statistical software package 19.0 for windows (SPSS Inc., Chicago, IL, USA). The data were analysed with ANOVA and Duncan’s multiple range tests at a level of p < 0.05 to compare sample means. Pearson correlation coefficients were determined to investigate the relationships between phenolics and antioxidant activity. All values are presented as the mean ± standard deviation.
Results and discussion
Morphological development of walnut fruits
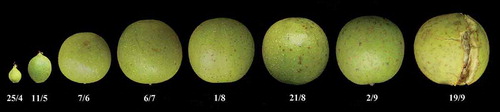
The developmental curve of walnut fruits growth varied as an “S”-type curve (). After pollination and fertilization, walnut fruits rapidly expanded in size from early May to early June and then grew more slowly for the rest of June. From July to September, the size of walnut fruits changed little, and green husks dehisced in September at fruit ripening.
Figure 1. Morphological characters of walnut fruits at different sampling stages.
Total phenolics and TFC
The changes in TPC and TFC are shown in . The contents of both total phenolics and total flavonoids were significantly different at different times of harvest (p < 0.05). Contents of total phenolics and total flavonoids decreased continuously from April 25th to June 7th, then increased from June to July, and finally decreased again at the beginning of August. During the development process of walnut fruits, average content of total phenolics and total flavonoids was 0.61 mg GAE/g FW and 1.03 mg RE/g FW, respectively. The highest contents were 1.14 mg GAE/g FW (TPC) and 1.85 mg RE/g FW (TFC), which were both observed on April 25th, whereas the lowest contents of total phenolics and total flavonoids were 0.29 GAE/g FW (TPC) and 0.52 RE/g FW (TFC) on September 19th. The correlation between total phenolics and TFCs was 0.99 (p < 0.01), even higher than that reported in guava and pisang mas.[Citation19] Changes in the content of total phenolics in different seasons have also been studied in J. regia and in apple by other authors.[Citation20–Citation22] The initial decrease in phenolics content might be attributed to the rapid enlargement of fruits from late April to early June, when the growth rate of fruit exceeded the accumulation of phenolics and flavonoids. Moreover, most of the nutrients in this period, including photoassimilates and mineral elements, are used primarily for fruit growth.[Citation20] Walnut fruits grew slowly in July, with the synthesis of phenolics more rapid than earlier. Additionally, the increase in phenolics content in July was most likely also related to adverse stress, such as high temperature and intense sunlight, which promote production of phenolics.[Citation22] Therefore, the biosynthesis of phenolics induced by ecological parameters should be examined in further studies. The second decrease in phenolics content in August might be caused by competition for carbohydrates between phenolic synthesis and protein or fat synthesis in seed. Walnut green husks dehisced in September at fruit maturation, and therefore, phenolics content continued to decrease in September.
Figure 2. Changes of total phenolic and total flavonoid contents of walnut green husks during different stages of development. Note: Results represent the means ± standard deviation (n = 3). Different little letter near the bar indicates significantly difference at p < 0.05 level.
Identification and quantification of phenolic compounds
As shown in , a total of 15 types of phenolic compounds were used as standards, and 13 of these types of phenolic compounds, including GA, catechin, chlorogenic acid, vanillic acid, caffeic acid, epicatechin, syringic acid, syringaldehyde, p-coumaric acid, ferulic acid, rutin, myricetin, and juglone, were identified in green husks by HPLC (). Most of these compounds are previously reported in J. regia.[Citation2,Citation23]
Table 1. Changes of phenolic compounds of walnut green husks during developmental stages (mg/100 g).
Figure 3. HPLC chromatogram of phenolic standards at 280 nm (A) and 251 nm (B). Peaks: 1 gallic acid; 2 catechin; 3 chlorogenic acid; 4 vanillic acid; 5 caffeic acid; 6 epicatechin; 7 syringic acid; 8 syringaldehyde; 9 ferulic acid; 10 ferulic acid; 11 rutin; 12 ellagic acid; 13 myricetin; 14 quercetin; 15 juglone.
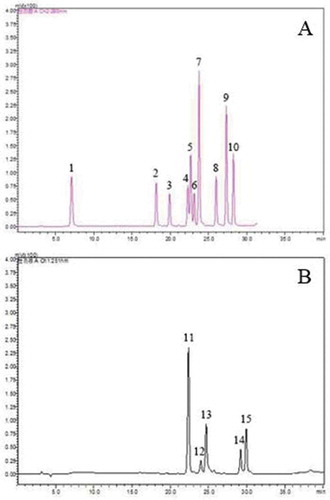
Juglone is the characteristic compound of the Juglandaceae and is used as a natural dye in the wool and hair dyeing industries. The compound is also reported to have medicinal properties against fungal, bacterial, and viral infections[Citation24] and can decrease the incidence of tumours in rats.[Citation25] In our study, juglone was the primary phenolic compound in walnut green husks, with an average content of 188.92 mg/100 g FW for the eight sample times. With the growth and development of walnut fruits, the juglone content in green husks varied similarly to an “M”-type curve. The lowest content of juglone (89.19 mg/100 g FW) was observed on April 25th, which then increased until June 7th (113.09 mg/100 g FW). The second low point value occurred in early August (92.94 mg/100 g FW), and juglone content then increased dramatically again, with the maximum content obtained on September 2nd (305.55 mg/100 g FW). The high content was maintained during the fruit maturation process, although content decreased slightly from early to middle September. Stampar et al.[Citation23] also found that juglone was the primary phenolic compound in green husks during the J. regia fruit development process. However, in their research, the green husks on June 21st contained the highest content of juglone (1404 mg/100 g FW), in contrast to our results when the highest content was observed at the stage of fruit maturity (September 2nd). The juglone content in their study was also higher than that in J. sigillata, which might be associated with different cultivars and environmental conditions. In our study, the changes in contents of total phenolics and juglone during walnut green husks development were in complete opposition, and the correlation between content of total phenolics and juglone was significantly negative (r = −0.69). Transformation of phenolics might occur during walnut green husks development.
Different phenolic compounds in green husks showed different trends with seasonal variation, which is also observed for phenolics in annual shoots and leaves of J. regia.[Citation2,Citation26] Flavonoids have generated wide interest because of their potential antioxidant activity and beneficial effects on human health.[Citation26,Citation27] Rutin is a flavonoid that reportedly has beneficial effects on health.[Citation28] Content of rutin in green husks decreased from the start of the study until July 6th and showed a trend of a bimodal curve during the rest of the growing season. The highest and lowest contents of rutin were found on April 25th and August 21st, which were 28.49 and 0.94 mg/100 g, respectively. Myricetin is another flavonoid that serves as a functional food ingredient and that has potential anticancer and antihyperglycaemic activity.[Citation29,Citation30] In this study, myricetin was detected only in the two early periods. Stampar et al.[Citation23] reported a similar result for J. regia, but the content of myricetin was much higher in the early stage than that in our study. Catechin and epicatechin are also flavonoids, and both followed the same trend (similar to a “W”-type curve) during the entire season, except for a continued increase of catechin content in August.
Eight types of phenolic acids, including GA, chlorogenic acid, vanillic acid, caffeic acid, syringaldehyde, syringic acid, p-coumaric acid, and ferulic acid, were identified in the green husks of J. sigillata. GA and chlorogenic acid were at the highest levels, with average contents of 4.00 and 3.84 mg/100 g, respectively. Content of GA decreased until early August and tended to remain stable throughout August, then increased slightly until maturation. The content of chlorogenic acid decreased until early July and changed little throughout July, then increased until early September and decreased again until maturation. Previous studies indicate that chlorogenic acid may act directly as defensive compound,[Citation4] and contents are significantly higher in resistant than in susceptible apple and pear varieties.[Citation21,Citation31] The content of chlorogenic acid in green husks of J. sigillata was high, particularly with the increase after August, and this phenolic acid might act as a defensive compound against diseases, pests, and solar radiation in the damp and hot climate of southwest China. The contents of p-coumaric acid and vanillic acid decreased throughout the entire season, except for an increase in p-coumaric acid in August and a slight increase in vanillic acid in September. Caffeic acid content decreased until early June and tended to remain stable until early August, then increased slightly until maturation. Contents of syringic acid and syringaldehyde showed a “W”-type curve over the entire season. Content of ferulic acid decreased until May 11th and showed a trend of a bimodal curve during the rest of the growing season. Numerous studies show that anthocyanins are frequently synthesized in the colouring period and are affected by sunlight irradiation,[Citation32] but few studies have reported on the dynamic accumulation of phenolic compounds that we identified in this study. Walnut green husks contained the highest contents of phenolic compounds and total phenolics in fruit setting and early developing periods; therefore, the young fruits should be the preferred choice to extract phenolics, which could come from thinning and the early physiological drop of fruits.
Antioxidant activity of walnut green husks extract
The antioxidant activity of walnut is responsible for the nutritional and healthcare benefits. In addition to the kernels,[Citation33,Citation34] good antioxidant activity is also found in male inflorescences,[Citation35] leaves,[Citation36,Citation37] shoots,[Citation38] and green husks.[Citation5,Citation7] Frankel and Meyer[Citation39] note that although many methods are used for testing antioxidant activity, no approved or standard methods have been selected, and as result, testing outcomes are dependent on the method used.
In this study, three methods, FRAP, DPPH, and ABTS, were used to estimate the antioxidant activity of walnut green husks (). The reducing power assay is based on the reduction of ferric iron (Fe3+) to ferrous ion (Fe2+) in the presence of antioxidants.[Citation40] The FRAP values continuously decreased from April 25th to June 7th, subsequently increased over the months of June and July, and then decreased again by the beginning of August. Finally, FRAP values increased slightly in September (). The FRAP values ranged from 0.087 to 0.335 mmol/g FW, with the mean of 0.144 mmol/g FW. shows the DPPH• scavenging capacity (IC50) of the walnut green husks extract from different sample dates. In this method, the purple chromogen radical DPPH• is reduced by antioxidants to the corresponding pale yellow hydrazine.[Citation41] The IC50 value continuously increased from April 25th to June 7th, then decreased over the months of June and July, and increased again by the beginning of August. Finally, the IC50 value decreased slightly at the end of August. The IC50 values for DPPH• scavenging capacity ranged from 0.74 to 5.03 mg/mL FW, with the mean of 2.81 mg/mL FW. For ABTS, the trend was in exact opposition to that of FRAP (). The ABTS assay is based on the generation of a blue/green ABTS+ that can be reduced by antioxidants.[Citation40] The IC50 values continuously increased from April 25th to June 7th, then decreased over the months of June and July, and increased again by the beginning of August. Finally, the IC50 value decreased slightly in September. The IC50 values for ABTS+ scavenging capacity ranged from 0.89 to 3.07 mg/mL FW, with the mean of 2.10 mg/mL FW. All three methods indicated that the reducing power and free radical scavenging capacity were more effective in the early period of fruit development (April 25th and May 11th), followed by August 1st, which was an important point of change for antioxidant activity.
Figure 4. Antioxidant activity changes of walnut green husks during different stages of development. Results represent the means ± standard deviation (n = 3). Different little letter near the bar indicate significantly difference at p < 0.05 level. DPPH: 1,1-diphe-nyl-2-picrylhydrazyl, FRAP: Ferric reducing ability of plasma, ABTS: 2,2′-azinobis-(3-ethylbenzothiazoline-6-sulfonic acid). IC50 means the sample concentration providing 50% inhibition.
Correlation between antioxidant activity and phenolics content
Correlation coefficients between antioxidant activity and phenolics content are shown in . The contents of both total phenolics and total flavones were strongly correlated with antioxidant activity (0.88 ≤ r ≤ 0.93, p < 0.01) as determined by FRAP, DPPH, and ABTS methods. Similar linear correlations are also found in J. regia[Citation7] and in other plant materials.[Citation42–Citation45] In samples with high contents of total phenolics and total flavones, antioxidant activities were high (low IC50 values). Thus, the contents of total phenolics and total flavones were confirmed as largely responsible for the antioxidant activity of walnut green husks. In this study, we found that determining which phenolic compounds were the primary contributors to the antioxidant activity was not clear. Many studies show that antioxidant activity of phenolic compounds is correlated with their chemical structures. Son and Lewis[Citation46] found that hydrophobic antioxidants tended to have increased antioxidant activity in an emulsion system. Lien et al.[Citation47] found that the number and location of hydroxyl groups on the flavonoid ring system led the antioxidant effect of 42 different flavonoids, although other factors also affected activity. Gil et al.[Citation42] found that both hydroxycinnamic acid derivatives and flavan-3-ols are strongly correlated with antioxidant activity in nectarines and peaches. In this study, we found that vanillic acid, caffeic acid, rutin, and myricetin were highly correlated with antioxidant activity as determined by the FRAP assay (0.93 ≤ r ≤ 0.99, p < 0.01). Highly significant positive correlations were detected between epicatechin and antioxidant activity as measured by DPPH and ABTS methods (0.85 ≤ r ≤ 0.91, p < 0.01). Furthermore, vanillic acid, caffeic acid, rutin, and myricetin were significantly correlated with DPPH (p < 0.05), and caffeic acid, syringaldehyde, and myricetin were significantly correlated with ABTS (p < 0.05). We determined that walnut green husks were composed of several primary types of phenolic compounds. However, more than 4000 types of flavonoids have been reported as naturally occurring compounds.[Citation48] The expected thousands of phenolic compounds that occur in walnut green husks likely work in combination to form a powerful antioxidant system. Therefore, further studies of the phenolic compounds in walnut green husks will be required to reveal the relationships between antioxidant activity and the chemical structures of various types of phenolic compounds.
Table 2. Correlation coefficient between antioxidant activity and phenolics content.
Conclusion
The study revealed that phenolics content and antioxidant activity of walnut green husks changed regularly with the development of fruits and were also affected by ecological factors. The highest TPC was observed on April 25th, and juglone was the phenolic compound with the highest content on all sample dates. Highly significant positive correlations were detected between antioxidant capacity and TPC or TFC. Compared with that for total phenolics, the correlations between individual phenolic compounds and antioxidant activity were less significant. Walnut green husks are a good candidate to use for natural antioxidants because of the rich phenolics content and strong antioxidant activity.
Additional information
Funding
Related Research Data
References
- Jalili, A.; Sadeghzade, A. Comparative Phenolic Profile of Persian Walnut (Juglans Regia L.) Leaves Cultivars Grown in Iran. Afr. J. Biochem. Res. 2012, 6, 33–38.
- Solar, A.; Colarič, M.; Usenik, V.; Stampar, F. Seasonal Variations of Selected Flavonoids, Phenolic Acids and Quinones in Annual Shoots of Common Walnut (Juglans Regia L.). Plant Sci. 2006, 170, 453–461.
- Figueroa, F.; Marhuenda, J.; Cerdá, B.; Zafrilla, P.; Martínez-Cachá, A.; Tejada, L.; Villaño, D.; Mulero, J. HPLC-DAD Determination and Availability of Phenolic Compounds in 10 Genotypes of Walnuts. Int. J. Food Properties. 2016, 20, 1–33.
- Heim, K. E.; Tagliaferro, A. R.; Bobilya, D. J. Flavonoid Antioxidants: Chemistry, Metabolism and Structure-Activity Relationships. J. Nutr. Biochemistry. 2002, 13, 572–584.
- Oliveira, I.; Sousa, A.; Ferreira, I. C. F. R.; Bento, A.; Estevinho, L.; Pereira, J. A. Total Phenols, Antioxidant Potential and Antimicrobial Activity of Walnut (Juglans Regia L.) Green Husks. Food Chem. Toxicol. 2008, 46, 2326–2331.
- Contini, M.; Baccelloni, S.; Massantini, R.; Anelli, G. Extraction of Natural Antioxidants from Hazelnut (Corylus Avellana L.) Shell and Skin Wastes by Long Maceration at Room Temperature. Food Chem. 2008, 110, 659–669.
- Fernández-Agulló, A.; Pereira, E.; Freire, M. S.; Valentao, P.; Andrade, P. B.; González-Álvarez, J.; Pereira, J. Influence of Solvent on the Antioxidant and Antimicrobial Properties of Walnut (Juglans Regia L.) Green Husks Extracts. Ind. Crops Prod. 2013, 42, 126–132.
- Si, C. L.; Fan, S.; An, L. L. Secondary Metabolites from the Leaves of Juglans sigillata[J]. Chem. Nat. Compounds. 2016, 52, 1008–1010.
- Si, C. L.; Wu, L.; Shen, T.; Huang, X. F.; Du, Z. G.; Ren, X. D.; Hu, W. C. Recovery of Low-Molecular Weight Galloyltannins from Agricultural Residue of Juglans Sigillata Dode Seed Husks and Their Tyrosinase Inhibitory Effect. Bioresources. 2014, 9, 2226–2236.
- Si, C. L.; Qin, P. P.; Hu, H. Y.; Jiang, J. Z.; Ni, Y. H. Low Molecular Weight Extractives from Green Husks of Juglans Sigillata and Their Antioxidant Activities. J. Biobased Mater. Bioenergy. 2011, 5, 287–292.
- Si, C. L.; Zhang, Y.; Zhu, Z. Y.; Liu, S. C. Chemical Constituents with Antioxidant Activity from the Pericarps of Juglans Sigillata. Chem. Nat. Compounds. 2011, 47, 442.
- Liu, Q.; Zhao, P.; Li, X. C.; Jacob, M. R.; Yang, C. R.; Zhang, Y. J. New α-Tetralone Galloylglucosides from the Fresh Pericarps of Juglans Sigillata. Helv. Chim. Acta. 2010, 93, 265–271.
- Si, C. L.; Xu, J.; Lu, Y. Y.; Su, Y. F.; Bae, Y. S. Hydrolysable Tannins from Juglans Sigillata Stem barks[J]. Biochem. Syst. Ecol. 2011, 39, 225–227.
- Conde-Hernández, L. A.; Guerrero-Beltrán, J. Á. Total Phenolics and Antioxidant Activity of Piper Auritum and Porophyllum Ruderale. Food Chem. 2014, 142, 455–460.
- Feng, S.; Luo, Z.; Zhang, Y.; Lu, B. Phytochemical Contents and Antioxidant Capacities of Different Parts of Two Sugarcane (Saccharum Officinarum L.) Cultivars. Food Chem. 2014, 151, 452–458.
- Benzie, I. F.; Strain, J. J. The Ferric Reducing Ability of Plasma (FRAP) as a Measure of “Antioxidant Power”: The FRAP Assay. Anal. Biochem. 1996, 239, 70–76.
- Motamed, S. M.; Naghibi, F. Antioxidant Activity of Some Edible Plants of the Turkmen Sahra Region in Northern Iran. Food Chem. 2010, 119, 1637–1642.
- Jun, H. I.; Song, G. S.; Yang, E. I.; Youn, Y.; Kim, Y. S. Antioxidant Activities and Phenolic Compounds of Pigmented Rice Bran Extracts. J. Food Sci. 2012, 77, 759–764.
- Alothman, M.; Bhat, R.; Karim, A. A. Antioxidant Capacity and Phenolic Content of Selected Tropical Fruits from Malaysia, Extracted with Different Solvents. Food Chem. 2009, 115, 785–788.
- Amaral, J. S.; Seabra, R. M.; Andrade, P. B.; Valentao, P.; Pereira, J.; Ferreres, F. Phenolic Profile in the Quality Control of Walnut (Juglans Regia L.) Leaves. Food Chem. 2004, 88, 373–379.
- Petkovsek, M. M.; Stampar, F.; Veberic, R. Seasonal Changes in Phenolic Compounds in the Leaves of Scab-Resistant and Susceptible Apple Cultivars. Can. J. Plant Sci.. 2009, 89, 745–753.
- Cosmulescu, S.; Trandafir, I. Seasonal Variation of Total Phenols in Leaves of Walnut (Juglans Regia L.). J. Med. Plants Res. 2011, 5, 4938–4942.
- Stampar, F.; Solar, A.; Hudina, M.; Veberic, R.; Colaric, M. Traditional Walnut Liqueur-Cocktail of Phenolics. Food Chem. 2006, 95, 627–631.
- Thakur, A. J.;. A Therapeutic Phytochemical from Juglans Regia L. J. Med. Plants Res. 2011, 5, 5324–5530.
- Sugie, S.; Okamoto, K.; Rahman, K. M. W.; Tanaka, T.; Kawai, K.; Yamahara, J.; Mori, H. Inhibitory Effects of Plumbagin and Juglone on Azoxymethane-Induced Intestinal Carcinogenesis in Rats. Cancer Lett. 1998, 127, 177–183.
- Cosmulescu, S.; Trandafir, I.; Nour, V. Seasonal Variation of the Main Individual Phenolics and Juglone in Walnut (Juglans Regia) Leaves. Pharm. Biol. 2014, 52, 575–580.
- Geleijnse, J. M.; Pch, H. Flavonoids and Cardiovascular Health: Which Compounds, What Mechanisms. Am. J. Clin. Nutr. 2008, 88, 12–13.
- Kreft, I.; Fabjani, N.; Germ, M. Rutin in buckwheat-Protection of Plants and Its Importance for the Production of Functional Food. Fagopyrum. 2003, 20, 7–11.
- Sun, F.; Zheng, X.; Ye, J.; Wu, T. T.; Wang, J. L.; Chen, W. Potential Anticancer Activity of Myricetin in Human T24 Bladder Cancer Cells Both in Vitro and in Vivo. Nutr. Cancer. 2012, 64, 599–606.
- Arumugam, B.; Palanisamy, U. D.; Chua, K. H.; Kuppusamy, U. R. Potential Antihyperglycaemic Effect of Myricetin Derivatives from Syzygium Malaccense. J. Funct. Foods. 2016, 22, 325–336.
- Gunen, Y.; Misirli, A.; Gulcan, R. Leaf Phenolic Content of Pear Cultivars Resistant or Susceptible to Fire Blight. Scientia Hortic. 2005, 105, 213–221.
- Sun, S.; Xin, L.; Gao, H.; Wang, J.; Li, P. Response of Phenolic Compounds in ‘Golden Delicious’ and ‘Red Delicious’ Apples Peel to Fruit Bagging and Subsequent Sunlight Re-Exposure. Scientia Hortic. 2014, 168, 161–167.
- Labuckas, D. O.; Maestri, D. M.; Perelló, M.; Martínez, M. L.; Lamarque, A. L. Phenolics from Walnut (Juglans Regia L.) Kernels: Antioxidant Activity and Interactions with Proteins. Food Chem. 2008, 107, 607–612.
- Zhang, Z.; Liao, L.; Moore, J.; Wu, T.; Wang, Z. Antioxidant Phenolic Compounds from Walnut Kernels (Juglans Regia L.). Food Chem. 2009, 113, 160–165.
- Wang, C. L.; Zhang, W. E.; Pan, X. J. Nutritional Quality of the Walnut Male Inflorescences at Four Flowering Stages. J. Food Nutr. Res. 2014, 2, 457–464.
- Pereira, J. A.; Oliveira, I.; Sousa, A.; Valentão, P.; Andrade, P. B.; Ferreira, I. C. Walnut (Juglans Regia L.) Leaves: Phenolic Compounds, Antibacterial Activity and Antioxidant Potential of Different Cultivars. Food Chem. Toxicol. 2007, 45, 2287–2295.
- Almeida, I. F.; Fernandes, E.; Lima, J. L. F. C.; Costa, P. C. Walnut (Juglans Regia) Leaf Extracts are Strong Scavengers of Pro-Oxidant Reactive Species. Food Chem. 2008, 106, 1014–1020.
- Cheniany, M.; Ebrahimzadeh, H.; Vahdati, K.; Preece, J. E.; Masoudinejad, A.; Mirmasoumi, M. Content of Different Groups of Phenolic Compounds in Microshoots of Juglans Regia Cultivars and Studies on Antioxidant Activity. Acta Physiol. Plant. 2013, 35, 443–450.
- Frankel, E. N.; Meyer, A. S. The Problems of Using One-Dimensional Methods to Evaluate Multifunctional Food and Biological Antioxidants. J. Sci. Food Agric. 2000, 80, 1925–1941.
- Floegel, A.; Kim, D. O.; Chung, S. J.; Koo, S. I.; Chun, O. K. Comparison of ABTS/DPPH Assays to Measure Antioxidant Capacity in Popular Antioxidant-Rich US Foods. J. Food Composition Anal. 2011, 24, 1043–1048.
- Magalhães, L. M.; Segundo, M. A.; Reis, S.; Lima, J. L. Methodological Aspects about in Vitro Evaluation of Antioxidant Properties. Anal. Chim. Acta. 2008, 613, 1–19.
- Gil, M. I.; Tomás-Barberán, F. A.; Hess-Pierce, B.; Kader, A. A. Antioxidant Capacities, Phenolic Compounds, Carotenoids, and Vitamin C Contents of Nectarine, Peach, and Plum Cultivars from California. J. Agric. Food Chem. 2002, 50, 4976–4982.
- Awika, J. M.; Rooney, L. W.; Wu, X.; Prior, R. L.; Cisneroszevallos, L. Screening Methods to Measure Antioxidant Activity of Sorghum (Sorghum Bicolor) and Sorghum Products. J. Agric. Food Chem. 2003, 51, 6657–6662.
- Cai, Y.; Luo, Q.; Sun, M.; Corke, H. Antioxidant Activity and Phenolic Compounds of 112 Traditional Chinese Medicinal Plants Associated with Anticancer. Life Sci. 2004, 74, 2157–2184.
- Thaipong, K.; Boonprakob, U.; Crosby, K.; Cisneros-Zevallos, L.; Byrne, D. H. Comparison of ABTS, DPPH, FRAP, and ORAC Assays for Estimating Antioxidant Activity from Guava Fruit Extracts. J. Food Composition Anal. 2006, 19, 669–675.
- Son, S.; Lewis, B. A. Free Radical Scavenging and Antioxidative Activity of Caffeic Acid Amide and Ester Analogues: Structure-Activity Relationship. J. Agric. Food Chem. 2002, 50, 468–472.
- Lien, E. J.; Ren, S.; Bui, H. H.; Wang, R. Quantitative Structure-Activity Relationship Analysis of Phenolic Antioxidants. Free Radic. Biol. Med. 1999, 26, 285–294.
- Iwashina, T.;. The Structure and Distribution of the Flavonoids in Plants. J. Plant Res. 2000, 113, 287–299.