
ABSTRACT
Theoretic conjecture and mathematical models used for classifying wines into different chromatic levels were examined, based on a comprehensive chromatic database of 237 dry red wines. Similar mathematical models were also built for 79 Chinese Cabernet Sauvignon dry red wines from different regions and vintages, which could be set as chromatic reference for other Chinese Cabernet Sauvignon dry red wines. The reliability of these models and relationships between different chromatic parameters were further validated by statistical tools. Such methodology can be adopted to build chromatic references for wines from different backgrounds, thus to classify wine color more extensively and objectively.
Introduction
Red wines, as one of the most popular beverages, are consumed by adults in many parts of the world. Scientific researches indicate that drinking moderate amount of red wines regularly can benefit human health in preventing diseases like coronary heart disease, cardiovascular disease, inflammation and Alzheimer’s disease.[Citation1–Citation4] Except the health benefits, red wines are also enjoyed by consumers due to their organoleptic properties, such as color, aroma, taste and astringency. Color, the visual property of red wines, is usually thought as the first organoleptic property received by consumers, which plays a key role in affecting consumers’ acceptance of red wines.
The color of red wines is directly determined by a group of phenolic compounds called anthocyanins, which are mainly extracted from red grape skins during winemaking, but can also be extracted from flesh when teinturier grapes are used. During wine maturation and aging, anthocyanin composition and structures develop due to a series of mechanisms, which result in significant color changes.[Citation5] Though other phenolic compounds, such as flavan-3-ols, flavonols and phenolic acids, have no red color, they can participate in a complex spontaneous association named copigmentation with anthocyanins to stabilize and enhance wine color expression.[Citation6] Because of the organoleptic importance of color to red wines, scientists make many researches in genetic biosynthesis, enzymatic or non-enzymatic reactions, vineyard management and winemaking techniques, to find out either theoretic or practical approaches for wine color improvement.[Citation7–Citation11]
Since the commonly used evaluation methods of wine color, namely, CIELab and the Glories method, have been acknowledged worldwide, it is theoretically possible to establish a chromatic database and mathematical models based on large number of wine samples, to classify wines into different chromatic levels extensively and objectively. The objectives of this research were (1) to find out the general distribution regularity of chromatic values from a comprehensive selection of dry red wines; (2) to establish and validate mathematical models, which can classify wines of different chromatic values into different levels effectively and reliably; and (3) to propose a wine color classifying methodology, which could be helpful to compare the color quality of wines with their peer products extensively and objectively.
Materials and methods
Chemicals
Acetaldehyde was purchased from Sigma-Aldrich (St. Louis, MO, USA). Ultrapure water was obtained from a Milli-Q Element water purification system (Millipore, Milford, MA, USA).
Wine samples
In total, we selected 237 bottled commercial dry red wines of different variety types,[Citation12] countries[Citation10] and vintages (2002–2015) in our research. All these wines were kindly provided by China Alcoholic Drinks Industry Association (Beijing, China), which were initially stored in a standard wine cellar with a temperature of 13°C ± 1°C, and relative humidity of 70% ± 5%, away from light. We collected these wine samples with 10 mL brown polyethylene terephthalate tubes (three tubes for each wine sample) and stored them at −20°C, prior to chromatic analysis. More detailed information (sample no., country, region, variety type, vintage, chromatic values) about these wine samples is provided in supplementary material 1, Table A.1.
Chromatic analysis
A spectrophotometer Shimadzu UV-vis 2600 (Shimadzu, Kyoto, Japan) was used to record the wines’ absorbance spectra (380–700 nm), with a 1 mm path length quartz cuvette. Ultra-pure water was set as blank reference. A 10% (v/v) acetaldehyde solution (10 μL) was added to 1 mL of wine sample 20 min prior to color measurement to avoid sulfite interference. Each analysis was performed in triplicate.
The chromatic parameters of CIELab system, namely, lightness (L*: L* = 0, black, and L* = 100, colorless), green/red color component (a*: a* > 0, red, and a* < 0, green), blue/yellow color component (b*: b* > 0, yellow, and b* < 0 blue), chromaticity (C*ab) and hue (H*ab) were determined according to the CIELab method.[Citation13]
Using absorbance values at 420, 520 and 620 nm, five chromatic parameters were calculated according to the Glories method.[Citation14] These parameters were color intensity (CI), percentage of yellow (Yellow %), percentage of red (Red %), percentage of blue (Blue %) and a variable responsible for the proportion of red produced by the flavylium cations (flavylium are salts of anthocyanins capable of reacting), pure red (dA %). These five chromatic parameters were calculated according to
Theoretic conjecture and mathematical model calculation
Theoretically, a comprehensive chromatic database can be built by collecting the chromatic values of comprehensive dry red wines. And it could be predicted that from a statistical viewpoint, for each chromatic parameter, an ideal distribution regularity of wine samples according to their chromatic values should obey normal distribution and has a bell-shaped density curve,[Citation15] as shown in . The horizontal axis represents wine samples’ chromatic values, and the vertical axis represents wine samples’ cumulative densities in different chromatic values, respectively. If the distribution regularity of wines does not have a bell-shaped density curve, it means that the wine samples collected are still not comprehensive yet, and the chromatic database needs to be further updated.
Figure 1. An ideal wine sample distribution regularity that obeys normal distribution (calculation based on all wine samples’ chromatic values of one chromatic parameter).
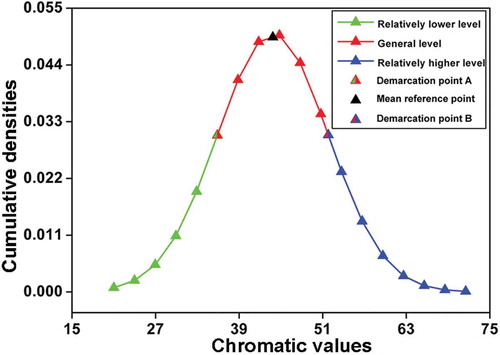
In , from a mathematic viewpoint, the dispersion degree (standard deviation value: σ) from the mean reference point (mean value: μ) of the total values of this chromatic parameter represents the mathematical range that includes most wine samples’ chromatic values. Therefore, the range from demarcation point A (chromatic value: μ – σ) to demarcation point B (chromatic value: μ + σ) in could represent most wines’ chromatic level, of which we call this range the general level. Consequently, the chromatic values that are below the chromatic value of demarcation point A (chromatic value: μ – σ) can be classified as the relatively lower level, and the chromatic values that are above the chromatic value of demarcation point B (chromatic value: μ + σ) can be classified as the relatively higher level.
Excel functions NORMDIST, AVERAGE and STDEV (Microsoft Corporation, Redmond, WA, USA) were used in our research to calculate the cumulative densities, mean value (μ) and standard deviation value (σ) of the total values of each chromatic parameter, respectively.
Statistical analysis
Orthogonal partial least-squares discriminant analysis (OPLS-DA) and correlation analysis were performed by using MetaboAnalyst 3.0. [Citation12]
Artwork
Origin 8.0 software (Microcal Software, Northhampton, MA, USA) and Adobe Photoshop 7.0 (San Jose) were used to create the artwork.
Results and discussion
Comprehensive chromatic database establishment
By recording 237 wine samples’ absorbance spectra (380–700 nm) and calculating their chromatic values according to the CIELab method[Citation13] and the Glories method,[Citation14] we collected the data of 10 chromatic parameters, namely, L*, a*, b*, C*ab, H*ab, CI, Yellow %, Red %, Blue % and dA %. Since each wine sample was detected in triplicate, the mean value ± standard derivation of each wine sample’s chromatic values were used to establish the comprehensive chromatic database (supplementary material 1, Table A.1).
Mathematical models for color classification
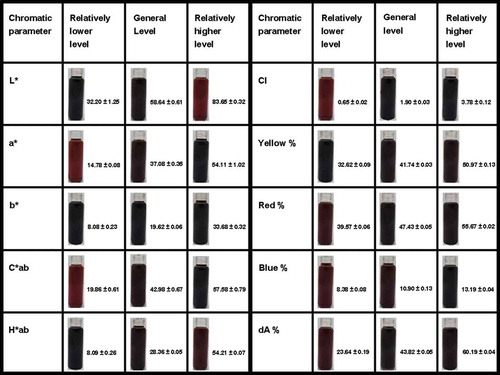
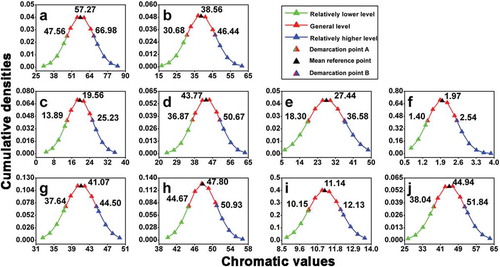
As shown in , the 237 wine samples’ distribution regularities in all 10 chromatic parameters show bell-shaped density curves, which means that the distribution regularities of these wine samples obey normal distribution. Therefore, by calculating all wine samples’ mean value (μ) and standard deviation (σ) in each chromatic parameter, comprehensive mathematical models used to classify wine color quality could be proposed. The range from demarcation point A (chromatic value: μ – σ) to demarcation point B (chromatic value: μ + σ) represents most wines’ chromatic level, the general level. Consequently, the chromatic values that are below the demarcation point A (chromatic value: μ – σ) can be classified as the relatively lower level, and the chromatic values that are above the demarcation point B (chromatic value: μ + σ) can be classified as the relatively higher level. Exemplary photos for wine samples of different chromatic levels are shown in .
Figure 2. Mathematical models for color classification (the chromatic values of demarcation point A, mean reference point and demarcation point B from each chromatic parameter are shown next to the relevant triangles). (a) Wine sample distribution regularity on the basis of L* values; (b) wine sample distribution regularity on the basis of a* values; (c) wine sample distribution regularity on the basis of b* values; (d) wine sample distribution regularity on the basis of C*ab values; (e) wine sample distribution regularity on the basis of H*ab values; (f) wine sample distribution regularity on the basis of CI values; (g) wine sample distribution regularity on the basis of Yellow % values; (h) wine sample distribution regularity on the basis of Red % values; (i) wine sample distribution regularity on the basis of Blue % values; (j) wine sample distribution regularity on the basis of dA % values.
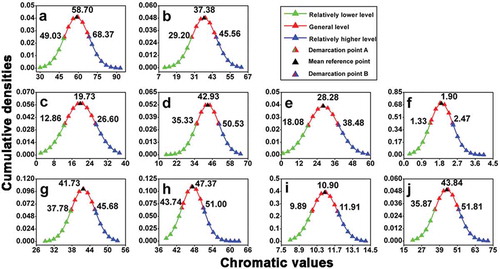
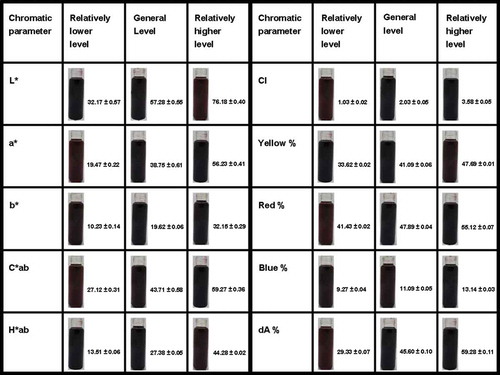
Figure 3. Photos and chromatic values (mean value ± standard deviation) of exemplary wine samples chosen from the comprehensive chromatic database.
On the basis of the comprehensive mathematical models we built (), scientists and winemakers can make general comparisons of different chromatic qualities between their own wines and other peer products extensively and objectively. Besides, based on our theoretic conjecture and mathematical model design, not only the comprehensive mathematical models used for comparing wine color quality can be achieved, establishment of sub-mathematical models used for classifying color of wines from different backgrounds can also be realized, as long as comprehensive wine samples are systematically collected. For instance, in order to have a better understanding of color quality of dry red wines that are nowadays mostly produced and consumed in China (), the Cabernet Sauvignon dry red wines, there were 79 Chinese Cabernet Sauvignon dry red wines from main wine-producing regions (eastern regions: Shandong province, Hebei province; western regions: Ningxia province, Xinjiang province, Yunnan province) and vintages (2003–2015) additionally labeled in our 237 wine samples (supplementary material 1, Table A.1, sample nos. 1–79). The values of their chromatic parameters were extracted from the original comprehensive chromatic database to establish new sub-chromatic database and to build new sub-mathematical models ().
Figure 4. Main Cabernet Sauvignon dry red wine-producing regions in China (highlighted with circles: Shandong, Hebei, Ningxia, Xinjiang, Yunnan). Regions highlighted with blue circles (Shandong, Hebei) are the wine-producing regions classified as eastern regions, and regions highlighted with brown circles (Ningxia, Xinjiang, Yunnan) are the wine-producing regions classified as western regions.
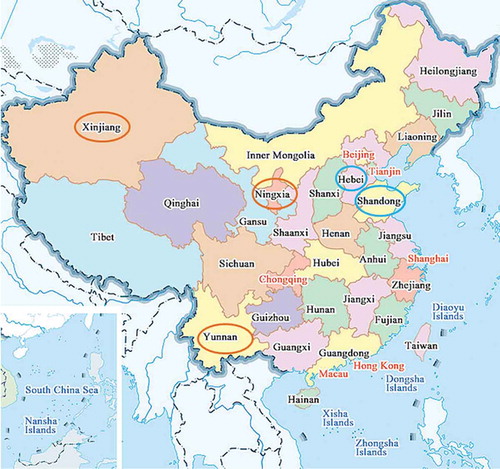
Figure 5. Sub-mathematical models for Chinese Cabernet Sauvignon dry red wines’ color classification (the chromatic values of demarcation point A, mean reference point and demarcation point B from each chromatic parameter are shown next to the relevant triangles). (a) Wine sample distribution regularity on the basis of L* values; (b) wine sample distribution regularity on the basis of a* values; (c) wine sample distribution regularity on the basis of b* values; (d) wine sample distribution regularity on the basis of C*ab values; (e) wine sample distribution regularity on the basis of H*ab values; (f) wine sample distribution regularity on the basis of CI values; (g) wine sample distribution regularity on the basis of Yellow % values; (h) wine sample distribution regularity on the basis of Red % values; (i) wine sample distribution regularity on the basis of Blue % values; (j) wine sample distribution regularity on the basis of dA % values.
As shown in , wine sample distribution regularities in all 10 chromatic parameters show bell-shaped density curves, which means that the distribution regularities of Chinese Cabernet Sauvignon dry red wine samples we used obey normal distribution. By calculating the mean value (μ) and standard deviation (σ) of each chromatic parameter, sub-mathematical models used to classify wine color could be proposed: the range from demarcation point A (chromatic value: μ – σ) to demarcation point B (chromatic value: μ + σ) represents most Chinese Cabernet Sauvignon dry red wines’ chromatic level, the general level. Consequently, the chromatic parameter that is below the demarcation point A (chromatic value: μ – σ) can be classified as the relatively lower level, and the chromatic parameter that is above the demarcation point B (chromatic value: μ + σ) can be classified as the relatively higher level. Exemplary photos for wine samples of different chromatic levels are shown in .
Figure 6. Photos and chromatic values (mean value ± standard deviation) of exemplary wine samples chosen from the sub-chromatic database.
Statistical analysis
Wine samples in and show bell-shaped density curves in all 10 chromatic parameters, which means that the distribution regularities of these wine samples obeyed normal distribution, and these wines we used could be recognized comprehensive enough to represent the wine color levels of their peer products. Therefore, the mathematical models in and may act as useful tools in classifying wine color into different levels. To further validate our theoretic conjecture and mathematical model design, we set sample labels as observations (Y) and chromatic values as variables (X), and used OPLS-DA to find out the statistical differences in samples of different chromatic levels. OPLS-DA is a modification of partial least-squares discriminant analysis (PLS-DA), which separates the systematic variation in X, into two parts, one is linearly related to Y (Tp) and one is orthogonal to Y (To), and can separate samples effectively when the number of samples is more than the number of variables. [Citation16]
The 237 dry red wine samples were labeled as relatively lower level, general level and relatively higher level first by comparing their chromatic values with the demarcation values (μ ± σ) in . Ten chromatic parameters played the role as differentiating criteria successively; therefore, OPLS-DA was conducted 10 times. The only difference between each OPLS-DA trials was the sample labels. Values of all chromatic parameters were used as variables in every OPLS-DA trial.
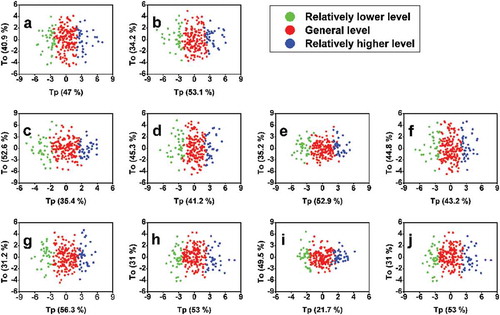
shows the OPLS-DA trials for the 237 samples. As can be seen, sample classification is gradually exhibited in Tp. No extensive overlap is observed in . The partial overlap of some sample plots is quite normal and must be due to their approximate value to the demarcation values.
Figure 7. OPLS-DA differentiation for 237 wine samples of different chromatic values. (a) OPLS-DA differentiation with L* values as differentiating criteria; (b) OPLS-DA differentiation with a* values as differentiating criteria; (c) OPLS-DA differentiation with b* values as differentiating criteria; (d) OPLS-DA differentiation with C*ab values as differentiating criteria; (e) OPLS-DA differentiation with H*ab values as differentiating criteria; (f) OPLS-DA differentiation with CI values as differentiating criteria; (g) OPLS-DA differentiation with Yellow % values as differentiating criteria; (h) OPLS-DA differentiation with Red % values as differentiating criteria; (i) OPLS-DA differentiation with Blue % values as differentiating criteria; (j) OPLS-DA differentiation with dA % values as differentiating criteria.
The quality of the OPLS-DA models was evaluated by the goodness-of-fit parameter (R2X), the proportion of the variance of the response variable that was explained by the model (R2Y) and the predictive ability parameter (Q2), which were calculated by a seven-round internal cross-validation of the data using a default option of MetaboAnalyst 3.0.[Citation12] R2X, R2Y and Q2 values close to 1 indicate an excellent OPLS-DA model, and values higher than 0.5 indicate an OPLS-DA model of good quality.[Citation17] The R2X, R2Y and Q2 values of OPLS-DA models in are provided in , all of which are higher than 0.5, thus indicating that these OPLS-DA models have successfully classified these wines according to their chromatic levels. Therefore, the theoretic conjecture and mathematical models designed in are proved applicable.
Table 1. Validation of different OPLS-DA models in .
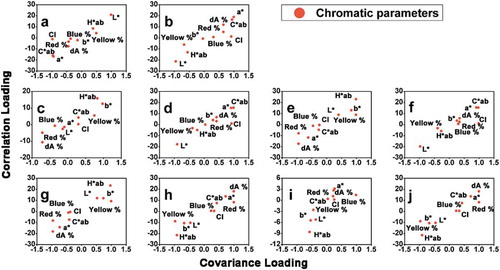
Loading plots of each OPLS-DA model are shown in . When comparing each loading plots in with the corresponding OPLS-DA model in , predominant chromatic parameters (from the covariance loading perspective in ) vary in wines of different levels (from the Tp perspective in ), and it is not only the chromatic parameter of differentiating criteria acts as differentiating marker. This phenomenon indicates that when each chromatic parameter is used as differentiating criteria, for example, the L* value, although wine samples of relatively higher L* level, general L* level and relatively lower L* level can be successfully classified (), other chromatic features may also coexist with the L* feature (), in wines of different L* levels.
Figure 8. OPLS-DA loading plots for OPLS-DA models in . (a) OPLS-DA loading plots with L* values as differentiating criteria; (b) OPLS-DA loading plots with a* values as differentiating criteria; (c) OPLS-DA loading plots with b* values as differentiating criteria; (d) OPLS-DA loading plots with C*ab values as differentiating criteria; (e) OPLS-DA loading plots with H*ab values as differentiating criteria; (f) OPLS-DA loading plots with CI values as differentiating criteria; (g) OPLS-DA loading plots with Yellow % values as differentiating criteria; (h) OPLS-DA loading plots with Red % values as differentiating criteria; (i) OPLS-DA loading plots with Blue % values as differentiating criteria; (j) OPLS-DA loading plots with dA % values as differentiating criteria.
To find out the relationship that might exist in different chromatic parameters, we used the correlation analysis to examine the chromatic values of all the 237 wine samples. As shown in , chromatic parameters can be basically clustered into two groups, the first group includes a*, C*ab, CI, Blue %, Red % and dA %, which can be labeled as chromatic group 1, and the second group includes L*, b*, H*ab and Yellow %, which can be labeled as chromatic group 2. Back to the loading plots in , similar gatherings can also be observed, namely, in almost all the loading plots, chromatic parameters gather together in the way they are clustered in . In other words, chromatic parameters clustered as chromatic group 1 in are located in a relatively nearer distance with each other in compared with the distances between them and chromatic parameters clustered as chromatic group 2 in and vice versa.
Figure 9. Correlation analysis based on chromatic values in the comprehensive chromatic database.
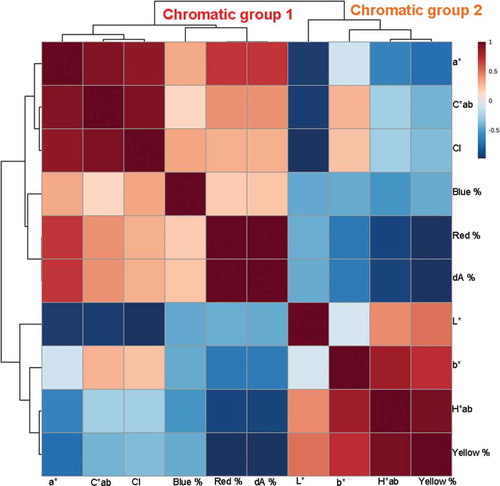
Consequently, based on the similarity from OPLS-DA and correlation analysis, we can conclude that correlations do exist among different chromatic parameters. Wine samples of different levels of one chromatic parameter from chromatic group 1 or chromatic group 2 imply that these samples may also have the same levels of other chromatic parameters from the same chromatic group. In chromatic group 1, the positive correlation between a*, Blue %, Red % and dA % is generally acknowledged since these parameters are positively correlated with the concentration and composition of anthocyanins in wines, which exhibit a maximum absorption around 500–525 nm or even higher, thus conferring wines a reddish/bluish color. [Citation5] C*ab and CI are also clustered into chromatic group 1, which might be because anthocyanins are the major compounds that contribute color to red wines. The b*, H*ab and Yellow % represent the yellowish degree in wines, which are positively correlated with a group of compounds called xanthylium salts. The xanthylium salts are produced in wines in the presence of flavanols and aldehydes, such as catechin and acetaldehyde, and when flavanols participate in the formation of xanthylium salts, their contribution in copigmentation decrease, which might explain why L* is clustered into chromatic group 2. [Citation18,Citation19]
The OPLS-DA and correlation analysis of 79 Chinese Cabernet Sauvignon dry red wines are provided in supplementary material 2. In Fig. A.1, wine samples of different chromatic levels are classified gradually, just like the OPLS-DA models of the 237 wine samples (). The goodness-of-fit parameter (R2X), proportion of the variance of the response variable (R2Y) and the predictive ability parameter (Q2) are listed in Table A.2, all of which are higher than 0.5, thus proving that the theoretic conjecture and mathematical models designed in are applicable.
OPLS-DA loading plots and correlation analysis of 79 Chinese Cabernet Sauvignon dry red wines are shown in Figs. A.2 and A.3, respectively, which exhibit almost the same loading plots features and clustering characters, when compared with OPLS-DA loading plots and correlation analysis of 237 wine samples in and , respectively. These similarities further prove that internal connections do exist in different chromatic parameters, and that the mathematical values and levels of a*, C*ab, CI, Blue %, Red % and dA % are positively correlated, so are the mathematical values and levels of L*, b*, H*ab and Yellow %.
Since the ultimate goal of winemaking is to produce wines that have competitive market advantages, namely, to produce wines of good organoleptic properties, a comprehensive comparison between different wines and their peer products is necessary. However, this comparison is so far not easy to be achieved for mainly two reasons. Firstly, except the evaluation methods of wine color has been digitized and widely used, such as the CIELab[Citation13] and the Glories method,[Citation14] no objective standards for evaluating aroma, taste and astringency have been acknowledged worldwide. Instead, to judge the quality of aroma, taste and astringency, most scientists would organize their own panels to give subjective scores or descriptive words on research wines.[Citation20–Citation23] Secondly, to have an extensive and objective evaluation of wine quality, large numbers of wine samples are necessarily needed to establish a comprehensive organoleptic database, which would cost a lot of time and money.[Citation24]
It must be admitted that, considering the various influences of grape varieties, geographical conditions, vintage and winemaking techniques on wine color quality,[Citation25–Citation29] the number of wine samples (237) in our research was still quite limited. However, with this first attempt to build mathematical models and efforts to discover wine sample distribution regularities in different chromatic parameters, our methodology to classify wine color quality in different chromatic levels proved to be promising. With more wine samples collected and their chromatic data recorded, we can continuously update the existing chromatic database established (supplementary material 1, Table A.1), thus letting the mathematical models be more extensive and objective. Nowadays, since more and more scientists and winemakers are focusing on studying the organoleptic properties of their wines on the basis of big data,[Citation30–Citation35] such a promising methodology can also be applied by them.
Conclusion
The attempt to classify 237 dry red wines into different chromatic levels was realized by establishing comprehensive chromatic database and mathematical models, and validated by using statistical analysis. Such methodology was also applied on 79 Chinese Cabernet Sauvignon dry red wines from different regions and vintages, and the quality of different chromatic levels for these wines was also observed successfully from the sub- mathematical models. Such methodology can be extended to comprehensive wines from different backgrounds, to build chromatic database and mathematical models for wine color classification, which can evaluate wine color quality more extensively and objectively.
Declaration of interest
The authors declare no conflict of interest.
LJFP_A_1381848_Supplementary_material_1.xlsx
Download MS Excel (43.8 KB)LJFP_A_1381848_Supplementary_material_2.docx
Download MS Word (431.8 KB)Supplementary data
Supplemental data for this article can be accessed on the publisher’s website.
Additional information
Funding
Related Research Data
References
- Abbas, M.; Saeed, F.; Anjum, F. M.; Afzaal, M.; Tufail, T.; Bashir, M. S.; Ishtiaq, A.; Hussain, S.; Suleria, H. A. R. Natural Polyphenols: An Overview. Int J Food Prop. 2017, 20(8), 1689–1699. DOI: 10.1080/10942912.2016.1220393.
- Chiva-Blanch, G.; Arranz, S.; Lamuela-Raventos, R. M.; Estruch, R. Effects of Wine, Alcohol and Polyphenols on Cardiovascular Disease Risk Factors: Evidences from Human Studies. Alcohol Alcoholism. 2013, 48(3), 270–277. DOI: 10.1093/alcalc/agt007.
- Rasouli, H.; Farzei, M. H.; Khodarahmi, R. Polyphenols and Their Benefits: A Review. Int J Food Prop. 2017, just-accepted. DOI: 10.1080/10942912.2017.1354017.
- Guéroux, M.; Pinaud-Szlosek, M.; Fouquet, E.; De Freitas, V.; Laguerre, M.; Pianet, I. How Wine Polyphenols Can Fight Alzheimer Disease Progression: Towards a Molecular Explanation. Tetrahedron. 2015, 71(20), 3163–3170. DOI: 10.1016/j.tet.2014.06.091.
- De Freitas, V.; Mateus, N. Chemical Transformations of Anthocyanins Yielding a Variety of Colours. Environ Chem Lett. 2006, 4(3), 175–183. DOI: 10.1007/s10311-006-0060-3.
- Boulton, R. The Copigmentation of Anthocyanins and Its Role in the Color of Red Wine: A Critical Review. Am J Enol Viticult. 2001, 52(2), 67–87.
- Baluja, J.; Diago, M. P.; Goovaerts, P.; Tardáguila, J. Spatio-Temporal Dynamics of Grape Anthocyanin Accumulation in a Tempranillo Vineyard Monitored by Proximal Sensing. Aust J Grape Wine R. 2012, 18(2), 173–182. DOI: 10.1111/j.1755-0238.2012.00186.x.
- Zheng, Y.; Li, J. H.; Xin, H. P.; Wang, N.; Guan, L.; Wu, B. H.; Li, S. H. Anthocyanin Profile and Gene Expression in Berry Skin of Two Red Vitis Vinifera Grape Cultivars that are Sunlight Dependent versus Sunlight Independent. Aust J Grape Wine R. 2013, 19(2), 238–248. DOI: 10.1111/ajgw.12023.
- Segade, S. R.; Pace, C.; Torchio, F.; Giacosa, S.; Gerbi, V.; Rolle, L. Impact of Maceration Enzymes on Skin Softening and Relationship with Anthocyanin Extraction in Wine Grapes with Different Anthocyanin Profiles. Food Res Int. 2015, 71, 50–57. DOI: 10.1016/j.foodres.2015.02.012.
- Sartor, S.; Caliari, V.; Malinovski, L. I.; Toaldo, I. M.; Bordignon-Luiz, M. T. Bioactive Profiling of Polyphenolics and Oenological Properties of Red Wines from Italian Grapes (Vitis Vinifera L.) Cultivated in a Selected Subtropical Region. Int J Food Prop. 2017, just-accepted. DOI: 10.1080/10942912.2017.1344992.
- Aguilar, T.; Loyola, C.; De Bruijn, J.; Bustamante, L.; Vergara, C.; Von Baer, D.; Mardones, C.; Serra, I. Effect of Thermomaceration and Enzymatic Maceration on Phenolic Compounds of Grape Must Enriched by Grape Pomace, Vine Leaves and Canes. Eur Food Res Techn. 2016, 242(7), 1149–1158. DOI: 10.1007/s00217-015-2619-3.
- Xia, J. G.; Sinelnikov, I. V.; Han, B.; Wishart, D. S. MetaboAnalyst 3.0-Making Metabolomics More Meaningful. Nucleic Acids Res. 2015, 43(1), 251–257. DOI: 10.1093/nar/gkv380.
- Ayala, F.; Echávarri, J. F.; Negueruela, A. I. A New Simplified Method for Measuring the Color of Wines. I. Red and Rosé Wines. Am J Enol Viticult. 1997, 48(3), 357–363.
- Glories, Y. La Couleur Des Vins Rouges. 2éme Partie: Mesure, Origine Et Interpretation. Connaissance De La Vigne Et Du Vin. 1984, 18, 253–271.
- Hamasha, M. M. Practitioner Advice: Approximation of the Cumulative Density of Left-Sided Truncated Normal Distribution Using Logistic Function and Its Implementation in Microsoft Excel. Qual Eng. 2017, 29(2), 322–328. DOI: 10.1080/08982112.2016.1196373.
- Wold, S.; Antti, H.; Lindgren, F.; Öhman, J. Orthogonal Signal Correction of Near-Infrared Spectra. Chemom Intell Lab Syst. 1998, 44(1), 175–185. DOI: 10.1016/S0169-7439(98)00109-9.
- Rubert, J.; Lacina, O.; Fauhl-Hassek, C.; Hajslova, J. 2014. Metabolic Fingerprinting Based on High-Resolution Tandem Mass Spectrometry: A Reliable Tool for Wine Authentication? Anal Bioanal Chem. 2014, 406(27), 6791–6803. DOI: 10.1007/s00216-014-7864-y.
- Es-Safi, N. E.; Cheynier, V.; Moutounet, M. Implication of Phenolic Reactions in Food Organoleptic Properties. J Food Compos Anal. 2003, 16(5), 535–553. DOI: 10.1016/S0889-1575(03)00019-X.
- Es-Safi, N. E.; Cheynier, V.; Moutounet, M. Role of Aldehydic Derivatives in the Condensation of Phenolic Compounds with Emphasis on the Sensorial Properties of Fruit-Derived Foods. J Agr Food Chem. 2002, 50(20), 5571–5585. DOI: 10.1021/jf025503y.
- Iorizzo, M.; Macciola, V.; Testa, B.; Lombardi, S. J.; De Leonardis, A. Physicochemical and Sensory Characteristics of Red Wines from the Rediscovered Autochthonous Tintilia Grapevine Grown in the Molise Region (Italy). Eur Food Res Techn. 2014, 238(6), 1037–1048. DOI: 10.1007/s00217-014-2186-z.
- Quijada-Morín, N.; Williams, P.; Rivas-Gonzalo, J. C.; Doco, T.; Escribano-Bailón, M. T. Polyphenolic, Polysaccharide and Oligosaccharide Composition of Tempranillo Red Wines and Their Relationship with the Perceived Astringency. Food Chem. 2014, 154, 44–51. DOI: 10.1016/j.foodchem.2013.12.101.
- Song, Y. Y.; Zhang, Y. J.; Liu, N.; Ye, D. Q.; Gong, X.; Qin, Y.; Liu, Y. L. Volatile Compounds in Wild Strawberry and Their Odorants of Wild Strawberry Wines: Effects of Different Stages of Fermentation. Int J Food Prop. 2017, just-accepted. DOI: 10.1080/10942912.2017.1297951.
- Ouyang, X. Y.; Yuan, G. S.; Ren, J.; Wang, L. Y.; Wang, M. Z.; Li, Y. H.; Zhang, B. L.; Zhu, B. Q. Aromatic Compounds and Organoleptic Features of Fermented Wolfberry Wine: Effects of Maceration Time. Int J Food Prop. 2017, 20(10), 2234–2248. DOI: 10.1080/10942912.2016.1233435.
- Segura, L. I.; Salvadori, V. O.; Goñi, S. M. Characterisation of Liquid Food Colour from Digital Images. Int J Food Prop. 2017, just-accepted. DOI: 10.1080/10942912.2017.1299758.
- Guadalupe, Z.; Ayestarán, B. Changes in the Color Components and Phenolic Content of Red Wines from Vitisvinifera L. Cv.“Tempranillo” during Vinification and Aging. Eur Food Res Techn. 2008, 228(1), 29–38. DOI: 10.1007/s00217-008-0902-2.
- Vázquez, E. S.; Segade, S. R.; Fernández, I. O. Effect of the Winemaking Technique on Phenolic Composition and Chromatic Characteristics in Young Red Wines. Eur Food Res Techn. 2010, 231(5), 789–802. DOI: 10.1007/s00217-010-1332-5.
- Li, S. Y.; Liu, P. T.; Pan, Q. H.; Shi, Y.; Duan, C. Q. Association between Modification of Phenolic Profiling and Development of Wine Color during Alcohol Fermentation. J Food Sci. 2015, 80(4), 703–710. DOI: 10.1111/1750-3841.12833.
- Li, S. Y.; He, F.; Zhu, B. Q.; Wang, J.; Duan, C. Q. Comparison of Phenolic and Chromatic Characteristics of Dry Red Wines Made from Native Chinese Grape Species and Vitis Vinifera. Int J Food Prop. 2017, 20(9), 2134–2146. DOI: 10.1080/10942912.2016.1233117.
- Avizcuri, J. M.; Sáenz-Navajas, M. P.; Echávarri, J. F.; Ferreira, V.; Fernández-Zurbano, P. Evaluation of the Impact of Initial Red Wine Composition on Changes in Color and Anthocyanin Content during Bottle Storage. Food Chem. 2016, 213, 123–134. DOI: 10.1016/j.foodchem.2016.06.050.
- Saavedra, J.; Fuentealba, C.; Yáñez, L.; Bravo, M.; Quiroz, W.; Lukacsy, G.; Carot, J. M. Chemometric Approaches for the Zoning of Pinot Noir Wines from the Casablanca Valley, Chile. Food Chem. 2011, 127(4), 1842–1847. DOI: 10.1016/j.foodchem.2011.01.132.
- Gutiérrez, L.; Quintana, F. A.; Von Baer, D.; Mardones, C. Multivariate Bayesian Discrimination for Varietal Authentication of Chilean Red Wine. J Appl Stat. 2011, 38(10), 2099–2109. DOI: 10.1080/02664763.2010.545116.
- Kruzlicova, D.; Fiket, Ž.; Kniewald, G. Classification of Croatian Wine Varieties Using Multivariate Analysis of Data Obtained by High Resolution ICP-MS Analysis. Food Res Int. 2013, 54(1), 621–626. DOI: 10.1016/j.foodres.2013.07.053.
- Godelmann, R.; Fang, F.; Humpfer, E.; SchüTz, B.; Bansbach, M.; SchäFer, H.; Spraul, M. Targeted and Nontargeted Wine Analysis by 1H NMR Spectroscopy Combined with Multivariate Statistical Analysis. Differentiation of Important Parameters: Grape Variety, Geographical Origin, Year of Vintage. J Agr Food Chem. 2013, 61(23), 5610–5619. DOI: 10.1021/jf400800d.
- Tobolková, B.; Polovka, M.; Belajová, E.; Koreňovská, M.; Suhaj, M. Possibilities of Organic and Conventional Wines Differentiation on the Basis of Multivariate Analysis of Their Characteristics (EPR, UV-Vis, HPLC and AAS Study). Eur Food Res Techn. 2014, 239(3), 441–451. DOI: 10.1007/s00217-014-2237-5.
- Cayuela, J. A.; Puertas, B.; Cantos-Villar, E. Assessing Wine Sensory Attributes Using Vis/NIR. Eur Food Res Techn. 2017, 243(6), 941–953. DOI: 10.1007/s00217-016-2807-9.