
ABSTRACT
Fermented soy sauce was identified by determining underivatized amino acids through the proposed capillary electrophoresis-ultraviolet method coupled with sweeping technology for the first time, based on the coordination interaction between amino acids and Cu2+. The essential amino acids pattern was used to the evaluate quality of soy sauce of different grades, the results showed that the quality of special grade soy sauce was higher than that of others. The sample S13 had the highest quality according to the analysis of the 12 kinds of soy sauce by principal component analysis. According to the method of Taste Activity Value, glutamic acids, lysine, alanine, and aspartic acid were considered to be the main taste amino acids in soy sauce.
Introduction
Soy sauce is a traditional Chinese condiment, it contains a variety of nutritional substances, such as carbohydrates, proteins, amino acids (AAs), fats, vitamins, nicotinic acid, and a variety of minerals.[Citation1] AAs, which account for 50%~75% of total nitrogen contents, are important nutrients in soy sauce.[Citation2] Therefore the content of AA is one of important indicators reflecting quality of soy sauce. The higher content of AA, the greater quality of soy sauce.[Citation3] According to different technological process, two types of soy sauces are used for cooking. One type is fermented soy sauce (FSS), which is prepared by fermenting a salted mixture of soybeans and wheat with several microorganisms, including yeast, over a period of months.[Citation4] The other is blended soy sauce (BSS), which is composed of FSS and acid-hydrolyzed vegetable protein (acid-HVP), and the proportion of FSS is greater than 50%.[Citation5] In “prepackaged food labeling General”, FSS or BSS should be marked with clear labels of products. FSS has high production cost and long production cycle, in order to get the highest benefits, many non FSSs are marked with the labels of FSSs to pass off as FSSs in the market. This phenomenon is mainly manifested that BSS or soy sauce with excessive acid-HVP are posed as FSSs, which seriously infringe the rights of consumers and interests of the normal manufacturers.[Citation6,Citation7] In the current China standards, contents of AA nitrogen between FSS and BSS have significant difference. The contents of AA nitrogen in FSS are more than 0.4g/100ml while the contents of AA nitrogen in BSS are always less than 0.4g/100ml [Citation5], which can provide a reference for distinguishing between FSS and BSS. But, the distinction is incomplete only on the basis of contents of AA nitrogen because contents of AA nitrogen can be controlled by adding acid-HVP.[Citation8] It has been proved that there was significant difference in the compositions of AAs between non FSS and FSS.[Citation9] In FSS, the percentage of essential amino acids (EAAs) in total amino acids (TAAs) is generally more than 35%. When the acid-HVPs are added into soy sauce, the compositions of AAs are changed. In addition, the content of tryptophan is also a good index for FSS adulteration because AAs in FSS are mainly contained from the enzyme-catalyzed protein hydrolysis during microbial fermentation. [Citation10] However, AAs in acid-HVP are mainly produced by the acid-catalyzed protein hydrolysis, owing to HCl hydrolysis, a significant number of tryptophan are destroyed.[Citation11] If tryptophan is determined in soy sauces, which cannot be judged as FSS because BSS contains a certain amount of FSS. Thus content of tryptophan and percentage of EAAs in TAAs are combined to identify FSS.
AAs, as the main favor substances of soy sauce, have significant relationship with the taste of soy sauce. Different AAs express different senses of taste (there are umami, sweet and bitter) [Citation12], which contribute to the unique flavor for soy sauce. The components of AAs are very important for flavor, quality evaluation, and identification of FSS. So establishing a rapid and accurate determination method of AAs in soy sauce is very meaningful. AAs in soy sauce are always determined by high performance liquid chromatography (HPLC)[Citation2,Citation13,Citation14] through the derivative method due to the lack of chromospheres in the most AAs.[Citation15] Although the derivative method can solve the problem of no ultraviolet (UV) or fluorescence absorption, it has its own shortcomings (the operation is complex, the derivatization reagents are expensive, and the derivatization time is long). Addition to derivative method, the method of indirect UV,[Citation16] capillary electrophoresis-electrochemical detection (CE-ECD),[Citation17] HPLC-mass spectrometry (HPLC-MS)[Citation6] and Amino Acid Analyzer[Citation18] can directly determine AAs. However, the sensitivity is low and the stability is poor in method of indirect UV, HPLC-MS, and Amino Acid Analyzer are not equipped in all laboratories and the electrochemical detector is easily disturbed. Therefore, using the underivatized and common method is desirable.
In 1998, Bazzanella et al[Citation19] found the lone pair electrons of N and O atoms on AA could transfer to the empty Cu2+ orbital to form complexes of [Cu(AA)n]2+ with UV absorption. AA can be directly and quickly separated according to the coordination interaction between AA and Cu2+ and the problems caused by derivatization can be avoided.[Citation20,Citation21] However, Cu2+ as background electrolyte (BGE), its own UV absorption makes detection sensitivity decline. Thus, the sweeping technique was used to increase detection sensitivity. In this study, on the basis of interaction coordination between AA and Cu2+, establishing a CE-UV method of direct determination AAs in soy sauce to identify and evaluate quality of FSS.
Principal component analysis (PCA), as a popular multivariate statistical technique, can extract most important characteristics from the multiple indexes.[Citation22] PCA and EAAs pattern that was revised by United Nations Food Agriculture Organization/Word Health Organization (FAO/WHO) were used to the evaluate quality of soy sauce. The impact of AA for soy sauce taste was investigated according to Taste Activity Value (TAV).
Materials and methods
Reagents and materials
L-alanine (Ala), L-threonine (Thr), L-valine (Val), L-methionine (Met), L-aspartate (Asp), L-tryptophan (Trp), L-glutamic acid (Glu) L-proline (Pro), L-isoleucine (IIe), L-serine (Ser), L-leucine (Leu), L-phenylalanine (Phe), L-glycine (Gly), L-lysine (Lys), L-cysteine (Cys), and L-histidine (His) were obtained from Yuanye Biological Technology Co., Ltd. (Shanghai, China). Carbon tetrachloride, copper sulfate, and sodium acetate were obtained from Shuang Shuang Chemical Reagent Co., Ltd (Shandong, China). Acetic acid was purchased from Shandong Yu Wang Pharmaceutical Co., Ltd. (Shandong, China). Distilled water was from the GLP lab of Lanzhou University (Gansu, China). Sample S13 (special grade, the contents of AA nitrogen in soy sauce≥1.3g/ml), sample S7 and sample S8 (special grade, the contents of AA nitrogen in soy sauce≥1.2g/ml), sample S11, sample S12 and sample S6 (first grade, the contents of AA nitrogen in soy sauce≥0.8g/ml), sample S2 and sample S5 (second grade, the contents of AA nitrogen in soy sauce≥0.7g/ml), sample S1 and sample S10 (second grade, the contents of AA nitrogen in soy sauce≥0.55g/ml), sample S9, sample S3, sample S4, sample S16, sample S15, and sample S14 (third grade, the contents of AA nitrogen in soy sauce≥0.4g/ml). All the samples were manufactured by high salt liquid state fermentation and purchased from a local supermarket in China (Gansu, China). All the chemicals were of analytical grade.
Experiments were performed on a K1060 capillary electrophoresis (Kaiao, Beijing, China) and an uncoated fused-silica capillary (50 µm i.d., 73 cm of total length and 65cm of effective length) (Yongnian, Hebei. China) was used. The pH of the solution was measured by a FE20 pH meter (Mettler Toledo Instrument Co., Ltd, Shanghai, China). KH300DB ultrasonic cleaner (Kun Shan He Chuang Ultrasonic Instruments Co., LTD, Kunshan, China) was used.
AA standard stock solutions preparation
AA standard stock solutions were prepared by accurately weighing each of 16 AAs reference standards and putting them into volumetric flask, then dissolving in water and diluting with water to obtain about concentrations of 1 mg/mL. The stock solutions were stored under freeze at −20°C. Before analysis, the stock solutions were diluted to an appropriate concentration with water.
Sample preparation
2 ml carbon tetrachloride was added to 4 ml soy sauce, then the mixtures were vortex-mixed for 2 min and centrifuged at 3000r/min for 10 min. Acquired supernatant liquid was taken as sample solution. Sample solution needed to be degassed and filtered with 0.22 µm membranes before use.
Operation conditions
The new uncoated capillary was rinsed sequentially with methanol (10 min), water (5 min), 1.0 M HCl (15 min), water (5 min), 1.0 M NaOH (15 min), water (5 min), and running buffer (20 min) to obtain unified inner walls of capillary. After every three runs, capillary was conditioned by rinsing with water for 2 min, followed by 1.0 M NaOH for 3 min and water for 2 min, then running buffer for 5 min. The running buffer was composed of 50mM copper sulfate solution at pH 4.40. The separation voltage was 22.5 kV and wavelength was 254 nm.
Results and discussion
Conditions optimization
To obtain optimum CE conditions, the concentration of BGE, pH, injection time, capillary inner diameter and separation voltage were analyzed. Copper sulfate solution was used as BGE, the effect of its concentration was studied in the range from 20 to 60 mM. As shown in Figure S1, 50 mM was considered to be the optimal condition.
The pH of BGE has an important effect on CE. In this study, acetic acid and sodium acetate were used to adjust pH of BGE. Because of the chemical precipitation reaction of copper sulfate in alkaline, BGE must be acidity. However, too low pH value can extend analysis time and cause other opposite effects. So, through a series of investigation, pH 4.40 was selected, as shown in .
High separation voltage is profitable for shortening analysis time and increasing separation efficiency. However, excessive voltage will bring about the problem of Joule heat that cannot be diffused well. In contrast, low voltage is good for separation effect, but the reduction of voltage always accompanies analysis time extension and peak broaden, which is not conducive to separation. In view of these reasons, the separation voltage of 22.5 kV was selected.
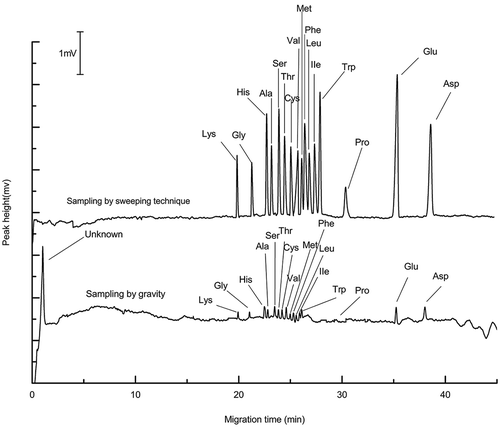
To acquire high resolution, experiments were run on 50 µm inner diameters because its electrodispersion was lower than wide capillary, but sensitivity would decline. In this study, sweeping technology was used to enhance sensitivity. The key of preconcentration was the difference of effective mobilities between AA and Cu2+. In the process of preconcentration, AAs samples were focused into narrow bands within capillary by Cu2+. When the injection time was 70 s, absorbance of [Cu(AA)n]2+ was the highest. As the injection time increased further, sample peaks broadened, resolution descended, and sensitivity no longer increased. So, we selected 70 s as injection time. As shown in , sensitivity of determination was improved 25 ~ 35 fold by sweeping technique.
Figure 1. (a) Electropherograms of amino acids by sampling based on gravity and sampling on the basis of sweeping technique. The running buffer contained 50 mM CuSO4, the pH was 4.40, and separation voltage was 22.5 kV, other conditions were described in the text. UV absorption at 254 nm.
Method validation
The standard mixtures of AAs were diluted into five different concentrations to evaluate linearity. From , the results indicated good linearity for each analyte. Precision of the proposed CE-UV method was determined by calculating the relative standard deviation (RSD) of each AA with parallel five times in a single day for intra-day precision and different five days for inter-day precision. Limit of quantification (LOQ) and Limit of detection (LOD) were determined with a signal-to-noise ratio of 10 and 3, respectively. The results were shown in . To evaluate recovery of the proposed CE-UV method, the 80%, 100%, 120% standard AAs were added into the soy sauce samples, respectively. The ranges of recovery were 82 ~ 120%.
Table 1. The contents and recoveries of amino acids in 14 vinegar samples.
Application to soy sauce samples
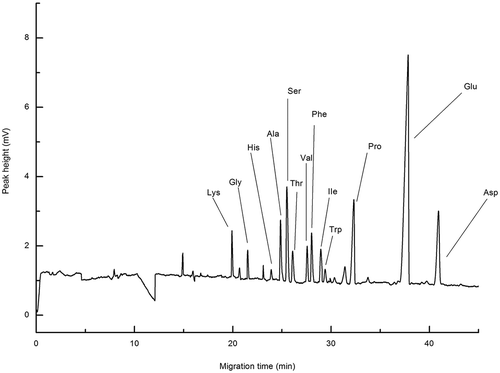
Under optimal conditions, AAs in soy sauce were directly separated (), which is very significant to control quality of soy sauce.
Figure 2. Electrocardiogram of fermented soy sauce. The conditions were shown in .
Identification of FSS
The results of AAs determination in 16 soy sauce samples were shown in . Among these samples, the percentages of EAAs in TAAs were less than 35% in 4 kinds of samples and there was no Trp except for S2. These indicated that all or part of AAs were obtained by adding acid-HVP instead of fermentation in these 4 soy sauces, thus, they were non FSSs. The remaining 12 samples contained Trp and their percentages of EAAs in TAAs were more than 35%, which indicated they were FSS.
Evaluation of soy sauce quality
Removing the four kinds of non FSSs, others were analyzed to evaluate their quality. The nutritional value of the protein constituting the life activity mainly depends on the compositions of AAs, especially EAAs. Therefore, the contents and compositions of EAAs were always selected to evaluate quality of soy sauce.
According to , the types and contents of AAs in 12 kinds of soy sauces were different. Among the detected AAs, contents of Glu were the largest, the contents of TAAs were 13.2 ~ 47.5mg/ml and the contents of EAAs were 4.3 ~ 13.8mg/ml. In 12 kinds of soy sauces, the percentages of EAAs in TAAs and EAAs in non-essential amino acids (NEAAs) were close to 40% and 60%, respectively, which showed that the 12 kinds of soy sauces had good nutritional value. However, just relying on the percentages of EAA in TAA and EAA in NEAA were not able to completely evaluate nutritional value of soy sauce. So compositions of EAAs were combined to evaluate quality of soy sauce, which was considered to be a main reference in quality evaluation. The more proportions of EAAs in soy sauce are close to the EAAs pattern, the more nutritional value of soy sauce will become high.
According to the level of soy sauce, the 12 kinds of soy sauces were divided into four grades (special grade, first grade, second grade, and third grade). The EAAs pattern was used to analyze the quality of soy sauce of four grades and the results were shown in . In special grade soy sauce, the ratios of EAAs were relatively close to ratios of EAAs pattern, except for Leu and IIe (4.6). The ratios of EAAs in other grades were far below ratios of EAAs pattern and the difference between them was small. The results showed that quality of special grade soy sauce was the highest and third grade soy sauce was the lowest, this was consistent with the rank order of soy sauce.
Table 2. Comparison between ratios of essential amino acids in soy sauces and essential amino acids pattern.
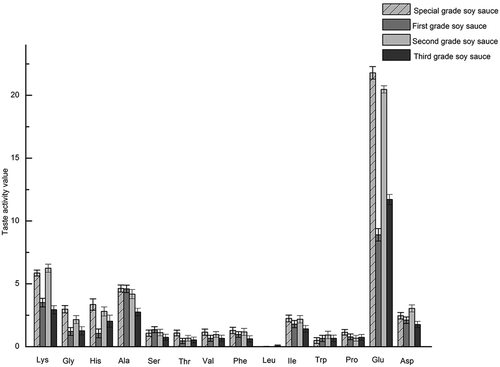
Analyzing flavor AAs in soy sauce by TAV
In this work, TAV was used to investigate contribution of free AA for soy sauce flavor. TAV is considered to be a very useful index in evaluating the compounds for their taste impact. TAVs of each free AA were calculated as the ratio between its concentration in the soy sauce and its threshold value.[Citation23] The compound whose TAV is greater than 1 has a significant impact on the food taste.[Citation24] The greater values meant the bigger contribution. As shown in , AAs whose TAV are greater than 1 in special grade soy sauces were Glu, Gly, Ala, Lys, Ser, Thr, Val, Phe, IIe, Pro, Asp and His; the first grade soy sauces were Glu, Gly, Ala, Lys, Ser, IIe, Asp and His; the second grade soy sauces were Glu, Gly, Ala, Lys, Ser, IIe, Phe, Pro Asp and His; the third grade soy sauces were Glu, Gly, Ala, Lys, IIe, Asp and His. On the whole, Lys (5.9 in special grade, 43.5 in first grade, 6.2 in second grade and 2.9 in third grade) and Ala (4.6 in special grade, 4.6 in first grade, 4.2 in second grade and 2.7 in third grade) contributed significantly sweet taste to soy sauce. TAVs of Asp were 2.4, 2.1, 3.0 and 1.8 in special grade, first grade, second grade and third grade soy sauce, respectively, and TAVs of Glu were 36.2, 10.7, 23.8 and 13.4 in special grade, first grade, second grade and third grade soy sauce, respectively, they contributed umami taste to soy sauce. Lys, Ala, Asp and Glu were considered to be the main taste AAs in soy sauce according to the TAV.
Figure 3. Taste activity value of amino acids in fours grades soy sauce.
Applicability analysis of PCA
In the PCA, if the most absolute values of correlation coefficients between analysis indexes are lower than 0.3, these analysis indexes are not suitable for the PCA.[Citation25] Before the performing, PCA was used to analyze correlation coefficients between 14 variables (contents of AAs) in 12 kinds of soy sauces, the results were shown in . 72.96% of correlation coefficients were greater than 0.3, which indicated these variables were suitable for PCA.
Extraction and analysis of principal components
Three principal components with eigenvalues greater than 1 were selected, and their cumulative contribution percentages reached 88.43% (). The eigenvalue of the first principal component (F1) was 6.8 and its contribution rate was 48.66%, which showed that F1 could explain the 48.66% information of all variations. The eigenvalue of the second principal component (F2) was 4.7 and the contribution rate was 31.50%. In the third principal components (F3), eigenvalue was 1.0 and contribution rate was 8.27%.
Table 3. Component score and comprehensive score of the tested sample.
The loads of each AA on three principal components were shown in , We found that Lys, Gly, His, Ala, Thr, Val, IIe, Pro, Glu, and Phe had higher loads on F1, which indicated that the first principal component mainly reflected the information of these AAs. Because F1 can explain 48.66% of the measured variables, it can be considered that Lys, Gly, His, Ala, Thr, Val, IIe, Pro, Glu, and Phe were characteristic AAs in soy sauce.
Comprehensive analysis
Three principal components were extracted by PCA. Factor scores and contribution rates of F1, F2, and F3 were used to get comprehensive factor scores to evaluate quality of soy sauce, in which contribution rates of each principal component were used as distribution coefficient, as shown in equation 1:
Results were shown in , the highest quality was determined in Table S13. The quality of Table S1 was the lowest.
Cluster analysis
SPSS software was used to finish cluster analysis of 12 kinds of soy sauces (the content of amino acid as index). The results (Figure S3) showed that these 12 kinds of soy sauces were classified into five categories. The first category contained S7, S11, and S8. They were special and first grade soy sauces. The second category contained S4 and S15, they were third grade soy sauces. S5, S10, S6, S12, and S1 were divided into third categories, they were the first and second grade soy sauces. The fourth and fifth categories contained S13 and S9, respectively; they were special and third grade soy sauces, respectively. Using proposed CE-UV method, we achieved direct and accurate separation of AAs in soy sauce and the operation process was simple, which made the identification and quality evaluation of FSS became quick and convenient.
Conclusion
On the basis of the direct determination of AAs in soy sauce through the coordination interaction between AAs and Cu2+ coupled with sweeping, the CE-UV method of identification of FSS was developed and validated for the first time. According to the comparison between the ratios of EAAs in soy sauces and the EAAs pattern, the results of quality evaluation of different grades soy sauces were consistent with the rank order of soy sauces, and the quality of special grade soy sauce was higher than that of others. The sample S13 had the highest quality in 12 kinds of soy sauce according to the contents of AAs analysed by PCA. Lys, Ala, Asp, and Glu were determined to be the main taste amino acids in soy sauce according to the method of TAV.
LJFP_A_1402028_Supplementary_materials.zip
Download Zip (1.7 MB)Related Research Data
References
- Ge, D.; Zong, W.; Zhu, X.; Han, B. Analysis of Free Amino Acids Components in Soy Sause. China Brewi. 2008, 27, 75–77.
- Feng, X.; Zhao, X.; Song, J. Research on Quality Properties and Amino Acids Composition of Tradition Fermented Soy Sauce. China Brew. 2014, 3 9, 16–19.
- Xu, S.; Li, X. Study on Polarographic Behavior of Ninhydrin and Its Application. China Brew. 2008, 33, 73–76.
- Bai, X.; He, Y.; Chen, S. Optimization of Fermentation Parameters Based on the Amino Acid Nitrogen Content of Soy Sauce. Food Sci. Tech. 2015, 40, 312–316.
- Food Industry Standard of China. SB 10336-2000. Blended Soy Sauce; PR China: National Bureau of Internal Trade, 2000.
- Chen, Y.; Wu, H.; Huang, X.; Huang, F.; Zhu, Z.; Luo, H. HPLC-MS/MS to Determine Hydrolysis of Amino Acids in Soy Sauce. China Brew. 2012, 31, 155–158.
- Zhou, F.; Lin, D.; Li, C.; He, C.; Zhu, X. Study on Application of Clustering Analysis of Amino Acids to Identify True and False Femented Soy Sacuce. Food Ind. 2012, 61, 2058–2066.
- Chen, H.;. Quality of Fermented Soy Sauce. Sci. Tech. Info. 2010, 12, 231.
- Ge, D.; Zong, W.; Han, B. Analysis of Amino Acid Components in Soy Sause and Evaluation by AccQ .Tag Method. China Brew. 2009, 34, 103–105.
- Zhu, Y.; Yang, Y.; Zhou, Z.; Li, G.; Jiang, M.; Zhang, C.; Chen, S. Direct Determination of Free Tryptophan Contents in Soy Sauces and Its Application as an Index of Soy Sauce Adulteration. Food Chem. 2010, 118, 159–162. doi:10.1016/j.foodchem.2009.04.090
- Molnár-Perl, I.;. Tryptophan Analysis in Peptides and Proteins, Mainly by Liquid Chromatography. J. Chromatogr. 1997, 763, 1–10.
- Jiang, Y.; Xu, Y.; Zhu, G. Human Taste and Amino Acid Taste. Amino Acids Biotic. Res. 2002, 24, 1–3.
- Chen, L.; Shang, Y.; Zhao, B.; Liu, H. Rapid Determination of 18 Amino Acids in Soy Sauce by Ultra-Performance Liquid Chromatography with Pre-Column Derivatization. Chinese J. Chromat. 2010, 28, 1154–1157.
- Zhang, Y.; Sun, G. Composition and Analysis of Amino Acid in Two Fermented Soy Sauce by HPLC. Guangdong Chem. Ind. 2012, 39, 69–70.
- Konn, C.; Magnér, J.; Charlou, J.; Holm, N.; Alsberg, T. A Method for Detection of Trace Concentrations of Underivatized Amino Acid in Hydrothermal Fluids by Ion-Pairing Reversed-Phase UPLC-ESI-QTOF-MS. Am. J. Anal. Chem. 2015, 06, 313–324.
- Fu, C.; Yang, D.; Wang, L. Improved Determination Method of Free Amino Acids in Soy Sauce by Capillary Electrophoresis with Indirect Ultraviolet Detection. Food Sci. 2005, 26, 195–198.
- Ding, H.; Gao, L.; Han, R.; Ye, J. Determination of Amino Acid Content in Vinegar and Soy Sauce by Capillary Electrophoresis - Electrochemical Detection. J. East China Normal Univer. 2002, 1, 56–60.
- Feng, Z.; Zhou, F.; Wang, Y.; Liao, Q.; Sun, W. Automatic Amino Acid Analyzer in the Determination Od Amino Acids in Different Soy Sauce. China Food Additi. 2013, 5, 195–205.
- Bazzanella, A.; Bächmann, K. Separation and Direct UV Detection of Sugars by Capillary Electrophoresis Using Chelation of Copper (II). J. Chromatogr. 1998, 799, 283–288.
- Jian, X.; Xia, Z.; Wei, W.; Gou, Q. Direct UV Detection of Underivatized Amino Acids Using Capillary Electrophoresis with Online Sweeping Enrichment. J. Sep. Sci. 2009, 32, 1927–1933.
- Zhou, X.; Chen, J.; Shi, Y. Determination of Amino Acids Inplasma and Nutritional Supplements by Capillary Electrophoresis with copper(II) Coordination. Anal Lett. 2014, 48, 25–36.
- Reris, R.; Brooks, J. Principal Component Analysis and Optimization: A Tutorial. Comput. Soc. Conf. Richmond 2015, 13, 212–225.
- Chen, Y.; Chen, S.; Qiu, W.; Li, Q. Identification of Different Varieties of Oyster Juice Based on the Comparison of Free Amino Acids. Advanced Mater. Res. 2013, 784, 1534–1539.
- Gunlu, A.; Gunlu, N. Taste Activity Value, Free Amino Acid Content and Proximate Composition of Mountain Trout (Salmo Trutta Macrostigma Dumeril, 1858) Muscles. Iranian J. Fish. Sci. 2014, 13, 59–72.
- Huang, Y.; Suo, R.; Li, N. Application of Principal Component Analysis in Quality of Assessment of Soy Sauce. Sci, Tech. Food Ind. 2012, 33, 324–326.