
ABSTRACT
The present study aimed to use a chemometric study to compare the in-vitro antioxidant activities and bioactive compounds of flaxseed based on the variety and geographical origins, and further explore the specific components constructed the endogenous antioxidant system of flaxseed in China. The differential contents of α-linolenic acid (35.83–58.91%), lignans (11.37–33.31 mg/g), total phenolic acids (109.93–246.88 mg/100 g) and phytosterols (56.52–125.12 mg/g) of 32 flaxseed varieties were observed. Concomitantly, the in-vitro antioxidant activities varied from 32.56 to 46.22 mg TE/100 g, 0.58 to 1.08 mg TE/g, and 14.22 to 36.14 mmol TE/g as determined by the 2,2’-diphenyl-1-picrylhydrazyl radical (DPPH), ferric reducing antioxidant power (FRAP) and 2,2′-azinobis-(3-ethylbenzthiazoline 6-sulfonic acid) (ABTS) assays, respectively. Significant correlations were found between the antioxidant activities and contents of free syringic acid, p-coumaric acid glucoside and secoisolariciresinol diglucoside (SDG) (p < 0.01). Principal component analysis showed a relatively dispersed distribution between samples, which was not effective enough to determine the geographical origins of the flaxseed samples. Hierarchical cluster analysis allowed flaxseed samples to be grouped based on their in-vitro antioxidant activities and bioactive component contents, primarily in relation to variety specificity.
Introduction
Flaxseed, as an important functional food, has gained much attention for its potential in reducing the incidence of noncommunicable chronic diseases, which is primarily attributed to the synergistic actions of bioactive compounds, including α-linolenic acid (ALA), lignans and other phytochemicals.[Citation1,Citation2] The beneficial action of ALA against obesity-related metabolic diseases involves lipid remodelling and intracellular signalling activation.[Citation3,Citation4] Lignans are prescribed to suppress hormone-dependent tumours by mediating apoptotic and cytostatic actions, improve oxidative stress through decreased lipid peroxidation and alleviate insulin resistance by maintaining insulin receptor activation or increasing the translocation of glucose transporter.[Citation5–Citation7] Moreover, other bioactive compounds in flaxseed, such as phenolic acids and phytosterols, have also been implicated as positive mediators against cardiovascular diseases, insulin resistance, Type 2 diabetes and other degenerative diseases.[Citation8,Citation9]
Although flaxseed enriches the material basis for exerting its antioxidant activity, emerging studies have observed differences in the quality characteristics of flaxseed varieties from different regions of the world, indicating some geographical and varietal specificity. The ALA contents in 11 flaxseed varieties from India range from 37.5% to 54.59%.[Citation10] Additionally, less than 5% ALA content is found in one flaxseed variety (i.e., Solin) from Canada.[Citation11] The lignans contents from 14 flaxseed varieties from Sweden and 15 varieties from Denmark change from 610 to 1330 mg/100 g.[Citation12] The total phenolic contents vary between 800 and 1000 mg/100 g. Furthermore, different phenolic acid compositions are observed in different flaxseed varieties, which may affect the antioxidant activity of phenolic compounds in flaxseed.[Citation13,Citation14]
Flaxseed is an important oilseed crop that is primarily grown in North and Northwest China, including Inner Mongolia, Shanxi, Hebei, Gansu, Ningxia and Xinjiang. The total yield was approximately 3.87 × 10⁵ tones in 2014 according to FAOSTAT statistics, ranking second in the world. There are currently more than 50 flaxseed varieties grown in China, including Tianya, Longya, Ningya, Jinya, Baya, etc. However, systematic comparison of the antioxidant activities and bioactive components of flaxseed varieties in China are not available in published literature, which is not conducive to the high-value utilization of flaxseed in China. Therefore, this study aimed to use a chemometric approach to compare the in-vitro antioxidant capacities and bioactive components of flaxseed in China, in terms of the variety and geographical origin, and further explore the specific bioactive components constructed the endogenous antioxidant system of flaxseed in China.
Materials and methods
Materials
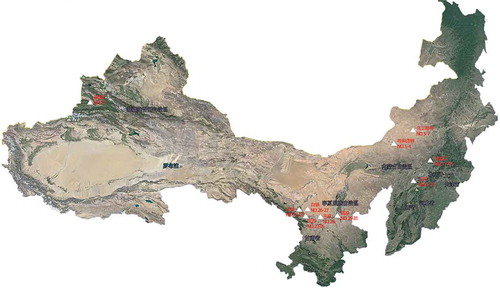
From 2012 to 2014, 32 flaxseed varieties were collected from the major planting areas in China. depicts the detailed regional distribution of 32 flaxseed varieties, seven of which were from Inner Mongolia, 10 from Gansu, five from Shanxi, six from Hebei, three from Ningxia and one from Xinjiang. The Folin–Ciocalteu reagent, 2,4,6-Tris(2-pyridyl)-s-triazine (TPTZ, 99%), 6-hydroxy-2,5,7,8-tetramethylchroman-2-carboxylic acid (Trolox, 97%), 2,2’-diphenyl-1-picrylhydrazyl radical (DPPH, 95%), 5α-Cholestane (97%), syringic acid, 4-hydroxybenzoic acid, protocatechuic acid, gallic acid, p-coumaric acid, ferulic acid and 5-hydroxymethyl-2-furfural were purchased from Sigma–Aldrich (St Louis, MO, USA). Tri-Sil was purchased from ANPEL Laboratory Technologies (Shanghai, China). Secoisolariciresinol (98%) and secoisolariciresinol diglucoside (98%) were purchased from Tauto Biotech Co., Ltd. (Shanghai, China). Phytosterols (95%) were obtained from Blue-sky Biological Engineering Co., Ltd. (Xi’an, China). Fatty acid methyl ester standards were purchased from NU-CHEK-PREP (Elysian, MN, USA). Chromatographic grade methanol, acetonitrile and n-hexane were purchased from Merck (Darmstadt, Germany). Other analytical grade reagents were purchased from Sinopharm Chemical Reagent Co., Ltd. (Shanghai, China).
Figure 1. Planting distribution map of thirty-two flaxseed varieties in China.
Analysis of crude fat content and main fatty acid composition
Samples were analyzed for crude fat content according to the methods of the Association of Official Analytical Chemists (AOAC). All values were expressed as g/100 g flaxseed (dry basis). Fatty acid methyl esters were prepared from Soxhlet extracted flaxseed oil according to the official method ISO 5509:2000 and analysed using an Agilent 6890 GC with a Flame Ionization Detector (FID) and a HP-INNOWAX fused silica capillary column (30 m × 0.32 mm, 0.25 μm). The oven temperature started at 210ºC and remained for 9 min, and then increased to 230ºC at 20ºC/min and held for 10 min. The injector and detector temperatures were set at 250°C. N2 was used as carrier gas (1.5 mL/min). The injection volume was 1 μL with a split ratio of 80:1. The fatty acid methyl esters were identified by comparing them with authentic standards and their relative contents were determined by the peak area normalising method.
Analysis of total antioxidant activity
Extraction of antioxidants
The antioxidants were extracted based on a modified method as previously described.[Citation15] Briefly, 0.1 g of whole flaxseed meal was extracted three times with 4 mL of methanol-water (1:1, v/v) using ultrasonication for 30 min. After centrifugation at 5000 g for 10 min, the combined extracts were filtered using Whatman No.1 filter paper, adjusted to a constant final volume with methanol and stored in dark glass bottles at –20°C until analysis.
DPPH method
The 2,2-Diphenyl-1-picrylhydrazyl (DPPH) assay was performed according to the previously described method.[Citation16] Briefly, 0.5 mL of the extracts were added to 2.5 mL of 0.10 mM DPPH methanol solution. The mixture was shaken vigorously and left in the dark for 30 min. The absorbance was measured at 515 nm against pure methanol (blank) using a DU 800 UV/Visible Spectrophotometer (Beckman Coulter Inc., USA). The DPPH radical scavenging activity was calculated as [(Acontrol –Asample)/Acontrol] × 100%. Trolox reagent was used as the standard for the calibration curve (DPPH = 0.0211×CTrolox–0.0122; R2 = 0.9960). All values were expressed as mg Trolox equivalents (TE) per 100 g of seed (dry basis).
FRAP method
The ferric reducing antioxidant power (FRAP) was determined using a modified version of the FRAP assay.[Citation17] Briefly, a freshly prepared FRAP reagent (2.5 mL of 10 mM TPTZ solution in 40 mM HCl, 2.5 mL of 20 mM FeCl3 and 25 mL of 0.1 M acetate buffer, pH 3.6) was incubated at 37°C for 10 min. Next, 0.5 mL of the extracts and 2 mL of the FRAP reagent were transferred into a 10 mL volumetric flask containing redistilled water. The obtained blue solution was maintained at room temperature for 20 min. The absorbance was measured against a reagent blank at 593 nm using a DU 800 UV/Visible Spectrophotometer (Beckman Coulter Inc., USA). Trolox reagent was used as the standard for the calibration curve (FRAP = 0.0102×CTrolox–0.0790; R2 = 0.9993). All values were expressed as mg Trolox equivalents (TE) per g of seed (dry basis).
ABTS method
The 2,2′-azinobis-(3-ethylbenzthiazoline6-sulfonic acid) (ABTS) radical cation decolourization assay was performed based on the reduction of ABTS+• radical cation by hydrogen-donating antioxidants.[Citation18] The ABTS assay was conducted according to the commercial test kit instructions. Briefly, 10 µL of the extracts and 20 µL of peroxidase solution were added to 170 µL of ABTS solution, allowing the mixture to stand in the dark at room temperature for 6 min. The absorbance reading was taken at 405–425 nm with a SpectraMax M3 microplate reader (Molecular Devices, USA). The Trolox reagent was used as the standard for the calibration curve (FRAP = 0.4576 × CTrolox + 0.0094; R2 = 0.9980). All values were expressed in mM Trolox equivalents (TE) per g of seed (dry basis).
Analysis of phenolic contents and composition
The total phenolic contents were determined using the Folin–Ciocalteau colourimetric method as previously described, with some modifications.[Citation15] Briefly, 1.0 mL of the extracts were transferred into a test tube. Next, 0.5 mL of the Folin–Ciocalteu reagent and 1 mL of 20% sodium carbonate solution were added and brought up to 10 mL by adding distilled water. After 1 h at room temperature, the absorbance was measured at 765 nm using a DU 800 UV/Visible Spectrophotometer (Beckman Coulter Inc., USA). Gallic acid was used for the calibration curve (Y = 0.0909X + 0.0195 R2 = 0.9966). All values were expressed as mg gallic acid equivalents (GAE)/100 g flaxseed (dry basis).
The analysis of free phenolic acids in the extracts following alkaline and acid hydrolysis was performed using HPLC as previously described.[Citation19] Briefly, 0.1 g of whole flaxseed meal was extracted three times with 4 mL of methanol-water (1:1, v/v) through ultrasonication for 30 min. After centrifugation at 5000 g for 10 min, the combined extracts were dried under N2 at 40°C, and then dissolved in 1 mL of methanol. The supernatant was obtained through centrifugation at 5000 g for 10 min. A Shimadzu LC-20A HPLC system (Shimadzu, Kyoto, Japan) equipped with a SPD-M20A ultraviolet detector was used for free phenolic acid analysis. Chromatographic separation was performed on a Shimadzu ODS-SP column (460 mm×250 mm×5 μm). Elution was conducted with a two-buffer gradient system at a flow rate of 0.75 mL/min: solvent A, 0.2% (v/v) trifluoroacetic acid in water; solvent B, 100% methanol; a linear gradient (5–80% B for 50 min; 80–5% B for 10 min; 5% B for 5 min). The detector wavelength was set at 280 nm and the injection volume was 10 μL. Individual free phenolic acid was quantified using an external standard method (for gallic acid, Y = 40319X–25903, R2 = 0.9995; for protocatechuic acid, Y = 25158X–4932.1, R2 = 0.9999; for 4-hydroxybenzoic acid, Y = 20840X–1413.3, R2 = 0.9992; for syringic acid, Y = 45509X, R2 = 0.9991; for p-Coumaric acid, Y = 78378X, R2 = 0.9997; for ferulic acid, Y = 46919X, R2 = 0.9997).
Analysis of lignans contents
The lignans contents were measured as previously described.[Citation20] Briefly, 1.5 g of whole flaxseed flour was extracted successively with three 5 mL of ethanol-water (1:1, v/v) by ultrasonic for 30 min. The extracts were combined after centrifugation at 5000 g for 10 min and subjected to alkaline hydrolysis using 20 mM of NaOH solution for 12 h at 50°C for hydrolysing SDG oligomers. Then, half of the alkaline hydrolysates were further subjected to acid hydrolysis using 1.0 M of HCl solution at 95°C for 140 min. The alkaline and acid hydrolysates were filtered through 0.45 mm Puradisc 25 PP filter (Whatman, Kent, UK) and directly sampled to Ultra Performance Liquid Chromatography (UPLC) system equipped with diode-array detector (Waters, Milford, MA, USA), respectively. The separation was performed on a BEH C18 (1.7 μm, 100 mm × 2.1 mm) maintained at 40°C. Elution was conducted with a two-buffer gradient system at a flow rate of 0.2 mL/min (solvent A, 100% methanol; solvent B, 0.5% acetic acid in deionized water). The detector wavelength was set at 200–400 nm and the injection volume was 2.0 μL. The secoisolariciresinol diglucoside (SDG), secoisolariciresinol (SECO), p-coumaric acid and 5-hydroxymethyl-2-furfural (HMF) were quantified using an external standard method (for SDG, Y = 1433X + 249.1, R2 = 0.9995; for SECO, Y = 2884X + 6523.5, R2 = 0.9991; for p-coumaric acid, Y = 15086X + 16258, R2 = 0.9992; for HMF, Y = 17815X + 14073, R2 = 0.9993). The p-coumaric acid glucoside content was expressed as the p-coumaric acid equivalent.
Analysis of phytosterols contents and composition
The phytosterols contents were analysed according to a modified method, as previously described.[Citation21] Briefly, 0.03 g of soxhlet extracted flaxseed oil was added to a glass tube and thoroughly mixed with 150 μL of 0.5 mg/mL 5α-Cholestane and 3 mL of 2.0 M NaOH/ethanol solution. Then, the tube was capped and heated in a shaking water bath at 90°C for 15 min. After cooling at room temperature, 2 mL of deionized water and 1.5 mL of n-hexane were added to each sample, followed by vortex-mixing and centrifugation at 5000 g for 10 min. The upper n-hexane layer was collected and dried under N2. Next, the residue was subjected to derivative reaction with 100 μL of Tri-Sil by ultrasonic for 30 min and re-dissolved in 1.5 mL of n-hexane after drying under N2. The phytosterols were separated using an Agilent 6890 GC with a flame ionization detector and a DB-5HP fused silica capillary column (30.0 m × 0.32 mm, 0.10 µm). The injector and detector temperatures were set at 260°C and 310°C, respectively. The initial column temperature was set at 60°C and then increased to 310°C at 40°C /min and held for 6 min. N2 was used as the carrier gas (2.0 mL/min). The injection volume was 1 µL with a split ratio of 25:1. Individual phytosterols were identified through comparisons with authentic standards and quantified relative to 5α-Cholestane (internal standard).
Statistical analysis
All data were presented as the mean ± SD, and analyses were performed with SPSS 16.0 for Windows (SPSS Inc., Chicago, IL, USA). One-way ANOVA, followed by Tukey test, was performed to analyse the significant differences between data (p < 0.05). Pearson’s correlation analysis was used to assess the strength of correlation between the total antioxidant capacities and amounts of bioactive components in collected samples. The statistical significance of each correction was obtained by calculating the p-value (p < 0.05 and p < 0.01 were considered significant and highly significant, respectively). Principal component analysis (PCA) and hierarchical cluster analysis (HCA) were used to analyse the interrelationship between the variables and the clustering characteristics in collected samples using MetaboAnalyst 3.0.
Results and discussion
Crude oil contents and fatty acid composition in studied flaxseed varieties
Flaxseed was unique among the oilseeds for its exceptionally high content of ALA, the plant-derived n-3 polyunsaturated fatty acid (n-3PUFA). Then, the crude oil contents and fatty acid composition of selected flaxseed varieties manifested certain differences (). The crude oil contents in analysed flaxseed varieties ranged from 32.84 g/100 g in Baya11 (11) to 44.96 g/100 g in Yiya4 with the average of 37.86 g/100 g, which was slightly lower than the values obtained from an earlier study.[Citation11] Obvious but statistically non-significant regional differences were found in studied flaxseed varieties. Lower crude oil contents were found in the varieties from Shanxi and Hebei located in North China with the mean of 36.53 and 35.84 g/100g, respectively. Of all lipids in flaxseed, the ALA contents were observed in the range of 35.83 g/100 g oil to 58.91 g/100 g oil, in which Dingya22 had the lowest, and Huanghuma, Longya10, 873 and Ningya17 had the maximum content. Our results were comparable with the values found in flaxseed varieties from India, varying from 33.22 g/100 g oil to 54.79 g/100 g oil.[Citation10,Citation22] No remarkable differences in ALA contents were observed among the different planting areas due to the obvious variety differentiation from the same geographical location. Notably, the differences in ALA contents in the same flaxseed variety (Longya 10) from Lanzhou and Pingliang cities of Gansu (57.09% vs. 48.08%) revealed the great effect of geographical origin on the ALA content in flaxseed.
Table 1. Crude fat content, main fatty acid composition and phytosterols in studied flaxseed varieties.
Lignans contents in studied flaxseed varieties
Flaxseed lignan secoisolariciresinol (SECO) was usually found in the form of secoisolariciresinol diglucoside (SDG), which was interconnected through the 3-hydroxy-3-methyl glutaric acid (HMGA) and further complexed in a macromolecular structure with phenolic glycosides such as p-coumaric acid and ferulic acid.[Citation23] As shown in , the highest SDG contents were observed in Baya9 (13) (33.31 mg/g), followed by Baya11 (11) (28.09 mg/g), Lunxuan3 (26.69 mg/g) and Ningya19 (25.03 mg/g), which was two times higher than the contents in 873, 9614w-4, Ningya17, Ning101-11, Jinya12, Baya11 and Baya 9(12). The contents of p-coumaric acid glucoside in flaxseed lignans complex (FLC) ranged between 1.16 mg/g and 6.57 mg/g, and the lowest values were found in Ning101-11 and 873, while the highest contents were observed in Longya9, Baya9 (13) and Ningya19. After additional acid hydrolysis, the SECO contents ranged from 0.76 mg/g (Neiya6) to 5.03 mg/g (Baya9) (13), the p-coumaric acid contents varied between 0.12 mg/g (9614w-4) and 0.87 mg/g (Baya9) (13). The contents of HMF, the degradation product of glucose from glucoside in extracts ranged from 0.13 mg/g (Lunxuan3) to 1.63 mg/g (Lunxuan2 and Neiya6). Among the different planting areas, the flaxseed varieties from Hebei and Inner Mongolia demonstrated relatively higher amounts of SDG, while varieties from Shanxi and Xinjiang had relatively lower levels of SDG. The highest p-coumaric acid glucoside contents were found in the variety from Xinjiang (5.42 mg/g), followed by Inner Mongolia (4.16 ± 1.63 mg/g), whereas the lowest contents were found in the varieties from Gansu (2.82 ± 0.54 mg/g) and Shanxi (2.73 ± 1.06 mg/g). The varieties from Hebei (3.16 ± 1.06 mg/g) and Gansu (3.08 ± 0.91 mg/g) possessed the maximum SECO concentrations, while varieties from Inner Mongolia (1.90 ± 0.85 mg/g), Ningxia (2.00 ± 0.78 mg/g) and Xinjiang (1.47 mg/g) had the lowest values. Moreover, the varieties from Inner Mongolia revealed the highest HMF levels (1.02 ± 0.51 mg/g). However, there was no statistical significance in the levels of SDG, SECO, p-coumaric acid glucoside and HMF among the different planting locations due to variety differentiation. No evident differences in p-coumaric acid contents were obtained among the different growing regions. The SDG contents in the selected flaxseed varieties were similar to those in 37 flaxseed varieties from the south and middle of Sweden, ranging between 14.8 mg/g and 25.9 mg/g DFM, according to direct alkaline hydrolysis.[Citation24] Whereas, lower hydrolysates of SDG oligomers in one flaxseed sample from Inner Mongolia in China was obtained. In which the SDG content was found to be 15.2 mg/g DFM and the p-coumaric acid glucoside content was 1.9 mg/g DFM, according to alkaline hydrolysis. Additionally, the contents of SECO, p-coumaric acid and HMF were 4.8 mg/g, 1.2 mg/g and 0.8 mg/g DFM, respectively, after successive acid hydrolysis of the samples.[Citation20] However, our results were apparently higher than those obtained by other researchers. The SDG contents in 14 flaxseed varieties grown in Sweden and 15 flaxseed varieties from Denmark ranged from 6.1 mg/g to 12.0 mg/g, and 8.4 mg/g to 12.7 mg/g, respectively.[Citation12] The SECO and p-coumaric acid contents in six flaxseed varieties from Switzerland varied from 4.96 mg/g to 10.06 mg/g, 0.1 to 0.45 mg/g DFM, respectively, according to alkaline methanolysis and enzymatic hydrolysis.[Citation25] The SECO contents of one brown flaxseed variety from Canada (analysed through alkaline and enzymatic hydrolysis) and one variety from Netherlands (analysed through by enzymatic hydrolysis) reached levels up to 3.75 mg/g and 2.94 mg/g, respectively.[Citation26,Citation27] The inconsistency in the lignans contents in different flaxseed varieties analysed in these studies could be attributed to the differences in variety and geographical locations, but are more likely the result of extraction efficiency from different flaxseed matrices through various solvents and hydrolysis methods.
Table 2. Phenolic compound content and composition in studied flaxseed varieties.
Phenolic contents and composition in studied flaxseed varieties
In addition to the phenolic acid glycosides linked in the flaxseed lignans complex, flaxseed also contains high amounts of phenolic compounds, such as ferulic acid, syringic acid, cinnamic acid, vanillic acid, p-coumaric acid and gallic acid.[Citation28] As shown in , the total phenolic contents in studied flaxseed varieties ranged from 109.93 to 246.88 mg GAE/100 g, and the lowest total phenolic contents were found in 75–11–5, Neiya6, 9614w-4, Ningya17 and Yiya4, whilst the highest levels were showed in Longya9, Jinya10, Jinya11, Baya11, Baya12 (13) and Baya11 (11). Importantly, significant differences in total phenolic contents were also observed among the different planting regions. The flaxseed varieties from Shanxi and Hebei revealed significantly higher total phenolic contents when compared to those from Ningxia and Xinjiang (p < 0.05). Our results were comparable to the values of one flaxseed variety from Canada (209 mg GAE/100 g), one flaxseed sample from the United States (153.87 mg GAE/100 g), according to methanol-water extraction, five flaxseed varieties from Egypt (162–362 mg GAE/100 g), according to water extraction and one flaxseed sample from Canada (141–299 mg GAE/100 g DFM), according to different solvent extraction.[Citation19,Citation29–Citation31] However, higher total phenolic contents were obtained from one flaxseed variety from Brazil, according to enzymatic extraction (660 mg tannic acid equivalent/100 g) and eight flaxseed varieties, according to methanol extraction (789–1034 mg chlorogenic acid equivalent/100 g).[Citation14,Citation32]
Available evidence has confirmed that the soluble free phenolic acids constituted more than 50% of the total phenolic compounds in whole flaxseed. Most importantly, the free phenolic acids possessed higher antioxidant activity when compared with insoluble-bound phenolic compounds extracted from whole flaxseed (58% vs. 7–21%).[Citation19] Therefore, the free phenolic acids might provide pivotal contributions to the endogenous antioxidant system of flaxseed. In the current study, the predominant free phenolic acids in selected flaxseed varieties as analysed by HPLC were syringic acid, 4-hydroxybenzoic acid, protocatechuic acid, gallic acid, p-coumaric acid and ferulic acid. Syringic acid and 4-hydroxybenzoic acid were the most abundant phenolic acids in whole flaxseed, accounting for 57.55% and 17.58%, respectively, of the detected total free phenolic acids and ranging from 13.26 µg/g (Ningya17) to 183.13 µg/g (Longya9), and from 2.40 µg/g (Yiya4) to 63.73 µg/g (Jinya10), respectively. Obvious but statistically non-significant differences were observed among different growing areas. Relatively higher contents of syringic acid were found in varieties from Shanxi and Hebei when compared to those from Gansu, Ningxia and Xinjiang. In addition, the varieties from Shanxi, Inner Mongolia and Hebei also revealed higher levels of 4-hydroxybenzoic acid than those from Gansu, Ningxia and Xinjiang. Similar findings were observed for protocatechuic acid and p-Coumaric acid. Therefore, the flaxseed varieties grown in North China possessed comparatively higher contents of free phenolic acids than those located in Northwest China, which could be partly due to the differences in soil conditions. Similar results were observed in flaxseed varieties from western Canada.[Citation14] However, our results for free phenolic acid composition in flaxseed differed from the data obtained by other researcher, who reported that p-coumaric acid and ferulic acid were the predominant free phenolic acids in one flaxseed sample from Canada, according to methanol and water extraction.[Citation19] We partly attributed the differences in the free phenolic acid profiles to the specific varieties and locations. In addition, the different extraction solvents and sample properties (whole flaxseed or defatted matrix) also affected the extraction effectiveness of the phenolic compounds in flaxseed.[Citation33]
Phytosterols contents and composition in studied flaxseed varieties
Flaxseed is also a major source of phytosterols, particularly for β-sitosterol.[Citation34] As shown in , the amounts of phytosterols in the studied flaxseed were found to vary from 56.52 mg/g to 125.12 mg/g. In terms of the relative composition of phytosterols in flaxseed, β-sitosterol predominated, followed by cycloartenol, campesterol, 2, 4-methylenecycloartenol, stigmasterol and Δ5-avenasterol, which was consistent with the results reported by other researchers.[Citation35] The highest contents of phytosterols were found in Baya9 (13), followed by Huanghuma, Jinya12, 75–11–5, Longya10, Lunxuan3, Jinya10 and Jinya11. The lowest levels of phytosterols were observed in Ningya19, Ningya17, Baya12 (13), Yiya4 and Baya11. Our results were evidently higher than the values for one flaxseed variety from the United States (2.10 mg/g) with β-sitosterol, campesterol and Δ5-avenasterol accounting for 80% of the total phytosterols.[Citation36] Among the different growing regions, flaxseed varieties from Inner Mongolia and Shanxi in North China contained significant higher contents of phytosterols when compared to those from Ningxia and Xinjiang in Northwest China (p < 0.05). Moreover, a noticeable variation in phytosterols content was also observed in the same flaxseed variety grown in Pingliang and Lanzhou cities of Gansu (for Longya 10, 89.74 mg/g versus 116.96 mg/g). The harvest maturity of flaxseed might be a critical factor influencing the accumulation of phytosterols in flaxseed and contributing to the different contents of phytosterols in Longya10 from Pingliang and Lanzhou in Gansu.[Citation34]
Total antioxidant capacities in studied flaxseed varieties
The antioxidant activities of the studied flaxseed varieties were evaluated by using DPPH, FRAP and ABTS assays (). The DPPH values ranged from 32.56 mg TE/100 g to 46.22 mg TE/100 g, and 9622, Jinya9, Jinya10, Jinya11, Jinya12, Baya9 (12), Baya11, Baya12 (12), Baya11 (11) and Ningya19 showed the highest antioxidant capacities, whereas Huanghuma, 75–11–5 and 873 had the lowest capacities. Our results were comparable to the data from two flaxseed varieties from southern Brazil[Citation37], but higher than the values of one flaxseed sample from the United States.[Citation29] Among the different growing regions, the varieties from Shanxi and Hebei possessed significantly higher DPPH values than those from Inner Mongolia (p < 0.05).
The FRAP values varied from 0.58 mg TE/g to 1.08 mg TE/g. The highest antioxidant capacities were observed in longya9 and Baya12 (13), followed by Dingya23, Jinya7 and Baya11 (11). Similar to the results observed in DPPH assay, 75–11–5, Lunxuan2, Ning101-11 and 873 revealed the lowest antioxidant abilities with the mean of 0.67 mg TE/g. Nevertheless, our results were higher than those observed in two flaxseed varieties from southern Brazil and one variety from the United States (0.13–0.76 mmol/g).[Citation29,Citation37] No apparent differences were observed among different planting areas except for Inner Mongolia, which had relatively lower FRAP values (0.80 ± 0.16 mg TE/g).
In the ABTS assay, the values ranged from 14.22 mmol TE/g to 36.14 mmol TE/g. Baya9 (13), Baya11, Baya12 (12), Baya12 (13), Baya11 (11) and Ningya19 showed the highest ABTS radical scavenging activities with the mean of 32.84 mmol TE/g, whereas Huanghuma, 75–11–5, Ning101-11 and 873 revealed the lowest ABTS values with the average of 16.44 mmol TE/g. Our results were apparently higher than those in two golden and brown flaxseed varieties from southern Brazil (3.38–3.70 mmol TE/g)[Citation37], as well as one flaxseed variety from the United States (0.90 mmol TE/g).[Citation29] Differences among the different planting areas were also observed. The flaxseed varieties from Hebei indicated significant higher ABTS values than those from other locations (p < 0.05).
Correction analysis between total antioxidant capacities and amounts of bioactive components in studied flaxseed varieties
A correlation analysis between total antioxidant capacities and contents of bioactive components was performed to explore the endogenous antioxidant system in studied flaxseed samples. As depicted in , there was a highly significant correlation among the three analytical methods used to evaluate the antioxidant potential of different flaxseed samples (p < 0.01). Moreover, the total antioxidant capacities, as determined by the DPPH, FRAP and ABTS methods, were significantly correlated with total phenolic contents in studied flaxseed varieties, according to the Folin-Ciocalteu method (for DPPH, r = 0.483, p < 0.01; for FRAP, r = 0.545, p < 0.01; for ABTS, r = 0.412, p < 0.05). As previously stated, free phenolic acids might be the primary contributors to the antioxidant activities of whole flaxseed. Our findings further explored the potential relationship between the antioxidant capacities and specific free phenolic acid in studied flaxseed varieties. A significant correlation was obtained between the antioxidant activities and free syringic acid content (for ABTS, r = 0.479, p < 0.01; for FRAP, r = 0.608, p < 0.01). A strong correlation was observed between ABTS and SDG, p-coumaric acid glucoside, SECO and p-coumaric acid (for SDG, r = 0.490, p < 0.01; for p-coumaric acid glucoside, r = 0.515, p < 0.01; for SECO, r = 0.399, p < 0.05; for p-coumaric acid, r = 0.517, p < 0.01). A direct correlation was obtained between the SDG and total phenolic acids (r = 0.404, p < 0.05), which indicated that lignans and free phenolic acids might cooperatively constitute the material basis of the antioxidant system in selected flaxseed samples. Notably, the relatively weaker correlation between total antioxidant activities and phenolic compounds in studied flaxseed samples further confirmed that the phenolic compounds in flaxseed extracts were mainly present in the form of macromolecular complex, which could not reveal effective antioxidant activity.[Citation38] Therefore, due to the existence of glucoside in SECO and phenolic acids in flaxseed, it might be more effective to evaluate the antioxidant potential of flaxseed extracts before and after alkaline and acid hydrolysis. A high ALA content was considered to be associated with an efficient endogenous antioxidant system in order to maintain seed integrity.[Citation11] However, no linear relationship between ALA content and total antioxidant activities was obtained in studied flaxseed varieties, which should be confirmed in future studies using well-controlled sample collection.
Table 3. Corrections between total antioxidant capacities and phenolic compounds in studied flaxseed varieties.
Principal component and cluster analyses
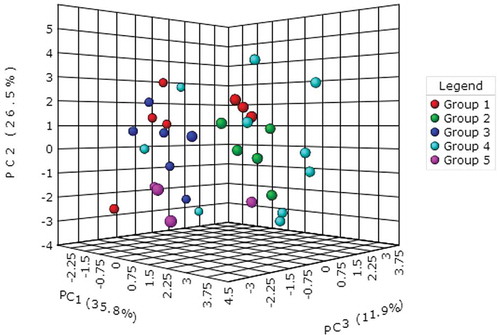
All data obtained from the studied flaxseed varieties were subjected to principal component analysis (PCA). The first three principal components explained 74.2% of the total variation (PC1 = 35.8%, PC2 = 26.5% and PC3 = 11.9%, respectively). PC1 was highly affected by p-coumaric acid glucoside, ABTS, total phenolic contents, SDG, DPPH and free syringic acid. PC2 was primarily correlated with free gallic acid, SECO and total p-coumaric acid. PC3 was associated with free p-coumaric acid and ferulic acid. The 3D-PCA scatter plot () revealed the dispersion between the 32 flaxseed varieties from the six planting locations in China (Yiya 4 from Xinjiang was classified with the varieties from Ningxia for the statistical analysis). Notably, the relatively dispersed distribution of the data points in the plot further confirmed that the flaxseed varieties from the primary planting locations in China had a wide range of total antioxidant capacities, lignans and phenolic acid contents. The flaxseed variety Neiya9 had the largest deviation from the other varieties grown in Inner Mongolia, also showed the lowest total antioxidant capacities and contents of SDG, total phenolic compound, free syringic acid and p-coumaric acid. The longest distance between 9614w-4 and the other varieties (Ningya 17 and Ningya 19) from Ningxia showed great differences in terms of the total antioxidant capacities and amounts of phenolic compounds due to their different genetic backgrounds. The 10 varieties from Gansu nearly dispersed the whole scatter plot, revealing the complex interaction of variables in relation to variety and geographical locations.
Figure 2. Principal component analysis of thirty-two flaxseed varieties in China according to geographical origin. Group 1: Huanghuma, Longya9, 75–11-5, Lunxuan3, Lunxuan2, Neiya6 and Neiya9 from Inner Mongolia; Group 2: Jinya7, Jinya9, Jinya10, Jinya11 and Jinya12 from Shanxi; Group 3: Baya9(12), Baya9(13), Baya11, Baya12(12), Baya12(13) and Baya11(11) from Hebei; Group 4: Longya13, Longya11, Longya10 (1), Ning101-11, 873, Dingya22, Dingya23, Baya11, 9622 and Longya10 (2) from Gansu; Group 5: Ningya19, 9614w-4, Ningya17 and Yiya4from Ningxia (Yiya4 from Xinjiang was included into Group 5 for statistical analysis).
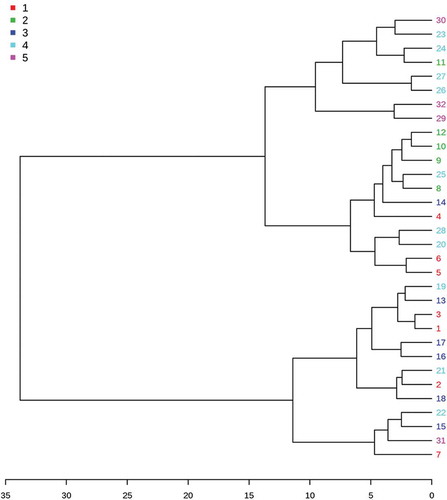
The similarities between the studied flaxseed varieties were further evaluated through hierarchical cluster analysis (HCA). The 32 flaxseed varieties were classified into four clusters (). Cluster 1 was characterised by higher levels of phytosterols and free gallic acid, accompanied by lower levels of free protocatechuic acid and 4-hydroxybenzoic acid, ALA, HMF, SDG and ABTS. Cluster 2 was characterised by higher levels of phytosterols, total phenolic compound, free protocatechuic acid, 4-hydroxybenzoic acid and syringic acid, SDG, p-coumaric acid glucoside, SECO, total p-coumaric acid, HMF and total antioxidant activities. Cluster 3 was characterised by lower levels of phytosterols, free protocatechuic acid and 4-hydroxybenzoic acid, SDG, p-coumaric acid glucoside, SECO, total p-coumaric acid, HMF and total antioxidant activities, but high levels of ALA. Cluster 4 was characterised by lower levels of phytosterols, as well as higher levels of ALA, p-coumaric acid glucoside, SECO, total p-coumaric acid and total antioxidant activities.
Figure 3. Cluster analysis of thirty-two flaxseed varieties in China. 1-Huanghuma, 2-Longya9, 3-75–11-5, 4-Lunxuan3, 5-Lunxuan2, 6-Neiya6, 7-Neiya9, 8-Jinya7, 9-Jinya9, 10-Jinya10, 11-Jinya11, 12-Jinya12, 13-Baya9(12), 14-Baya9(13), 15-Baya11, 16-Baya12(12), 17-Baya12(13), 18-Baya11(11), 19-Longya13, 20-Longya11, 21-Longya10, 22-Ning101-11, 23-873, 24-Dingya22, 25-Dingya23, 26-Baya11, 27-9622, 28-Longya10, 29-Ningya19, 30-9614w-4, 31-Ningya17, 32-Yiya4.
Conclusion
The studied flaxseed varieties (n = 32) showed differential in-vitro antioxidant capacities, ALA, phytosterols, lignans and total phenolic contents. The correlation analysis between total antioxidant capacities and contents of bioactive components revealed that the lignans and free phenolic acids cooperatively constituted the primary material basis of endogenous antioxidant system in studied flaxseed varieties. The principal component analysis revealed the relatively dispersed distribution of variables between the flaxseed samples, making it difficult to determine their geographical origins. Using hierarchical cluster analysis, 32 flaxseed samples were grouped into four clusters based on their in-vitro antioxidant activities and contents of ALA, phytosterols, lignans, phenolic acids mainly in relation to specific variety.
LJFP_A_1402029_Supplemental_materials.zip
Download Zip (18.6 KB)Additional information
Funding
Related Research Data
References
- Cardoso Carraro, J. C.; Dantas, M. I. D. S.; Espeschit, A. C. R.; Martino, H. S. D.; Ribeiro, S. M. R. Flaxseed and Human Health: Reviewing Benefits and Adverse Effects. Food Rev. Int. 2012, 28, 203–230.
- Singh, K. K.; Mridula, D.; Rehal, J.; Barnwal, P. Flaxseed: A Potential Source of Food, Feed and Fiber. Crit. Rev. Food Sci. Nutr. 2011, 51, 210–222.
- Deckelbaum, R. J.; Torrejon, C. The Omega-3 Fatty Acid Nutritional Landscape: Health Benefits and Sources. J. Nutr. 2012, 142, 587S–591S.
- Pan, A.; Chen, M.; Chowdhury, R.; Wu, J. H.; Sun, Q.; Campos, H.; Mozaffarian, D.; Hu, F. B. alpha-Linolenic Acid and Risk of Cardiovascular Disease: A Systematic Review and Meta-Analysis. Am. J. Clin. Nutr. 2012, 96, 1262–1273.
- Bergman, J. M.; Thompson, L. U.; Dabrosin, C. Flaxseed and Its Lignans Inhibit Estradiol-Induced Growth, Angiogenesis, and Secretion of Vascular Endothelial Growth Factor in Human Breast Cancer Xenografts in Vivo. Clin. Cancer Res. 2007, 13, 1061–1067.
- Adolphe, J. L.; Whiting, S. J.; Juurlink, B. H.; Thorpe, L. U.; Alcorn, J. Health Effects with Consumption of the Flax Lignan Secoisolariciresinol Diglucoside. Br. J. Nutr. 2010, 103, 929–938.
- Pan, A.; Sun, J.; Chen, Y.; Ye, X.; Li, H.; Yu, Z.; Wang, Y.; Gu, W.; Zhang, X.; Chen, X.; Demark-Wahnefried, W.; Liu, Y.; Lin, X. Effects of A Flaxseed-Derived Lignan Supplement in Type 2 Diabetic Patients: A Randomized, Double-Blind, Cross-Over Trial. Plos One. 2007, 2, e1148.
- Kris-Etherton, P. M.; Hecker, K. D.; Bonanome, A.; Coval, S. M.; Binkoski, A. E.; Hilpert, K. F.; Griel, A. E.; Etherton, T. D. Bioactive Compounds in Foods: Their Role in the Prevention of Cardiovascular Disease and Cancer. Am. J. Med. 2002, 113, 71–88.
- Moreau, R. A.; Whitaker, B. D.; Hicks, K. B. Phytosterols, Phytostanols, and Their Conjugates in Foods: Structural Diversity, Quantitative Analysis, and Health-Promoting Uses. Prog. Lipid Res. 2002, 41, 457–500.
- Singh, K. K.; Mridula, D.; Barnwal, P.; Rehal, J. Selected Engineering and Biochemical Properties of 11 Flaxseed Varieties. Food Bio. Technol. 2013, 6, 598–605.
- Barthet, V. J.; Klensporf-Pawlik, D.; Przybylski, R. Antioxidant Activity of Flaxseed Meal Components. Can. J. Plant Sci. 2014, 94, 593–602.
- Johnsson, P.; Kamal-Eldin, A.; Lundgren, L. N.; Åman, P. HPLC Method for Analysis of Secoisolariciresinol Diglucoside in Flaxseeds. J. Agric. Food Chem. 2000, 48, 5216–5219.
- Herchi, W.; Arráez-Román, D.; Trabelsi, H.; Bouali, I.; Boukhchina, S.; Kallel, H.; Segura-Carretero, A.; Fernández-Gutierrez, A. Phenolic Compounds in Flaxseed: A Review of Their Properties and Analytical Methods. An Overview of the Last Decade. J. Oleo. Sci. 2014, 63, 7–14.
- Oomah, B. D.; Kenaschuk, E. O.; Mazza, G. Phenolic Acids in Flaxseed. J. Agric. Food Chem. 1995, 43, 2016–2019.
- Koski, A.; Psomiadou, E.; Tsimidou, M.; Hopia, A.; Kefalas, P.; Wähälä, K.; Heinonen, M. Oxidative Stability and Minor Constituents of Virgin Olive Oil and Cold-Pressed Rapeseed Oil. Eur. Food Res. Technol. 2002, 214, 294–298.
- Szydlowska-Czerniak, A.; Trokowski, K.; Karlovits, G.; Szlyk, E. Determination of Antioxidant Capacity, Phenolic Acids, and Fatty Acid Composition of Rapeseed Varieties. J. Agric. Food Chem. 2010, 58, 7502–7509.
- Szydlowska-Czerniak, A.; Dianoczki, C.; Recseg, K.; Karlovits, G.; Szlyk, E. Determination of Antioxidant Capacities of Vegetable Oils by Ferric-Ion Spectrophotometric Methods. Talanta. 2008, 76, 899–905.
- Re, R.; Pellegrini, N.; Proteggente, A.; Pannala, A.; Yang, M.; Rice-Evans, C. Antioxidant Activity Applying an Improved ABTS Radical Cation Decolorization Assay. Free Radic. Biol. Med. 1999, 26, 1231–1237.
- Alu’datt, M. H.; Rababah, T.; Ereifej, K.; Alli, I. Distribution, Antioxidant and Characterisation of Phenolic Compounds in Soybeans, Flaxseed and Olives. Food Chem. 2013, 139, 93–99.
- Li, X.; Yuan, J. P.; Xu, S. P.; Wang, J. H.; Liu, X. Separation and Determination of Secoisolariciresinol Diglucoside Oligomers and Their Hydrolysates in the Flaxseed Extract by High-Performance Liquid Chromatography. J. Chromatogr. 2008, 1185, 223–232.
- Azadmard-Damirchi, S.; Habibi-Nodeh, F.; Hesari, J.; Nemati, M.; Achachlouei, B. F. Effect of Pretreatment with Microwaves on Oxidative Stability and Nutraceuticals Content of Oil from Rapeseed. Food Chem. 2010, 121, 1211–1215.
- Dixit, S.; Kendurkar, P. S.; Vajpeyi, M.; Prasad, R. N. Variability in Elite Linseed (Linum usitatissimumL.) Germplasm for Oil Content and Fatty Acid Composition. Indian J. Agric. Biochem. 2007, 20, 35–37.
- Ramsay, A.; Fliniaux, O.; Quéro, A.; Molinié, R.; Demailly, H.; Hano, C.; Paetz, C.; Roscher, A.; Grand, E.; Kovensky, J.; Schneider, B.; Mesnard, F. Kinetics of the Incorporation of the Main Phenolic Compounds into the Lignan Macromolecule during Flaxseed Development. Food Chem. 2017, 217, 1.
- Eliasson, C.; Kamal-Eldin, A.; Andersson, R.; Åman, P. High-Performance Liquid Chromatographic Analysis of Secoisolariciresinol Diglucoside and Hydroxycinnamic Acid Glucosides in Flaxseed by Alkaline Extraction. J. Chromatogr. 2003, 1012, 151–159.
- Kraushofer, T.; Sontag, G. Determination of Some Phenolic Compounds in Flax Seed and Nettle Roots by HPLC with Coulometric Electrode Array Detection. Eur. Food Res. Technol. 2002, 215, 529–533.
- Thompson, L. U.; Boucher, B. A.; Liu, Z.; Cotterchio, M.; Kreiger, N. Phytoestrogen Content of Foods Consumed in Canada, Including Isoflavones, Lignans, and Coumestan. Nutr. Cancer. 2006, 54, 184–201.
- Milder, I. E.; Arts, I. C.; van de Putte, B.; Venema, D. P.; Hollman, P. C. Lignan Contents of Dutch Plant Foods: A Database Including Lariciresinol, Pinoresinol, Secoisolariciresinol and Matairesinol. Br. J. Nutr. 2005, 93, 393–402.
- Herchi, W.; Sakouhi, F.; Arráez-Román, D.; Segura-Carretero, A.; Boukhchina, S.; Kallel, H.; Fernández-Gutierrez, A. Changes in the Content of Phenolic Compounds in Flaxseed Oil during Development. J. Am. Oil Chemists Soc. 2011, 88, 1135–1142.
- Quezada, N.; Cherian, G. Lipid Characterization and Antioxidant Status of the Seeds and Meals of Camelina Sativaand Flax. Eur. J. Lipid Sci. Technol. 2012, 114, 974–982.
- El-Beltagi, H. S.; Salama, Z. A.; El-Hariri, D. M. Evaluation of Fatty Acids Profile and the Content of Some Secondary Metabolites in Seeds of Different Flax Cultivars (Linum Usitatissimum L.). Bulgarian J. Plant Physiol. 2007, 33, 187–202.
- Anwar, F.; Przybylski, R. Effect of Solvents Extraction on Total Phenolics and Antioxidant Activity of Extracts from Flaxseed (Linum Usitatissimum L.). Acta Sci. Pol. Technol. Aliment. 2012, 11, 293–302.
- Ribeiro, B. D.; Barreto, D. W.; Coelho, M. A. Z. Enzyme-Enhanced Extraction of Phenolic Compounds and Proteins from Flaxseed Meal. ISRN Biotechnol. 2013, 2013, 1-6.
- Waszkowiak, K.; Gliszczyńska-Świgło, A.; Barthet, V.; Skręty, J. Effect of Extraction Method on the Phenolic and Cyanogenic Glucoside Profile of Flaxseed Extracts and Their Antioxidant Capacity. J. Am. Oil Chemists Soc. 2015, 92, 1609–1619.
- Herchi, W.; Harrabi, S.; Sebei, K.; Rochut, S.; Boukhchina, S.; Pepe, C.; Kallel, H. Phytosterols Accumulation in the Seeds of Linum Usitatissimum L. Plant Physiol. Biochem. 2009, 47, 880–885.
- Schwartz, H.; Ollilainen, V.; Piironen, V.; Lampi, A. M. Tocopherol, Tocotrienol and Plant Sterol Contents of Vegetable Oils and Industrial Fats. J. Food Comp. Anal. 2008, 21, 152–161.
- Phillips, K. M.; Ruggio, D. M.; Ashraf-Khorassani, M. Phytosterol Composition of Nuts and Seeds Commonly Consumed in the United States. J. Agric. Food Chem. 2005, 53, 9436–9445.
- Sargi, S. C.; Silva, B. C.; Santos, H. M. C.; Montanher, P. F.; Boeing, J. S.; Santos Júnior, O. O.; Souza, N. E.; Visentainer, J. V. Antioxidant Capacity and Chemical Composition in Seeds Rich in Omega-3: Chia, Flax, and Perilla. Ciência E Tecnologia De Alimentos. 2013, 33, 541–548.
- Slavovakazakova, A.; Karamać, M.; Kancheva, V.; Amarowiczl, R. Antioxidant Activity of Flaxseed Extracts in Lipid Systems. Molecules. 2015, 21, 17.