
ABSTRACT
Fighting food industry standard violations has become an important stake especially in developing countries. In this work, different common DNA extraction protocols, namely NaOH, Phenol Chloroform Isoamyl alcohol, CTAB, Chloroform and the commercialized DNeasy blood and tissue kit were tested and compared for turkey salami genomic authentication in mitochondrial genes species detection by Polymerase Chain Reaction (PCR). The obtained results proved that a protocol based on NaOH after an advanced grinding step was the most adequate alternative in terms of simplicity, rapidity and detection threshold even in swabs. The selected protocol encourages wide range cost-effective routine authentications.
Introduction
Due to fast life pattern, some of the nutrition habits have changed considerably to the point that nowadays, more people prefer prepared meat products and sausages to fresh meat. Therefore, meat industries compete to provide a huge variety of tasty and cheap products and food formulations such as meatballs, sausages, and salami which are based mostly on chicken, turkey and beef meat. However, processed meat, such as salami, poses several problems that can only be detected through laboratory analysis. Also, many fraud cases have been declared all over the word such as Findus beef lasagna ready meals that were up to 100% made from horsemeat.[Citation1] In order to reach the consumer satisfaction and confidence, meat industries should conform to the authentication requirements related to safety, religion, health and conservation standards.[Citation2,Citation3] To achieve this purpose, different methods, mainly based on detecting either protein or DNA, were developed to identify meat species within processed meat product. The most prominent are immunodiffusion tests, enzyme-linked immunosorbent assays, electrophoresis and DNA hybridization.[Citation4,Citation5] Meanwhile, proteins are denatured during processing because of the high temperature and pressure that they should undergo, making the species detection more difficult. However, DNA has the advantage of being a relatively stable molecule. Besides, it is more able to withstand processing heat, grinding, and pressure.[Citation6,Citation7]
Methods that use DNA as a template could be more efficient. Both nuclear and mitochondrial genes have been targeted for species detection by Polymerase Chain Reaction (PCR). Mitochondrial DNA (mtDNA), existing in multi-copy per cell, is likely to be the best target in several commercialized kits and normalized protocols.[Citation8,Citation9] Consequently, there is a need to develop an adequate DNA extraction protocol for processed meat to extract larger amounts of integral DNA, traces of undeclared meat and short DNA fragments resulting from degradation processes. Such a protocol could be of critical importance for a better PCR amplification.[Citation10,Citation11] These paradoxical objectives are difficult to achieve with the common commercialized kits that are adjusted to provide pure and intact DNA extracted from biological fresh materials.
Since the 1990’s, food demand in Tunisia has been experiencing significant changes related particularly to the urbanization process, new lifestyles, industrialization of food sectors, women work, and the emergence of modern retail. In this regard, prepared food has become widely commercialized, especially processed meat and a wild competition has evolved between firms to provide cheap and tasty varieties. Unfortunately, the increased number and high cost of required daily authentication tests have made procedures slow and little accurate. In fact, the detection of fraud in processed meat seems to be a rare fortuitous event. Here, using Tunisian turkey salami as a processed meat model, we assessed the efficiency of five DNA extraction protocols regarding their ability to provide a suitable extract for undeclared meat detection by conventional PCR.
Materials and methods
Sample preparation
Peripheral blood samples of turkey and chicken of known origins were obtained from a local slaughterhouse and collected in hemolysis tubes containing EDTA as an anticoagulant. Also, six commercialized turkey salami brand samples were purchased from local suppliers and stored at −20°C. The manufacture and expiry dates as well as the batch number were recorded for each sample. Sample homogenization was performed in two different ways: 1) by cutting salami into small pieces with a scalpel[Citation12], and 2) by stainless steel ball milling using the vibro mill MM 400 (Retsch) at 30Hz for 2 min. In order to optimize the effect of the starting material amount in each protocol, different starting material weights were used (2, 5, 7, 10, 25 and 50 mg).
DNA extraction
DNA from chicken and turkey peripheral blood, used as references, was extracted using a phenol chloroform standard method with minor modifications.[Citation13] The leukocyte pellet was recovered after hemolysis of red blood cells by a lysis solution. The white pellet was then treated with proteinase K (50U) (Promega, 10mg/L) in the presence of its buffer for 15 min at 65°C and later incubated overnight at 37°C. Afterwards, the mixture was subjected to several extractions with phenol-chloroform until a clean aqueous phase was obtained (2500 rpm for 10 min at 4°C). The DNA was then precipitated by 2.5 V of ethanol and 1/10 V of 3M sodium acetate pH 7.4 after centrifugation for 10 min at 2500 rpm at 4°C. The obtained pellet was washed with an ethanol (80%)/TE (20%) solution. Finally TE solution (1X) was added until the DNA was completely dissolved.
Six different extraction methods were used as described below to obtain DNA from turkey salami: NaOH extraction protocol (Protocol 1), Phenol Chloroform Isoamyl alcohol extraction protocol (Protocol 2 and 3), CTAB method (Protocol 4), Chloroform method (Protocol 5), and DNeasy Blood and tissue commercialized kit (Qiagen) (Protocol 6).
NaOH extraction protocol:[Citation14] Four hundred microliters of NaOH (0.5 M) were added to each sample of the homogenized salami. The mixture was vortexed for 30 s, incubated at 95°C for 3 min, vortexed again for 15 s and then centrifuged at 4000 rpm for 10 s. The supernatant was mixed with 50 µl of Tris-HCL (1M, pH 8.0). The extract was vortexed briefly and centrifuged at 14000 rpm for 1 min and then the supernatant was retained.
Phenol Chloroform Isoamyl alcohol extraction protocol:[Citation12] Approximately 50 mg of tissue were cut into small pieces and dissolved in 500 µl STE (0.1 M NaCl; 0.05 M Tris and 0.01 M EDTA, pH 8.0). After adding 30 µl SDS (10%) and 30 µl proteinase K (10 mg/mL), the mixture was incubated at 50°C for 30 min. DNA was purified by successive extraction with phenol, phenol:chloroform:isoamyl alcohol (25:24:1) and chloroform:isoamyl alcohol (24:1), respectively. DNA was precipitated with ice-cold absolute ethanol and washed with 70% ethanol. The pellet was dried and dissolved in 1000 µl TE (10 mM Tris-HCl; 1 mM Na2EDTA.H2O, pH 7.2). An adjustment was introduced to optimize homogenization status as described in the result part. While Bardakci and Skibinski[12] used a scalpel tool for tissue homogenization, in this study, turkey salami homogenization was done using the vibro mill MM 400 (Retch).
CTAB method:[Citation15] 50 mg of each sample was mixed with 400 µl of deionized water, followed by an addition of 1000 µl of CTAB extraction buffer (20 g/L CTAB; 1.4 M NaCl; 0.1 M Tris-HCl; 20 mM Na2EDTA) and 20 µl of proteinase K (20 ng/mL). The mixture was vortexed and incubated at 65°C for 60 min. Besides, 20 µl of RNaseA (10 mg/mL) were added and the sample was homogenized, incubated at 65°C for 10 min and centrifuged at 12000 rpm for 10 min. The supernatant was mixed with 800 µl of chloroform, vigorously vortexed and centrifuged at 12000 rpm for 10 min. This step was repeated once. The upper phase was then mixed with double volume of CTAB precipitation buffer (5 g/L CTAB, 0.04 M NaCl) and incubated for 60 min at room temperature. After centrifugation at 12000 rpm for 10 min, the precipitate was dissolved in 700 µl of 1.2 M NaCl and extracted with an equal volume of chloroform. The mixture was then centrifuged at 12000 rpm for 10 min and 0.6 volume parts of isopropanol were added to the upper phase. After incubation for 10 min at room temperature, the mixture was centrifuged at 12000 rpm for 10 min and the supernatant was discarded. The pellet was washed with 1000 µl of 70% ethanol. After centrifugation at 12000 rpm for 10 min, the supernatant was discarded and the pellet was dried at 37°C for 30 min. The dry pellet was dissolved in 100 µl of deionized water and stored at −20°C.
Chloroform extraction method:[Citation16] 50 mg of homogenized sample was mixed with 1 ml extraction buffer heated to 65°C (100 mM Tris-HCl; 500 mM NaCl; 50 mM EDTA; 1.25% SDS). The mixture was incubated for 60 min at 65°C. Next, 1 ml chloroform was added and the sample was homogenized by agitation during 30 min then centrifuged at 3000 rpm for 15 min. One milliliter of cold absolute ethanol was added to the supernatant. After incubation for 30 min at −20°C, the mixture was centrifuged at 5000 rpm for 5 min, the supernatant was then discarded and the pellet was washed twice with 1 ml of 70% ethanol. After centrifugation at 5000 rpm for 5 min, the supernatant was discarded and the pellet was dried at 37°C for 60 min. The dry pellet was dissolved in 100 µl of deionized water and stored at −20°C.
DNeasy blood and tissue kit: (as described by Qiagen, Hilden, Germany). The samples were extracted according to the instructions of the kit with some modifications. In fact, as recommended by the supplier, the biological support of DNeasy kit is animal tissue (liver, brain, lungs, heart, kidney, spleen, pig ear, fish), whereas, in this study, turkey salami was used as the biological support. Also, unlike the kit recommendation where the initial amount of starting material is fixed to 25 mg for all biological support, different masses were used in this study (2, 5, 7, 10, 25 and 50 mg). The kit recommended homogenization by cutting samples into small pieces. In this study, however, sample homogenization was performed by stainless steel ball milling using the vibro mill MM 400 (Retsch) at 30 Hz for 2 min since the ball mill homogenization improves DNA yields. The quantity of DNA (ng/μL) was measured using nanodrop 2000 (Thermoscientific, Waltham, MA, US), while its quality was assessed using 260/280 and 260/230 ratios and visualizing on horizontal 0.8% agarose gel electrophoresis.
Polymerase chain reaction
DNAs extracted from turkey salami were validated by PCR using 200 ng. Two sets of primers, targeting D-loop and cytochrome b mitochondrial genes, were used in this study. Chicken-specific primers (ChD-Loop F: 5′-CTC CCC ATA GAC AGC TCC AAA C-3′) and (ChD-Loop R: 5′-CCC CAA AAA GAG AAG GAA CCA A-3′) generate a fragment of 442 bp of the conserved region of D-loop gene.[Citation17] Universal primers (Chcyt b F: 5′-CCA TCC AAC ATC TCA GCA TGA TGA AA-3′and Chcyt b R: 5′-GCC CCT CAG AAT GAT ATT TGT CCT CA-3′) were used to amplify a 359 bp fragment of the cytochrome b gene.[Citation18]
To optimize PCR conditions, 45 ng of DNA extracted from turkey and chicken peripheral blood were used as a template and reference. PCR amplifications were conducted in a 50 µl reaction volume containing 2.75 mM MgCl2, 200 µM of each DNTP, 5 µM of each primer (forward and reverse), 2 units of Taq DNA polymerase (TopTaq, Bioron) and Taq buffer containing 50 mM KCl and 10 mM Tris-HCl. PCR was run for 38 cycles following the conditions of 94°C for 30 s, 60°C for 30 s and a 72°C extension for 30 s, with an initial denaturing step at 94°C for 4 min. 10 µl of PCR product were separated by electrophoresis on a 2% agarose gel to evaluate the result. PCRs sensitivity of both sets of primers were assessed using four different mixtures of chicken and turkey reference DNA containing a growing proportion of chicken DNA ranging from 1 to10% ().
Figure 1. Amount and standard deviation of DNA extracted from six Tunisian brands of turkey salami. (A.1) Bardakci and Skibinski2 Standard Protocol, (A.2) with homogenization by a ball mill (vibro mill MM 400).
1DNA yield is calculated by multiplying the DNA concentration measured by nanodrop (ng/µl) by the elution volume (µl) divided by the sample mass (mg). 2Phenol Chloroform Isoamyl alcohol protocol corresponding to Bardakci and Skibinski protocol.
Figure 2. DNA yield1 and purity (A260/280) obtained from six Tunisian brands of turkey salami using NaOH extraction protocol (Protocol 1), Phenol Chloroform Isoamyl protocol2 (using 3.5 ml of the acqueous phase) (Protocol 2), Phenol Chloroform Isoamyl protocol2 (using the rest of the acqueous phase) (Protocol 3), CTAB protocol (Protocol 4), Chloroform protocol (Protocol 5).
1DNA yield is calculated by multiplying the DNA concentration measured by nanodrop (ng/µl) by the elution volume (µl) divided by the amount of starting material (mg). 2Phenol Chloroform Isoamyl alcohol protocol corresponding to Bardakci and Skibinski protocol with homogenization by a ball mill (vibro mill MM 400). Median values are indicated by the solid line within each box, and the box extends to upper and lower quartile values. The dashed line represents the median of the different DNA yields obtained for all tests for all Tunisian turkey salami types.
Figure 3. Agarose gel electrophoresis of total DNA isolated from brand 2 of Tunisian turkey salami using Bardakchi and Skibinski1 with homogenization using only 3.5 ml of acqueous phase (Protocol 2) (lane 1), Bardakchi and Skibinski1 with homogenization using the rest of the acqueous phase (Protocol 3) (lane 2), NaOH extraction protocol (Protocol 1) (lane 3), CTAB method (Protocol 4) (lane 4), Choloroform extraction method (Protocol 5) (lane 5) and DNeasy blood and tissue kit (Protocol 6) (lane 6). Lane 7: DNA KB-Ladder includes 9 fragments ranging from 0.5 to10 kilobases (kb) (BioBasic Inc). (a) using the same volume of 10 µl for all DNA extract; b: using the same concentration of 200 ng for all DNA extract
1Phenol Chloroform Isoamyl alcohol protocol corresponding to Bardakci and Skibinski protocol.
Figure 4. (a) PCR product generated by D-loop primers amplification of DNA extracted from chicken and turkey peripheral blood. (b) PCR product generated by cytochrome b primers amplification of DNA extracted from chicken and turkey peripheral blood.
P1: negative control of primers, P2: 100% chicken (45 ng), P3: 100% turkey (45 ng), P4: 10% chicken and 90% turkey, P5: 5% chicken and 95% turkey, P6: 2% chicken and 98% turkey, P7: 1% chicken and 99% turkey, L: 100 bp DNA ladder (Catalog Number: 15628019; ThermoFisher Scientific)
PCR fragment sequencing
PCR products were purified using FavorPrep™ GEL/PCR Purification Kit (Favorgen Biotech Corporation, Taiwan), and both cytochrome band D-loop fragments were directly sequenced (using either forward or reverse primers) on 3100-Avant DNA analyser (Applied Biosystem). Electropherograms were analyzed by the Bioedit software.
Statistics
Statistical analyses were performed using the SPSS 17 software.
Results and discussion
In this work, we tried to depict a simple and effective processed meat authentication test as an alternative to the commercialized kits. For this purpose, we evaluated the efficiency of five DNA extraction protocols regarding their ability to provide a suitable extract for undeclared meat detection by conventional PCR.
Among other alternatives, DNA amplification tests are widely used for the detection of various species in processed meat including sausages, hamburger and salami. However, in this kind of tests, the DNA quality remains the key factor to obtain a sensitive, specific and rapid speciation assay. Thus, the DNA extraction protocol should overcome the constraints of DNA degradation due to the heat, grinding and pressure used for processing, the reduced number of intact DNA and the potential presence of PCR inhibitors related to manufactory transformation and flavoring processes.[Citation19]
To start, a reproducible amount of DNA (1000 – 2000 ng/mg) was obtained in a mass of 50 mg from each sample of the six turkey salami brands, following the Bardakci and Skibinski protocol, often reported as the most common DNA extraction technique[Citation12] (). To further improve the yield quantity and quality, homogenization with a ball mill grinding system (vibro mill MM 400) was made. This option allowed us to increase the yield by six fold for all types of salami (). The new protocol including the Bardakci and Skibinski method and homogenization is hereafter designated as the Phenol Chloroform Isoamyl alcohol protocol.
To improve the DNA extraction yield from meat, whether fresh or processed, methods other than the Phenol Chloroform Isoamyl alcohol protocol have previously been described[Citation14,Citation16], and several commercial kits are currently available. In the present paper, a comparative analysis of the obtained yield from Phenol Choloform Isoamyl alcohol protocol with four other protocols (NaOH extraction protocol[Citation14], CTAB method[Citation15], chloroform extraction method[Citation16] and Dneasy blood and tissue kit) was done. Each protocol was conducted in triplicate for each sample of salami. Due to its beneficial effect, the homogenization step was repeated with all the samples through the five protocols.
The protocols were compared according to the DNA amount, concentration and quantity by unit of mass, expressed in as DNA yield. Results showed that the lowest DNA yield was obtained for both CTAB and Chloroform protocols. In fact, the amount of DNA extracted from turkey salami was about 140 ng/mg for CTAB protocol and 206 ng/mg for Chloroform extraction (). However, using the Phenol Chloroform Isoamyl alcohol method (Protocols 2 and 3), almost 20000 ng/mg of extracted DNA were obtained (). This difference in DNA yield might be attributed to the ability of the Phenol Chloroform method to release DNA from a wide variety of tissues.[Citation20] Although yielding high quantity DNA, the Phenol Chloroform protocol is time consuming and requires the use of hazardous chemicals.
Table 1. DNA yields (ng DNA/mg sample), A260/A280 and A260/A230 Ratios of DNA extracted from 6 brands of Tunisian turkey salami with five DNA extraction methods using an amount of 50 mg of starting material. The mean value and standard deviation are shown for each sample.
Besides, DNA quality was examined according to ratios of optical density obtained at different wavelengths (260/280/230 nm) (). The results revealed that the NaOH extraction protocol, the Phenol Chloroform Isoamyl alcohol protocol and the DNeasy kit provide the best 260/280 ratio ( and ). Moreover, the 260/230 ratio varied dramatically among the different extraction methods (). The highest ratio was obtained with the Phenol Chloroform method (1.38); whereas the lowest was provided by the CTAB method (0.14).
The extracted DNA from the same sample using the six different protocols was further analyzed using agarose gel electrophoresis (). Two profiles were generated by loading the same volume of the obtained extracts in ) and the same quantity in ). A high proportion of degraded DNA in all collected extracts was noticed in both profiles. Nevertheless, the worst results were obtained with CTAB and Chloroform. In fact, almost all included protocols were originally optimized to extract DNA from fresh materials rather than transformed ones. In this work, the efficiency of the extraction protocols was seriously affected by nuclear DNA degradation[Citation6], ().
In order to exhibit the differences between the protocols as well as the six brands of turkey salami, statistical studies using two-way ANOVA, covering DNA yield and DNA quality (260/280) variables, were performed. High significant differences between protocols were found (p = 2.10–9, p = 8.10–11, respectively). However, there were no significant differences between the different brands of turkey salami (p > 0.05) and no significant interactions. Post-hoc multiple mean comparisons between protocols (Tuket HSD Test), revealed that protocol 2 outperform all other protocols for all parameters, and that protocol 3 was better than the others (protocol 1, 4 and 5) for DNA yield and concentration. For DNA quality, protocol 1 (NaOH) and protocol 2 (Phenol-Chloroform Isoamyl) were the best.
With processed meat, the efficiency of the extraction protocols is obviously altered as a result of the nuclear DNA degradation due to the processing impact. For this reason, regarding their copy numbers, the mitochondrial genome was selected as a template. In fact, the chances of extracting an intact mitochondrial DNA were much higher than nuclear DNA.[Citation21] For this purpose, shorter targets of mitochondrial sequences were studied using two sets of primers: D-loop and cytochrome b.
D-loop primers, flanking a region of 442 bp, are chicken-specific [Citation17], whereas the cytochrome b primers are universal covering the same region of the mitochondrial genome among several species including chicken and turkey (359 bp).[Citation18] Firstly, the sensitivity of the PCR reaction was tested by using four different mixtures of chicken and turkey DNA containing 1, 2, 5 or 10% of chicken DNA. shows that chicken reference DNA (extracted from peripheral blood) is detectable even at a highly reduced proportion (1%).
Then, PCR amplification was performed for all extracted DNA from turkey salami using both sets of primers. Results showed a positive reaction using extracts obtained from NaOH protocol, Phenol Chloroform Isoamyl alcohol protocol and DNeasy kit ()), while no amplification was observed using DNA from CTAB and Chloroform extraction methods. We suggest that the presence of PCR inhibitors (including salts, proteins and extraction reagents) might have affected the sensitivity of the PCR or even led to false-negative results.[Citation22]
Figure 5. (a) PCR product generated by D-loop and cytochromeb primers amplification of DNA extracted from brand 2 of turkey salami using 50 mg as an amount of starting material: P1→P5: D-loop primers. P6→P10: Cytochrome b primers. L:100 bp DNA ladder (Catalog Number:15628019; ThermoFisher Scientific). P1: negative control of D-loop primers. P6: negative control of cytochrome b primers, P2 and P7: NaOH extraction protocol (Protocol 1), P3 and P8: Phenol Chloroform Isoamyl alcohol extraction protocol1 (using 3.5 ml of the acqueous phase) (Protocol 2), P4 and P9: Phenol Chloroform Isoamyl alcohol extraction protocol1 (using the rest of the acqueous phase) (Protocol 3), P5 and P10: DNeasy blood and tissue kit (Protocol 6). (b) Turkey salami heteroplasmy exploration, cytochrome b sequence validation: turkey salami, chicken reference and turkey reference.
1Phenol Chloroform Isoamyl alcohol protocol corresponding to Bardakci and Skibinski protocol with homogenization by a ball mill (vibro mill MM 400).
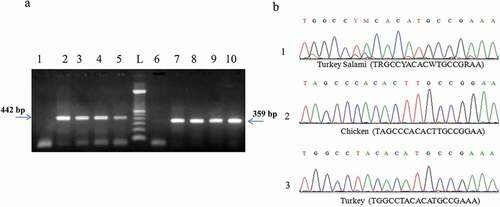
PCR using D-loop primers confirmed the presence of unlisted chicken species in the turkey salami samples. The reliability of the cytochrome b gene variability in rapid detection and identification of meat species was evaluated by Sanger sequencing. Sequences obtained from turkey salami were aligned with the reference chicken and turkey DNA. The results of sequence comparison showed that turkey salami also contained undeclared chicken meat ()).
Making molecular authentication tests accessible under all circumstances and at the least amount of samples, the sensitivity of the more effective protocols was assessed at reduced masses of each brand of turkey salami (2, 5, 7, 10 and 25 mg). The results showed significant differences in the performance of each protocol ()). Results proved that the Phenol Chloroform method was the most efficient with the highest DNA yields at 2 mg of processed meat ()). However, DNA yields obtained with the NaOH method and DNeasy kit were quite stable for all masses ()). PCR analysis was performed to evaluate the quality of the extracted DNA using the three selected protocols ( and )). The best results of PCR amplification were obtained with NaOH protocol ()) and commercialized DNeasy kit ()), regardless of the amount of the starting material for all samples of turkey salami and all replicate tests (PCR score was 100%). Nevertheless, total PCR score for the Phenol Chloroform method was 65% and the best amplification results were obtained with 5 mg of starting material ().
Table 2. DNA Yields (ng DNA/mg sample), A260/A280, A260/A230 Ratios and results of PCR using cytochrome b and D-loop primers of DNA extracted from brand 2 of Tunisian turkey salami with the Phenol Chloroform Isoamyl Alcohol protocol using different amount of starting material (2, 5, 7, 10 and 25 mg). The Mean Value and Standard Deviation are shown for each sample.
Figure 6. (a) Histogram of DNA yields1 obtained from brand 2 of Tunisian turkey salami using four extraction protocols (A) NaOH extraction protocol (Protocol 1) (B) Phenol Chloroform Isoamyl alcohol extraction protocol2 (using 3.5 ml of the acqueous phase) (Protocol 2) (C) Phenol Chloroform Isoamyl alcohol extraction protocol2 (using the rest of the acqueous phase) (Protocol 3) (D) DNeasy blood and tissue kit (Protocol 6) using differents masses of samples (2, 5, 7, 10 and 25 mg). (b) and (c) PCR product generated by D-loop and cytochrome b primers amplification of DNA extracted from brand 2 of turkey salami using different masses of starting material. (b): NaOH extraction protocol (Protocol 1), (c): DNeasy blood and tissue kit (Protocol 6): 2 mg (Lane 2 and 8), 5 mg (Lane 3 and 9), 7 mg (Lane 4 and 10), 10 mg (Lane 5 and 11) and 25 mg (Lane 6 and 12). P1→P6: D-loop primers, P7→P12: cytochrome b primers, L: 100 bp DNA ladder (Catalog Number:15628019; ThermoFisher Scientific). P1: negative control of D-loop primers, P7: negative control of cytochrome b primers.
1DNA yield is calculated by multiplying the DNA concentration measured by nanodrop (ng/µl) by the elution volume (µl) divided by the sample mass (mg). 2Phenol Chloroform Isoamyl alcohol protocol corresponding to Bardakci and Skibinski protocol with homogenization by a ball mill (vibro mill MM 400).
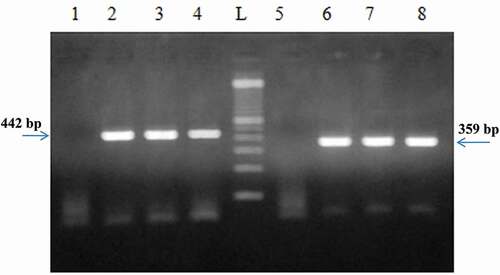
The obtained results at tiny amounts of sample encouraged us to address swabs of starting material. Only NaOH and Phenol Chloroform Isoamyl alcohol protocols were proved to be suitable to extract high levels of mtDNA. On the other hand, the obtained specific PCR products, using D-loop and cytochrome b primers () confirmed the existence of chicken DNA in turkey salami swabs.
Figure 7. PCR product generated by D-loop and cytochrome b primers amplification of DNA extracted from brand 2 of turkey salami from swabs using NaOH extraction protocol and Phenol Chloroform Isoamyl alcohol protocol. P1→P4: D-loop primers, P5→P8: Cytochrome b primers, P1: negative control of D-loop primers protocol corresponding to Bardakci and Skibinski protocol with homogenization by a ball mill (vibro mill MM 400)., P5: negative control of cytochrome b primers, P2 and P6: NaOH extraction protocol (Protocol 1), P3 and P7: Phenol Choloroform Isoamyl alcohol extraction protocol1 (using 3.5 ml of the acqueous phase) (Protocol 2), P4 and P8: Phenol Choloroform Isoamyl alcohol extraction protocol1 (using the rest of the acqueous phase) (Protocol 3), L: 100 bp DNA ladder (Catalog Number: 15628019; thermoFisher Scientific).
1Phenol Chloroform Isoamyl alcohol protocol corresponding to Bardakci and Skibinski protocol with homogenization by a ball mill (vibro mill MM 400).
According to the different aspects of this study, NaOH outperformed the other tested protocols especially in terms of simplicity, efficiency and adequacy to the authentication of turkey salami varieties. These results could encourage the generalization of processed meat authentication and species identification tests in daily routine campaigns.
Conclusion
Molecular methods were developed to identify species in turkey salami varieties, namely PCR; and direct sequencing (Sanger). To guarantee the success of the authentication test, different DNA extraction protocols were evaluated. The challenge of this work lied in overcoming the problem of DNA degradation and the presence of PCR inhibitors. Using low masses or even traces of starting material, NaOH extraction was proved to be the most effective tool for DNA extraction from turkey salami thanks to its simplicity, rapidity and detection threshold even in swabs. This protocol can be generalized for wide range authentications of processed meat.
Acknowledgments
This work was supported by the Ministry of Higher Education and Scientific Research of Tunisia. The authors claim no conflict of interest. The authors are thankful to Dr. Wajdi Ayadi, Riadh Ben Marzoug and Mohamed Arbi Ben Younes for providing necessary help. We also thank Pr. Ahmed Rebai for pertinent discussions and technical assistance of statistical analyses. The authors are also grateful to Kamel MAALOUL, translator and English professor for having proofread the manuscript.
Additional information
Funding
References
- Nau, J.-Y. Viande De Cheval: Premières Leçons D’un «Scandale». Rev Med Suisse. 2013, 9, 532–533.
- Aida, A. A.; Man, Y. B. C.; Wong, C. M. V. L.; Raha, A. R.; Son, R. Analysis of Raw Meats and Fats of Pigs Using Polymerase Chain Reaction for Halal Authentication. Meat Sciences 2005, 69, 47–52.
- Mane, B. G.; Tanwar, V. K.; Girish, P. S.; Dixit, V. P. Identification of Species Origin of Meat by RAPD–PCR Technique. Journal of Veterinary Public Health 2006, 4, 87–90.
- Lockley, A. K.; Bardsley, R. G. DNA-based Methods for Food Authentication. Trends in Food Science and Technology 2000, 11, 67–77.
- Ali, M. E.; Hashim, U.; Mustafa, S.; Che Man, Y. B. Swine Specific PCR-RFLP Assay Targeting Mitochondrial Cytochrome B Gene for Semi Quantitative Detection of Pork in Commercial Meat Products. Food Analytical Methods 2011, 5, 613–623.
- Aslan, Ö.; Hamill, R. M.; Sweeney, T.; Reardon, W.; Mullen, A. M. Integrity of Nuclear Genomic Deoxyribonucleic Acid in Cooked Meat: Implications for Food Traceability. Journal of Animal Science 2009, 87, 57–61.
- Pirondini, A.; Bonas, U.; Maestri, E.; Visioli, G.; Marmiroli, M.; Marmiroli, N. Yield and Amplificability of Different DNA Extraction Procedures for Traceability in the Dairy Food Chain. Food Control 2010, 21, 663–668.
- Unajak, S.; Meesawat, P.; Anyamaneeratch, K.; Anuwareepong, D.; Srikulnath, K.; Choowongkomon, K. Identification of Species (Meat and Blood Samples) Using nested-PCR Analysis of Mitochondrial DNA. African Journal of Biotechnology 2011, 10, 5670–5676.
- CheMan, Y. B.; Mustafa, S.; Mokhtar, K.; Fadhilah, N.; Nordin, R.; Sazili, A. Q. Porcine-Specific Polymerase Chain Reaction Assay Based on Mitochondrial D-Loop Gene for Identification of Pork in Raw Meat. International Journal of Food Properties 2012, 15, 134–144.
- Arslan, A.; Ilhak, O. I.; Calicioglu, M. Effect of Method of Cooking on Identification of Heat Processed Beef Using Polymerase Chain Reaction (PCR) Technique. Meat Science 2006, 72, 326–330.
- Kesmen, Z.; Sahin, F.; Yetim, H. PCR Assay for the Identification of Animal Species in Cooked Sausages. Meat Science 2007, 77, 649–653.
- Bardakci, F.; Skibinski, D. O. Application of the RAPD Technique in Tilapia Fish: Species and Subspecies Identification. Heredity 1994, 73, 117–123.
- Kawazaki, E.;. Sample Preparation from Blood, Cells and Other Fluids. In PCR Protocols. A Guide to Methods and Application; Innis, M., Gelffand, D., Snisky, G., White, T., eds; Academic Press: San Diego, 1990; pp 146–152.
- Wang, H.; Qi, M.; Cutler, A. A Simple Method of Preparing Plant Samples for PCR. Nucleic Acids Research 1993, 21, 4153–4154.
- Stefanova, P.; Taseva, M.; Georgieva, T.; Gotcheva, V.; Angelov, A. A Modified CTAB Method for DNA Extraction from Soybean and Meat Products. Biotechnology and Biotechnological Equipment 2013, 27, 3803–3810.
- Edwards, K. J.; Johnstone, C.; Thompson, C. A Rapid and Simple Method for the Preparation for Plant Genomic DNA for PCR Analysis. Nucleic Acids Research 1991, 19, 1349.
- Mane, B. G.; Mendiratta, S. K.; Tiwari, A. K. Polymerase Chain Reaction Assay for Identification of Chicken in Meat and Meat Products. Food Chemistry 2009, 116, 806–810.
- Kocher, T. D.; Thomas, W. K.; Meyer, A.; Edwards, S. V.; Pääbo, S.; Villablanca, F. X.; Wilson, A. C. Dynamics of Mitochondrial DNA Evolution in Animals: Amplification and Sequencing with Conserved Primers. Proceedings of National Academy of sciences USA 1989, 86, 6196–6200.
- Klancnik, A.; Kovac, M.; Toplak, N.; Piskernik, S.; Jersek, B. PCR in Food Analysis, Polymerase Chain Reaction; Hernandez-Rodriguez, P., Ed.; ISBN:978-953-51-0612-8; InTech. http://www.intechopen.com/books/polymerase-chain-reaction/pcr-in-food-analysis, 2012.
- Androniki, P.; Chrysostomos, I. D.; Georgios, B.; Thomai, L.; Claire, L. R.; Georgios, A.; Georgios, B. Comparison of Eleven Methods for Genomic DNA Extraction Suitable for Large-Scale Whole-Genome Genotyping and Long-Term DNA Banking Using Blood Samples. PLoS ONE. 2015, 10, 1371.
- Partis, L.; Croan, D.; Guo, Z.; Clark, R.; Coldham, T.; Murby, J. Evaluation of a DNA Fingerprinting Method for Determining the Species Origin of Meats. Meat Science 2000, 54, 369–376.
- Schrader, C.; Schielke, A.; Ellerbroek, L.; Johne, R. PCR Inhibitors – Occurrence, Properties and Removal. Journal of applied Microbiology 2012, 113, 1014–1026.