
 ?Mathematical formulae have been encoded as MathML and are displayed in this HTML version using MathJax in order to improve their display. Uncheck the box to turn MathJax off. This feature requires Javascript. Click on a formula to zoom.
ABSTRACT
Golden pompano (Trachinotus ovatus) quality forecasting method utilising Vis/NIR spectroscopy combined with electronic nose (EN) was investigated in this article. Responses of Vis/NIR spectroscopy and EN to pompanos stored at 4°C were measured for 6 days. Physical/chemical indexes including texture, total volatile basic nitrogen, pH, total viable counts, and human sensory evaluation were synchronously examined as quality references. Chemometric methods including principal component analysis (PCA) and stochastic resonance (SR) were employed for spectroscopic and EN data analysis. Physicochemical examination demonstrated that fish quality decreased rapidly during storage. PCA qualitatively classified freshness degree of pompano samples, while SR signal-to-noise ratio (SNR) spectrum using SNR maximum quantitatively characterised quality for all samples. Golden pompano quality predictive models were developed based on spectroscopy, EN, and spectroscopy combined with EN, respectively. Results demonstrated that the model developed based on spectroscopy combined with EN presented a forecasting accuracy of 93.3%.
Introduction
Golden pompano (Trachinotus ovatus) is an economically important marine fish species and favoured by most consumers, due to its good taste and rich nutrients (e.g. proteins, fats, unsaturated amino acids, and minerals).[Citation1-Citation3] However, pompanos have limited shelf life, and deteriorate easily after post-mortem due to biochemical reactions and microbial pollution.[Citation1] Therefore, investigation on golden pompano freshness rapid analysis method is of great importance.
Nowadays, there are many protocols available for marine fish quality analysis, such as total viable counts (TVC)[Citation4] and total volatile basic nitrogen (TVB-N).[Citation5] But these protocols often rely on microbiological/chemical examination, which is rather time-consuming. To address this issue, many instrumental analysing methods such as gas chromatography, gas chromatography coupled with mass spectrometry, and HPLC have been applied for fish quality analysis.[Citation6–Citation8] Although the use of instrumental analysis realises computerised control and saves time, only well-trained operators can perform these experiments. Also, the high cost for these instruments limits their wide application.
Recently, great attention has been paid on food quality analysis by Vis/NIR spectroscopy. Vis/NIR spectroscopy has shown potential usage in various agricultural and food products for freshness discrimination due to its non-destruction, no pollution, easy operation, capability of on-line analysis,[Citation9] variety classification,[Citation10] bruise identification,[Citation11] and adulteration analysis.[Citation12] Also, this method has been reported for aquatic products quality analysis. For instance, Sivertsen et al. proposed a Vis/NIR spectroscopy-based method for differentiation between fresh and frozen-thawed cod fillets.[Citation13]
Electronic nose (EN) is an intelligent detecting device that consists of several chemical sensors with specific sensing types. Since the detecting objectives of EN are volatile compounds, it provides an access for food quality analysis in a non-destructive way. After one sampling, a characteristic signal can be obtained. Then, this unknown pattern can be identified through a proper pattern recogniser.[Citation14,Citation15] EN measurement can achieve better stability and reproducibility, compared with human sensory evaluation (HSE). A large number of researches have demonstrated the application of EN coupled with pattern recognition methods in diverse fields, particularly in food quality analysis, including fruits,[Citation16,Citation17] oils,[Citation18,Citation19] grains,[Citation20,Citation21] meat,[Citation22,Citation23] and fish.[Citation6,Citation24] However, there is little information on investigating the usage of EN combined with Vis/NIR spectroscopy for golden pompano freshness prediction.
In this work, golden pompano quality prediction by utilising Vis/NIR spectroscopy combined with EN was explored. Spectroscopic and EN responses of pompanos stored at 4°C were examined for 6 days. Physicochemical indexes including texture, TVB-N, pH, TVC, and HSE were examined to provide quality references for instrument analysis. Principal component analysis (PCA) and stochastic resonance (SR) were utilised for spectroscopic and EN data analysis, respectively. Pompano quality predictive models were developed based on Vis/NIR spectroscopy, EN, and Vis/NIR spectroscopy combined with EN, respectively. Validating experiments were also performed to evaluate the forecasting accuracy of the developed models.
Materials and methods
Raw materials
Fresh golden pompanos with an average weight of 500 ± 100 g were bought from an aquatic market, Hangzhou, China. After transporting to the laboratory within half an hour in a foam box with ice, pompanos were decapitated, eviscerated, and washed with cold water. Then, the fish were cut into small pieces, each containing 10 g ± 1 g (30 × 20 × 10 mm). The total number of samples was displayed in the online supplementary information (SI) Table S1. Afterwards, samples were packaged with sealing membrane and stored at 4°C for 6 days. Each day, some pompano samples were randomly taken out for physicochemical, spectroscopic, and EN measurements. Each test was repeated by five replications.
Chemicals
The main chemicals utilised for the experiments including magnesium oxide (Tianjin Bodi Chemical Co., Ltd. Tianjin, China), hydrochloric acid (Hangzhou Chemical Reagent Co., Ltd. Hangzhou, China), boric acid (Wuxi Jingke Chemical Co., Ltd. Jiangsu, China), sodium hydroxide (Sinopharm Chemical Reagent Co., Ltd. Shanghai, China), methyl red (Shanghai SSS Reagent Co., Ltd. Shanghai, China), and methylene blue (Shanghai SSS Reagent Co., Ltd. Shanghai, China) were of analytical pure grade. Deionised water was utilised in the experiments.
Physicochemical examination
Texture
TA.XT2i Texture Analyser (Stable Micro Systems, UK) was used for pompano texture analysis. Flat cylindrical probe p/5 (5 mm in diameter) was set and TPA mode was adopted. Speed in pre-measurement and after-measurement was 3 mm/s. Measurement speed was 1 mm/s. Compression degree was 50%. Residence time interval was 5 s. Load probe type was Auto-0.2 g. Data collection range was 200.
Total volatile basic-nitrogen
TVB-N content in golden pompanos was determined by a micro Kjeldahl apparatus (Hongji Instruments Company, Shanghai, China), according to China standard protocols (GB/T 5009.44–2003).[Citation25] Briefly, 10 g of sample was mixed with 100 ml distilled water in a heating flask. After 30 min, the mixture was filtered and the filtrate was kept in a refrigerator before being analysed. Then, 5 ml filtrate and 5 ml magnesium oxide suspension (10 g/l) were mixed, followed by distilling for 5 min. The absorption solution (containing 10 ml boric acid (20 g/l) and 5–6 drops of mixed indicator) was titrated with 0.010 mol/l hydrochloric acid. The TVB-N of pompanos was calculated as follows:
where
X is the TVB-N content of pompanos in mg N/100 g
V2 is the volume of hydrochloric acid consumed for sample titration in ml
V1 is the volume of hydrochloric acid consumed for control titration in ml
c is the concentration of hydrochloric acid in mol/l
m is the weight of sample in g
pH
For pH measurement, the minced sample was homogenised with 90 ml deionised water after cooling down. After attaining equilibrium at room temperature for 30 min, the filtrate was taken out and measured with a PHS-3C pH meter (Hangzhou Leici Analytical Instruments Company, China).
Total viable counts
Pompano sample was aseptically weighted and homogenised with 225 ml sterile 0.1% physiological saline for 1 min. The homogenised sample was serially diluted using 9 ml sterile saline for bacteriological analysis. TVC was determined in plate count agar by the spread plate method (AOAC, Official methods of analysis (17th edit) 2002).[Citation26]
Sensory evaluation
According to the previously reported method by Gao et al[Citation2], the sensory of pompano samples was evaluated by six experienced panellists (two males and four females). displays the sensory evaluation details. Voting number is set at k, k∈(1,10). The quality of pompano is divided into m levels, and the score of a specific level is set at , j∈(1,m). Pompano attributes are divided into n elements, and a specific element is set at ui, i∈(1,n). The contributory weight is determined by pairwise comparison of contribution weight of attributes set at xi (∑xi = 1). If there is a specific relationship between two objects of
and ui, the relation set (matrix) of f is calculated as follows:
Table 1. Sensory scheme for pompano evaluation during storage.
Thus, the overall acceptability of pompano is calculated by the weight grade method as follows:
Vis/NIR spectroscopy
Vis/NIR spectroscopy schematic diagram is displayed in Fig. S1 (SI). The system mainly consists of three functional parts including sampling device (light controller, sampling pedestal, optical fibre, and special halogen lamp), detection device (S3000 Vis/NIR spectrometer, USB 2000+, America Ocean Photology Company), and data acquisition system (Spectrapro software, American Ocean Photology Company).
Spectroscopy measurement was performed at room temperature. The determined sample was fixed in the sampling pedestal and contacted with the optical fibre with a dip angle of 75°. The optical fibre was connected to the detecting device and the special halogen lamp. The sampling pool was a sealable and opaque cube.
Electronic nose
EN system has three basic parts: data acquisition, modulating and transmitting unit (U1); sensor array and chamber unit (U2); power and gas supply unit (U3) (). The pump is FML201 (Xinweicheng Technology Co., Ltd, Chengdu, China). The valve is WTA-2K (Takasago Electrical Co., Ltd, Tokyo, Japan). The data acquisition unit is developed by our lab. The EN sensor array consists of eight metal oxide semiconductor (MOS) gas sensors with different sensitive species (). The selectivity towards volatile compound classes of MOS sensors is indicated by the supplier: S1 (TGS-825, hydrogen sulphide), S2 (TGS-821, hydrogen), S3 (TGS-826, ammonia), S4 (TGS-822, ethanol, methylbenzene, xylene gas), S5 (TGS-842, hydrocarbon component gas), S6 (TGS-813, methane, propane, and butane), S7 (TGS-2610, propane, butane), and S8 (TGS-2201, nitrogen oxides) (). Each sensor is installed in independent chamber to avoid cross-influence of gas flow. Special high temperature resistant material is utilised to fabricate gas sensor chamber. The detecting mechanism is displayed in , where VH is the heating voltage, VC is the supplying voltage, and VRL is the sampling voltage. The sensing membrane is heated by the resistance wire. EN response is recorded as sampling voltage (V).
Figure 1. Schematic diagram of (a) EN system; (b) MOS gas sensor; (c) EN gas chamber; and (d) detecting mechanism.
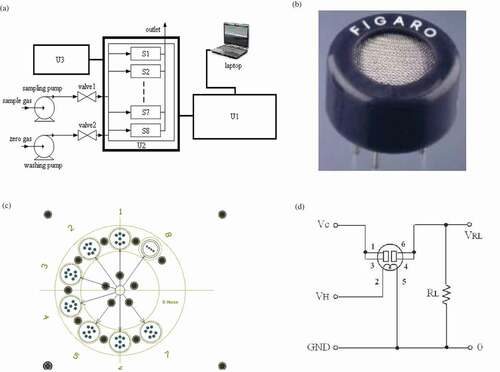
Before EN measurement, pompanos were placed into 50 ml air-tight vials, and sealed with sealing membrane. The vials were equilibrated at room temperature for 30 min. After turning on the EN power, washing pump and valve-2 were started. Sampling pump and valve-1 remained off. Sensor array was recovered by zero gas, which was obtained by filtering air through active carbon. When sensors’ responses returned to the baseline, washing pump and valve-2 were shut off. Sampling pump and valve-1 were turned on. Gases existing in the headspace were inhaled into gas sensor chambers by sampling pump at a flux speed of 400 ml/min for 45 s. EN measurement interval was 0.05 s. EN real-time responses to pompanos were recorded. When measurement was over, gas sensors were recovered by zero gas at a flux speed of 1000 ml/min for 600 s, waiting for next measurement.
Data treatment
Principal component analysis
PCA is an unsupervised chemometrics method that can effectively decrease the number of variables through dimensionality reduction.[Citation27] So, the most original information of samples can be characterised just by certain new variables.[Citation28] PCA has been frequently utilised in the field of multivariable data analysis.
Double-layered SR
SR is a counter-intuitive phenomenon and has inclusive applications in signal processing and data analysis.[Citation29,Citation30] The detailed double-layered SR is described in Section S1 (SI).
Results and discussion
Physicochemical examination results
Texture
Changes in pompano texture profiles including firmness, adhesiveness, and resilience are measured during cold storage for 6 days. The initial firmness value was 345 g, and it increased to 385 g in Day 1, followed by a decrease trend (). After 6 days, the hardness value was 192 g. presents the adhesiveness change of pompanos. The adhesiveness value was 9.2 g·s in Day 0. This index underwent rapid growth, reaching 56 g·s at the end of storage. However, pompano’s resilience ranged between 0.13 and 0.21 during storage time, as presented in .
Figure 2. Physical/chemical indexes of golden pompanos: (a) firmness; (b) adhesiveness; (c) resilience; (d) TVB-N; (e) pH; (f) TVC; and (g) human sensory evaluation.
When fish dies, muscle firmness increases and reaches its maximum, due to the formation of rigor mortis compounds.[Citation1] But the link between myogen and actin becomes weak once stiffness relieves and autolysis begins, resulting in reduced hardness and increased adhesiveness.[Citation31] These reactions can be accelerated with the help of microbial propagation. Similar changes in texture profiles have also been reported in large yellow croaker[Citation31] and American shad.[Citation32]
Total volatile basic-nitrogen
TVB-N is an important chemical index for assessing the quality of fish and meat. The initial TVB-N content was 9.5 mg/100 g in Day 0. TVB-N index showed an increase trend () and reached 33 mg/100 g in Day 4, which was higher than the upper limit of 30 mg/100 g.[Citation5] Therefore, the samples after Day 4 were regarded as non-fresh. Previous researches have demonstrated that the accumulation of TVB-N in fish is closely associated with enzymatic activity and microbial propagation.[Citation1,Citation7] Proteins and non-protein nitrogenous compounds can be gradually degraded and thereby, releasing amines and other breakdown products. The degradation rate can be significantly improved when microorganisms propagate dramatically,[Citation1,Citation31] which explains the rapid growth of TVB-N in golden pompanos during storage. Our results are in mirror with the report by Gao et al.[Citation1]
pH
pH index examination results are presented in . It began with a low value of 4.7, and increased with the increase of storage time, except for a minor decline from Day 1 to Day 2. Finally, it reached 6.6 in Day 5. It has been noted that the pH changes of marine fish are related firmly to autolysis reaction and microbial decomposition effect.[Citation1,Citation31] Acidities including lactic acid and phosphoric acid can gradually generate through glycolysis and nucleotide breakdown, resulting in the decrease in pH value. But this lasts for a very short period after post-mortem. Once alkaline compounds are continuously released as a result of microbial pollution, it can contribute to the significant growth in pH value. Results obtained in our research are supported by the report of Gao et al.[Citation1] Overall, pH is a valuable index for quality assessment of golden pompanos.
Total viable counts
Microbial propagation is a crucial factor influencing quality of aquatic products. During storage, pompano samples deteriorate gradually due to microbiology propagation. Microbiological metabolism leads to emission of characteristic gases, which provides the measurement basis of EN analysis. So, it is important to trace the microbiological propagation on the samples. TVC values of the samples are displayed in . Initial value for TVC was about 4l g3.33 cfu•g−1. Then, TVC value increased as the storage time increased. TVC value dramatically increased in the following days, and finally reached about 8l g5 cfu•g−1in Day 5.
Human sensory evaluation
Sensory attributes of pompano samples were divided into five elements, whose preference scores were scored from 1 to 5; the higher the preference score, the better the quality of pompano (see ). All samples started with a score of 5 in Day 0. In , it can be observed that preference scores decrease with the increase of storage days. Choosing 3.5 as the acceptable limitation, the samples can maintain its shelf life by 3 days, and the preference score in Day3 was about 3.1. Sensory evaluation results accord to TVB-N results well. Combined with TVB-N and TVC examination results, sensory evaluation results might be affected by microbial activities and changes of samples’ self components. Mirror experimental results are also reported by other research groups.[Citation24]
Spectroscopy analysis results
Original responses
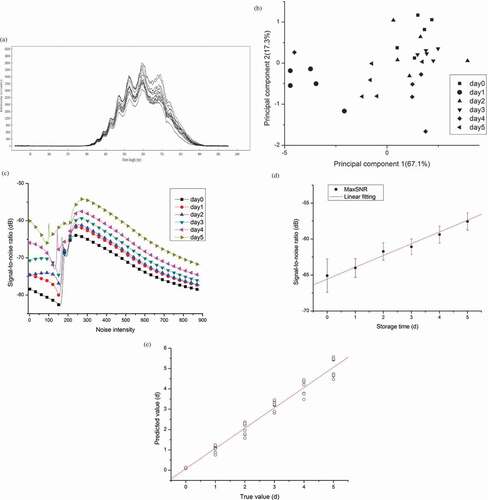
presents the original diffuse reflection spectrum of golden pompanos during storage. The absorption wavebands primarily concentrate within the wavelength range from 360 to 900 nm. Finally, five main absorption peaks appear, at wavelength of about 468, 513, 561, 630, and 702 nm, respectively. Responses in the regions of 500 and 630 nm indicate the changes in myoglobin,[Citation33] where the peak difference at around 630 nm corresponds to absorption characteristics of methaemoglobin and metmyoglobin.[Citation13,Citation34] These findings well suggest internal quality changes in golden pompanos.
Figure 3. Spectroscopy analysis results: (a) original diffuse reflection responses; (b) two-dimensional PCA score plot; (c) SR SNR; (d) pompano quality predictive model using SR MaxSNR values of spectroscopy; and (e) forecasting accuracy evaluation of spectroscopy-based model.
PCA results
PCA score plots based on spectral feature data are obtained after dimensionality reduction. presents the principal components score projected onto a two-dimensional plane. The first two components capture 84.4% of data variance, covering most information. Although pompanos undergone different storage time can be classified into different categories, samples stored for 0, 2, and 3 days gather so closely that cannot be well-discriminated.
SR analysis results
After inputting spectroscopic signals into a non-linear SR system, stochastic resonance (SR) signal-to-noise ratio (SNR) can be calculated by adjusting noise intensity ranging from zero to 900. As presented in , SNR intensity is all lower than −50 dB. With the increase of noise intensity, all SNR values first decrease, then increase rapidly, followed by gradual decrease. At noise intensity of about 300, SNR maximum (MaxSNR) values of different samples appear. Also, MaxSNR values of different samples vary from each other. Therefore, spectroscopy SR MaxSNR values successfully characterise all samples in different quality degree.
By linear fitting MaxSNR values, the relationship between SR SNR and pompano storage time can be developed (see and Eq. 4). After one-step transform, Eq. (5) can be utilised as pompano quality predictive model based on spectroscopy.
displays the predicting accuracy of developed model (Eq. 5). The regression coefficient between predicting values and true values is 0.98616, indicating that the developed method based on spectroscopy analysis presents good accuracy.
EN analysis results
Original responses
EN sensor array original responses to pompanos are presented in . The initiative responses of eight sensors are close to zero. Sensors’ responses increase with the increase of measurement time. A rapid growth can be observed between 5 and 30 s. Finally, responses of all sensors trend to stable. EN responses to air as blank sample were measured during the experiment for 6 days. Results suggest that the EN shows high stability and their responses to air are lower than 0.005 V.
Figure 4. EN analysis results: (a) original response; (b) two-dimensional PCA score plot; (c) SR SNR spectrum; (d) pompano quality predictive model using SR MaxSNR values of EN; (e) forecasting accuracy evaluation of EN based model; and (f) forecasting accuracy evaluation of combined model.
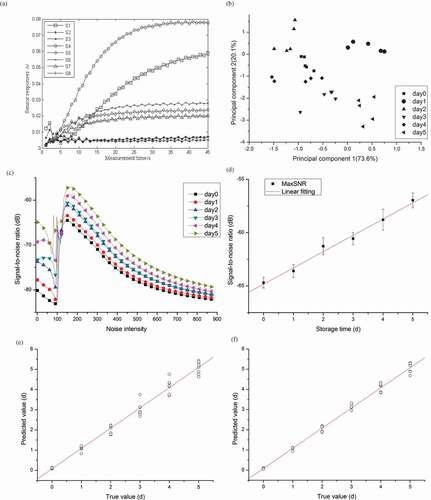
The volatiles emitted by pompanos are inhaled into EN gas chamber, and absorbed by the functional chemical materials located within the gas sensors. The selectivity of eight sensors (see Section 2.5) induces change in sensing material’s characteristics. Besides, sensor responses change with gas concentrations. EN sensor array stable values can be used to characterise pompano volatile concentrations. During experiment, diverse signals of EN sensor array were measured. The stable values presented an increase trend during storage, especially for sensors S1, S3, S4, S5, S6, and S7, indicating that ethanol, hydrogen sulphide, and alkanes are the main volatile spoilage products in pompano quality loss procedure. This phenomenon can be explained by fish spoilage as a result of microbial pollution.[Citation1]
PCA results
EN sensor array stable values are extracted as the input of PCA. presents the two-dimensional PCA score plot. The first two components capture 93.7% of data variance. Although pompanos of different storage time showed an approximate trend, there is no obvious discriminating border between each other. PCA method cannot totally discriminate all samples.
SR analysing results and freshness forecasting model
EN SNR is presented in . Noise intensity ranges from 0 to 900. With the increase of noise intensity, all SNR values first exhibit a decrease trend. Then SNR values present an abrupt increase and a series of Eigen peaks generate at noise intensity of about 180, followed by gradual decreases. MaxSNR values are within the range from −85 to −55 dB. So, pompanos with different quality can be quantitatively characterised by EN MaxSNR values.
Linear fitting regression between MaxSNR and storage time (Time) is conducted (see and Eq. 6). After one-step transform, Eq. (7) can be utilised as pompano freshness predictive model based on EN.
displays the predicting accuracy of developed model (Eq. 7). The regression coefficient between predicting values and true values is 0.98714, indicating that the developed method based on EN analysis presents better accuracy than the model based on spectroscopy analysis.
Pompano freshness predictive model based on spectroscopy combined with EN
Spectroscopy signals reflect the external image changes of pompano samples. EN reflects the internal chemical content changes of the samples. If these two methods are combined with each other to form a new freshness forecasting model, then the pompano freshness can be characterised from both external and internal aspects. We attempted to develop the mixed predictive model based on spectroscopy combined with EN for forecasting pompano quality. Two parameters, a and b, were preset. By inputting MaxSNRspec, MaxSNREN, and Time values into Eq. (8), a and b were calculated as 0.8764 and –0.2195, respectively. So, Eq. (9) could be utilised as pompano freshness mixed predictive model based on spectroscopy combined with EN.
displays the predicting accuracy of developed combined model (Eq. 9). The regression coefficient between predicting values and true values is 0.98965, indicating that the combined method presents better accuracy than the model based on spectroscopy analysis or EN analysis.
Validating experiments
Validating experiments are carried out to examine predicting accuracy of the developed model. Eq. (9) is used to examine the freshness of validating samples. Another 84 new pompanos are prepared, and 15 samples are randomly selected for EN measurement. Results are displayed in . The forecasting accuracy of the predicting model is 93.3%. Validating experiment results demonstrate that the developed model forecasts fish freshness with good accuracy.
Table 2. Validating experiment results (√ = right; x = wrong; / = not calculated).
Conclusions
In this article, golden pompano freshness forecasting method by utilising Vis/NIR spectroscopy combined with EN was investigated. The results were listed as follows,
Physical/chemical examination results demonstrated that the freshness of pompanos decreased. The shelf life of the sample was 4 days.
Both spectroscopy and EN sensitively responded to samples with different freshness. The use of two-dimensional PCA showed partially qualitative classification abilities for fish samples, while SR
values of spectroscopy and EN measurement data discriminated freshness degree of all samples.
Golden pompano freshness predictive model
Supplemental Material
Download ()Disclosure statement
The authors report no conflict of interest. All applicable international, national, and/or institutional guidelines for the care and use of animals were followed.
Supplemental data
Supplemental data for this article can be accessed on the publisher’s website.
Additional information
Funding
Related Research Data
References
- Wang, L.; Guo, H. Y.; Zhang, N.; Ma, Z. H.; Jiang, S. G.; Zhang, D. C. Molecular Characterization and Functional Analysis of a Peroxiredoxin 1 cDNA from Golden Pompano (Trachinotus ovatus). Developmental & Comparative Immunology 2015, 51(2), 261–270. DOI: 10.1016/j.dci.2015.03.011.
- Gao, M. S.; Feng, L. F.; Jiang, T. J.; Zhu, J. L.; Fu, L. L.; Yuan, D. X.; Li, J. R. The Use of Rosemary Extract in Combination with Nisin to Extend the Shelf Life of Pompano (Trachinotus ovatus) fillet during Chilled Storage. Food Control 2014, 37, 1–8. DOI: 10.1016/j.foodcont.2013.09.010.
- Zhou, C. P.; Ge, X. P.; Niu, J.; Lin, H. Z.; Huang, Z.; Tan, X. H. Effect of Dietary Carbohydrate Levels on Growth Performance, Body Composition, Intestinal and Hepatic Enzyme Activities, and Growth Hormone Gene Expression of Juvenile Golden Pompano, Trachinotus ovatus. Aquaculture 2015, 437, 390–397. DOI: 10.1016/j.aquaculture.2014.12.016.
- ICMSF. Sampling Plans for Fish and Shellfish. In International Commission on Microbiological Specifications for Foods, Microorganisms in Foods. Sampling for Microbiological Analysis: Principles and Scientific Applications, 2nd ed; University of Toronto Press: Canada, 1986; Vol. 2, pp 181–196.
- GB 2733-2005. Hygienic Standard for Fresh and Frozen Marine Products of Animal Origin; The National Hygiene Ministry: Beijing 2005.
- El Barbri, N.; Amari, A.; Vinaixa, M.; Bouchikhi, B.; Correig, X.; Llobet, E. Building of a Metal Oxide Gas Sensor-Based Electronic Nose to Assess the Freshness of Sardines under Cold Storage. Sensors and Actuators B: Chemical 2007, 128, 235–244. DOI: 10.1016/j.snb.2007.06.007.
- Hui, G. H.; Liu, W.; Feng, H. L.; Li, J.; Gao, Y. Y. Effects of Chitosan Combined with Nisin Treatment on Storage Quality of Large Yellow Croaker (Pseudosciaena crocea). Food Chemistry 2016, 203, 276–282. DOI: 10.1016/j.foodchem.2016.01.122.
- Altieri, I.; Semeraro, A.; Scalise, F.; Calderari, I.; Stacchini, P. European Official Control of Food: Determination of Histamine in Fish Products by a HPLC–UV-DAD Method. Food Chemistry 2016, 211, 694–699. DOI: 10.1016/j.foodchem.2016.05.111.
- Fu, L. L.; Chen, X. J.; Wang, Y. B. Quality Evaluation of Farmed Whiteleg Shrimp, Litopenaeus vannamei, Treated with Different Slaughter Processing by Infrared Spectroscopy. Food Chemistry 2014, 151, 306–310. DOI: 10.1016/j.foodchem.2013.11.012.
- Li, X. L.; He, Y.; Fang, H. Non-Destructive Discrimination of Chinese Bayberry Varieties Using Vis/NIR Spectroscopy. Journal of Food Engineering 2007, 81(2), 357–363. DOI: 10.1016/j.jfoodeng.2006.10.033.
- Wu, G. F.; Wang, C. G. Investigating the Effects of Simulated Transport Vibration on Tomato Tissue Damage Based on Vis/NIR Spectroscopy. Postharvest Biology and Technology 2014, 98, 41–47. DOI: 10.1016/j.postharvbio.2014.06.016.
- Alamprese, C.; Casale, M.; Sinelli, N.; Lanteri, S.; Casiraghi, E. Detection of Minced Beef Adulteration with Turkey Meat by UV–Vis, NIR and MIR Spectroscopy. LWT –Food Science and Technology 2013, 53(1), 225–232. DOI: 10.1016/j.lwt.2013.01.027.
- Sivertsen, A. H.; Kimiya, T.; Heia, K. Automatic Freshness Assessment of Cod (Gadus morhua) Fillets by Vis/NIR Spectroscopy. Journal of Food Engineering 2011, 103, 317–323. DOI: 10.1016/j.jfoodeng.2010.10.030.
- Hammond, J.; Marquis, B.; Michaels, R.; Oickle, B.; Segee, B.; Vetelino, J.; Bushway, A.; Camire, M. E.; Dentici, K. D. A Semiconducting Metal-Oxide Array for Monitoring Fish Freshness. Sensors and Actuators B: Chemical 2002, 84, 113–122. DOI: 10.1016/S0925-4005(02)00011-4.
- Peris, M.; Escuder-Gilabert, L. A 21st Century Technique for Food Control: Electronic Noses. Analytica Chimica Acta 2009, 638, 1–15. DOI: 10.1016/j.aca.2009.02.009.
- Pan, L. Q.; Zhang, W.; Zhu, N.; Mao, S. B.; Tu, K. Early Detection and Classification of Pathogenic Fungal Disease in Post-Harvest Strawberry Fruit by Electronic Nose and Gas Chromatography–Mass Spectrometry. Food Research International 2014, 62, 162–168. DOI: 10.1016/j.foodres.2014.02.020.
- Sanaeifar, A.; Mohtasebi, S. S.; Ghasemi-Varnamkhasti, M.; Ahmadi, H. Application of MOS Based Electronic Nose for the Prediction of Banana Quality Properties. Measurement 2016, 82, 105–114. DOI: 10.1016/j.measurement.2015.12.041.
- Hai, Z.; Wang, J. Electronic Nose and Data Analysis for Detection of Maize Oil Adulteration in Sesame Oil. Sensors and Actuators B: Chemical 2006, 119, 449–455. DOI: 10.1016/j.snb.2006.01.001.
- Xu, L. R.; Yu, X. Z.; Liu, L.; Zhang, R. A Novel Method for Qualitative Analysis of Edible Oil Oxidation Using an Electronic Nose. Food Chemistry 2016, 202, 229–235. DOI: 10.1016/j.foodchem.2016.01.144.
- Paolesse, R.; Alimelli, A.; Martinelli, E.; Di Natale, C.; D’Amico, A.; D’Egidio, M. G.; Aureli, G.; Ricelli, A.; Fanelli, C. Detection of Fungal Contamination of Cereal Grain Samples by an Electronic Nose. Sensors and Actuators B: Chemical 2006, 119, 425–430. DOI: 10.1016/j.snb.2005.12.047.
- Zhang, H. M.; Wang, J.; Tian, X. J.; Yu, H. C.; Yu, Y. Optimization of Sensor Array and Detection of Stored Duration of Wheat by Electronic Nose. Journal of Food Engineering 2007, 82, 403–408. DOI: 10.1016/j.jfoodeng.2007.02.005.
- Vestergaard, J. S.; Martens, M.; Turkki, P. Application of an Electronic Nose System for Prediction of Sensory Quality Changes of a Meat Product (Pizza Topping) during Storage. LWT – Food Science and Technology 2007, 40(6), 1095–1101. DOI: 10.1016/j.lwt.2006.06.008.
- Timsorn, K.; Thoopboochagorn, T.; Lertwattanasakul, N.; Wongchoosuk, C. Evaluation of Bacterial Population on Chicken Meats Using a Briefcase Electronic Nose. Biosystems Engineering 2016, 151, 116–125. DOI: 10.1016/j.biosystemseng.2016.09.005.
- Verma, P.; Yadava, R. D. S. Polymer Selection for SAW Sensor Array Based Electronic Noses by Fuzzy C-Means Clustering of Partition Coefficients: Model Studies on Detection of Freshness and Spoilage of Milk and Fish. Sensors and Actuators B: Chemical 2015, 209, 751–769. DOI: 10.1016/j.snb.2014.11.149.
- GB/T 5009.44-2003. Method for Analysis of Hygienic Standard of Meat and Meat Products; The National Hygiene Ministry: Beijing, 2003.
- AOAC. Official Methods of Analysis; Association of Official Agricultural Chemists: Washington, DC, USA, 17th ed; 2002.
- Singh, H.; Bhasker Raj, V.; Kumar, J.; Mittal, U.; Mishra, M.; Nimal, A. T.; Sharma, M. U.; Gupta, V. Metal Oxide SAW E-Nose Employing PCA and ANN for the Identification of Binary Mixture of DMMP and Methanol. Sensors and Actuators B: Chemical 2014, 200, 147–156. DOI: 10.1016/j.snb.2014.04.065.
- Wei, Z. B.; Wang, J.; Zhang, W. L. Detecting Internal Quality of Peanuts during Storage Using Electronic Nose Responses Combined with Physicochemical Methods. Food Chemistry 2015, 177, 89–96. DOI: 10.1016/j.foodchem.2014.12.100.
- Benzi, R.; Parisi, G.; Sutera, A.; Vulpiani, A. A Theory of Stochastic Resonance in Climatic Change. SIAM Journal on Applied Mathematics 1983, 43, 565–578. DOI: 10.1137/0143037.
- Dutta, R.; Das, A.; Stocks, N. G.; Morgan, D. Stochastic Resonance-Based Electronic Nose: A Novel Way to Classify Bacteria. Sensors and Actuators B: Chemical 2006, 115, 17–27. DOI: 10.1016/j.snb.2005.08.033.
- Li, T. T.; Li, J. R.; Hu, W. Z. Changes in Microbiological, Physicochemical and Muscle Proteins of Post Mortem Large Yellow Croaker (Pseudosciaena crocea). Food Control 2013, 34, 514–520. DOI: 10.1016/j.foodcont.2013.05.028.
- Xu, G. C.; Tang, X.; Tang, S. H.; You, H. B.; Shi, H. W.; Gu, R. B. Combined Effect of Electrolyzed Oxidizing Water and Chitosan on the Microbiological, Physicochemical, and Sensory Attributes of American Shad (Alosa sapidissima) during Refrigerated Storage. Food Control 2014, 46, 397–402. DOI: 10.1016/j.foodcont.2014.06.010.
- Reis, M. M.; Martínez, E.; Saitua, E.; Rodríguez, R.; Perez, I.; Olabarrieta, I. Non-Invasive Differentiation between Fresh and Frozen/Thawed Tuna Fillets Using Near Infrared Spectroscopy (Vis-NIRS). LWT – Food Science and Technology 2017, 78, 129–137. DOI: 10.1016/j.lwt.2016.12.014.
- Olsen, S. H.; Elvevoll, E. O. pH-Induced Shift in Hemoglobin Spectra: A Spectrophotometeric Comparison of Atlantic Cod (Gadus morhua) and Mammalian Hemoglobin. Journal of Agricultural and Food Chemistry 2011, 59(4), 1415–1422. DOI: 10.1021/jf1036273.