
 ?Mathematical formulae have been encoded as MathML and are displayed in this HTML version using MathJax in order to improve their display. Uncheck the box to turn MathJax off. This feature requires Javascript. Click on a formula to zoom.
ABSTRACT
The essential oil from Curcumae wenyujin (CWEO) has antibacterial activity, but the antibacterial compounds in the CWEO have not been identified. The spectrum-effect relationship between chemical compositions and pharmacological activity is regarded as a potentially useful tool to screen bioactive compounds. The binary chromatographic fingerprint of CWEO was established by gas chromatography/mass spectrometry (GC-MS) and high-performance liquid chromatography/diode-array (HPLC-DAD). A data-level information integration method was used to investigate the chemical characteristics encoded in two chromatographic fingerprints. Additionally, the antibacterial activity against Escherichia coli (E. coli)was determined by the liquid dilution method. The spectrum-effect relationship between the binary chromatographic fingerprint and antibacterial activity was investigated with principal component analysis (PCA) and orthogonal projection to latent structures (OPLS) analysis. Compared with a single data matrix, the combined data matrix allowed more accurate identification of the strong outliers in the PCA. Additionally, the results of OPLS were used to establish a spectrum-effect relationship with a closer correlation than that generated with the single data matrix. The results indicated that germacrone, curdione, and furanodiene were detected in HPLC and GC-MS fingerprints, and may be the main antibacterial components.
Abbreviations: CWEO, essential oil from C. wenyujin; MIC, minimum inhibitory concentration; OPLS, orthogonal projection to latent structures.
Introduction
Chinese herbal medicine (CHM) has been practiced in China for thousands of years, but the complex chemical systems in CHM make it difficult to identify the main effective compounds by chromatographic fingerprints. Many approaches have been applied to determine active ingredients in CHM, including analysis of the spectrum-effect relationship.[Citation1] The spectrum-effect relationship between chromatographic fingerprints and the pharmacological activity of herbal drugs, is established by data extraction and processing technologies, and can reveal the therapeutic effect and quality of CHM. The chromatographic fingerprints are usually performed using high-performance liquid chromatography (HPLC),[Citation2,Citation3] gas chromatography mass spectrometry (GC-MS),[Citation4] thin layer chromatography [Citation5] or capillary electrophoresis.[Citation6,Citation7] It is difficult to develop a single analytical method to identify all chemical characteristics of components in a single chromatogram. To address this, a multiple chromatographic fingerprint approach,[Citation8] which includes more than one fingerprint to present more characteristics of chemical components than a single fingerprint would include, has been applied. The use of a “multiple chromatographic fingerprint,” that combines different chromatographic methods with different separation principles, is recommended both by the Food and Drug Administration of US (FDA)[Citation9] and the State Food and Drug Administration of China.[Citation10]
Ezhu, the dried rhizomes of Curcuma wenyujin and related varieties, is officially listed in the 2015 version of the China Pharmacopoeia.[Citation11] As a kind of popular CHM, Ezhu is traditionally used for the treatment of tumors, gynecopathy, psoriasis, keratitis, and other infectious diseases in China. The essential oil from C. wenyujin (CWEO) has reported anti-tumor[Citation12,Citation13] and antiviral activities.[Citation14] Due to its medicinal importance, the essential oil has been analyzed by different analytical techniques, such as GC,[Citation15] HPLC,[Citation16] and GC-MS.[Citation17,Citation18] The GC-MS fingerprints and antimicrobial activities were used to correlate the antimicrobial activity of CWEO and the identified chemical components.[Citation18] However, GC-MS was unable to analyze two thermal sensitive compounds presented in CWEO, furanodiene, and furanodienone,[Citation17] which could be measured by HPLC.[Citation16] This illustrates why it is necessary to use a “multiple chromatographic fingerprint[Citation8]” to assess CWEO, to adequately determine all the chemical characteristics of components and identify the peaks potentially responsible for the antimicrobial activity .
In this work, CWEO was investigated based on binary chromatographic fingerprint by HPLC and GC-MS, and the antibacterial activities of the essential oil were measured against Escherichia coli (E. coli) by the liquid dilution method. The results from the analysis of HPLC, GC-MS, and in vitro antibacterial activities allowed establishment of the spectrum-effect relationship of CWEO to describe the specific components of CWEO with antibacterial activities.
Materials and methods
Samples, chemicals, and reagents
A total of 15 fresh rhizome samples of C. wenyujin were obtained from Zhejiang province. The fresh rhizomes were processed according to a traditional processing method. The essential oil from the rhizomes was extracted by hydro-distillation method. The crushed powder (60 g) was placed into a Clevenger apparatus with 480 mL water and subjected to hydro-distillation. The extraction process was performed for 6 h. The isolated oil was collected from the graduated receiver. To remove the water traces from the oil, anhydrous sodium sulfate (Na2SO4) was used to treat the extract. The oil samples were sealed in vials and stored at 4°C before they were subjected to analysis. Standard chemicals β-elemene, curcumol, furanodiene, germacrone, and curdione were purchased from the National Institute of China for Food and Drug Control and the Shanghai Yuanye Bio-Technology Co., Ltd. (Shanghai, China).
E. coli (44149) was provided by the Microbial Reagent Factory of the Center for Disease Control and Prevention of Jiangsu Province, China. Methanol and acetonitrile were of HPLC grade and obtained from Tedia Inc., USA. Ultrapure water was prepared using a Milli-Q water purification system (Millipore, USA). Other chemicals were of analytical-reagent grade and available locally.
Instruments
HPLC chromatograms of CWEO were performed using a Waters 515 system (Waters, Milford, MA, USA), containing auto-sampler manager, binary solvent delivery pump, diode-array detector and a column compartment, linked to the Waters Empower software. GC-MS analyses were operated on an Agilent (Little Falls, DE, USA) gas chromatograph 6890 installed with an inert 5975B mass selective detector with electron impact (EI) ionization chamber, an electronically controlled split/splitless injection port, a 7683B Series injector/auto-sampler, and NIST 05 mass spectrometer database, connected to Xcalibur1.2 solution workstation.
Antibacterial test
The antibacterial activity of the essential oils against E. coli was evaluated by the liquid dilution method.[Citation19] The essential oil extracted from 0.8 g fresh herb of C. wenyujin or an equivalent amount from processed products, was precisely added into 5 mL normal saline containing 0.4 g/100 mL Polysorbate 80 (Sigma Chemical Co., St Louis, MO, USA). Next, 1 mL oil solution plus 4 mL nutrient broth was used as the sample solution. A dilution series was performed, by transfer of 0.4 mL of sample solution into 1.6 mL of nutrient broth and then subsequent transfer of 1 mL mixed liquor into fresh tube, containing 1 mL nutrient broth. In this way, ten dilutions were prepared. The assay included a negative control containing only a nutrient broth, and a positive control containing ciprofloxacin (at a starting concentration of 0.01 mg/mL). To perform the assay, 10 μL of bacterial broth (107 CFU/mL, grown after culturing at 6 h at 37°C) was added to 0.1 mL of nutrient broth with the concentration diluted and spread in each tube. The minimum inhibitory concentration (MIC) was defined as the lowest concentration that inhibited the development of visible bacteria growth (i.e., resulted in no turbidity) in the tubes after 24 h incubation at 37°C. All results were represented by the average of three replicated experiments.
Chromatographic analysis
Preparation of sample solutions: The essential oil extracted from 0.4 g fresh herb of C. wenyujin or the equivalent amount of processed products was dissolved in 5 mL methanol, and then filtered through 0.45 μm millipore membrane to yield the sample solution for HPLC. Separately, the essential oil was mixed with methyl salicylate as an internal standard in 1 mL ether, and then filtered through 0.45 μm film to yield the sample solution for GC-MS.
GC-MS analysis: The GC-MS analysis of CWEO was performed with a fused silica capillary column (30 m × 0.25 mm, HP-5ms from Agilent, USA). The oven temperature program was 60°C (4 min) to 90°C at a rate of 3°C/min, 90°C–100°C at a rate of 2°C/min, 100°C–125°C at a rate of 5°C /min, 125°C–180°C at a rate of 1°C/min, and then 180°C–230°C at a rate of 25°C/min and that temperature was maintained for 5 min. Helium was used as carrier gas with a constant flow-rate of 1.0 mL/min. EI mode at 70 eV was used as the ionization mode of the spectrometers with a source temperature of 200°C. The split ratio was 1:20, the mass spectra plot was obtained with a scan range from 35 to 455 m/z, and the scan rate was 0.4 s per scan.[Citation12] The components were identified by comparing their mass spectra with data from NIST05 (National Institute of Standards and Technology, US).
HPLC analysis: The chromatographic separation was performed using a Kromasil C18 column (250 mm × 4.6 mm I.D., 5.0 μm) from Akzo Nobel (Bohus, Sweden), operated at 30°C. The mobile phase used solvent A (H2O) and solvent B (CH3CN). The elution conditions applied were: 40–47% B at 0–5 min, 47% B at 5–20 min, 47–60% B at 20–30 min, 60–80% B at 30–40 min, 80–90% B at 40–55 min, 90–100% B at 55–65 min, and then 100% B at 65–75 min with a flow-rate of 1.0 mL/min. The detection wavelength was set at 206 nm and the column operated at 30°C. The sample injection volume was 10 μL.
Method validation: The repeatability, reproducibility, and stability of experiments were evaluated by analyzing sample no. 25. The repeatability was evaluated by the relative retention time and the peak area of six injections. The reproducibility was assessed by six independent replicates of the sample no. 25 solution. Variations were evaluated by the relative standard deviations (RSDs) for intra- and inter-day using multiple preparations of the same sample. The peak areas and retention times of components were stable over 48 h.
Data pre-treatment and chemometric analysis: The investigation of the spectrum-effect relationship is a potential method to identify active components in complex herbal medicine. However, most reported methods to construct a spectrum-effect relationship rely on a single chromatogram.[Citation6,Citation20,Citation21] In this study, a data integration method[Citation22] was used to build a binary chromatographic fingerprint. Generally, the height of the peak, area or response value of a signal can delineate a chromatographic fingerprint. Thus, in the construction of binary chromatographic fingerprints, vector X and vector Y represented the fingerprint of HPLC and the fingerprint of GC/MS, respectively, and the following constraints were implemented:
where Xj refers to the absolute area of the fingerprint of HPLC, Yi refers to the absolute area of the fingerprint of GC-MS, jth and ith stand for the serial number of the peak, and the superscript t represents the transpose of the matrix. To minimize the variability from different chromatography, the area of the fingerprints from GC/MS and HPLC was normalized according to the following formalism:
Where is the normalized data and Xj is the absolute area of peak j in the fingerprint of HPLC or GC-MS. The new integrated vector
is expressed by
, which can indicate the chemical characteristics of the binary fingerprints. Thus, the data of HPLC and GC-MS from CWEO were simply connected in series. The chemometric data were analyzed with SIMCA-P 13.0 software (Umetrics, Umeå, Sweden). An overview of all samples was generated to identity strong outliers by principal component analysis (PCA).[Citation23] After data filtering, the HPLC, GC-MS, and the combined data with the MIC of the essential oil were imported into orthogonal projection to latent structures (OPLS), which is a modification of projection to latent structures with similar objectives to orthogonal signal correction (OSC). However, unlike OSC, the OPLS method automatically removes systematic information in X unrelated to the modeling of Y, which more easily validates orthogonal components. Thus, OPLS is recognized as a better method due to its facility, repeatability, and low time consumption.[Citation24] In this study, the 28 batches of CWEO analyzed by OPLS method were divided into two groups according to their raw material: one group of fresh herb samples and another group of samples derived from processed products. The data from these essential oil samples were utilized to build an OPLS model and the none-scaling method was selected to dispose the data prior because the fingerprints were normalized before PCA. The model performance was evaluated by the R2 and Q2 parameters, both of which vary between 0 and 1, where 1 shows an excellent fit. R2X is the cumulative modeled variation in X, indicating how much of the variation within a data set is explained by the various components of the model. The cumulative modeled variation in Y is represented by R2Y, and the cumulative predicted variation in Y is represented by Q2Y, indicating how accurately the data can be predicted according to cross-validation. In the OPLS modeling, potential biomarker candidates are generated based on the corresponding OPLS by their variable importance in projection (VIP) values.[Citation25,Citation26] The corresponding VIP value calculated from the OPLS model represents the differences of the variables. In this study, the components with VIP values greater than 1.5 were selected, and considered as playing important roles in differentiation.
Results and discussion
HPLC and GC-MS analysis of essential oil
In this work, chemical profiling of essential oil was achieved by HPLC and GC-MS, and the results are shown in and 2. The common peaks of HPLC were determined using Similarity Evaluation System for Chromatographic Fingerprint of TCM (Version 2004A), and the common peaks of GC-MS were confirmed by retention time, spectrum and the retrieval results from the NIST 05 library. The identification of the volatile compounds was based on the comparison with standard compounds or by library search in a MS library (NIST05).
Figure 1. Chromatographic fingerprint of CWEO by HPLC at 206 nm, 1. curdione, 2. curcumol, 3. germacrone, 4. furanodiene, 5. β- elemene.
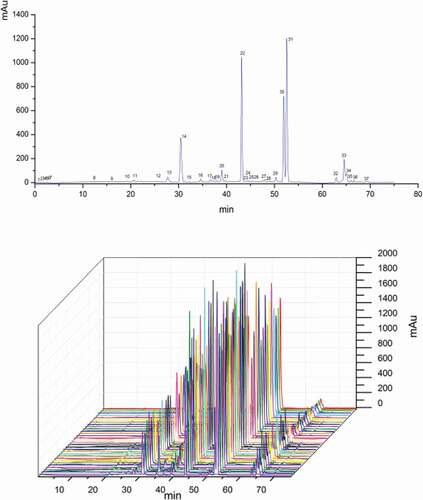
GC-MS can analyze the essential oil with a lower boiling point. As shown in , there are several peaks for CWEO. However, heat-sensitive components may not be detected by GC analysis, such as the furanodiene.[Citation17] HPLC also has limitations, and does not detect some volatile components with weak UV absorption or present at a low level of concentration (). After comparison both the number of separated peaks and their areas, the detection wavelength was set at 206 nm. The complex chemical characteristic ingredients of CWEO were then analyzed using the data from both the GC-MS chromatogram and the HPLC chromatogram.
Figure 2. GC-MS typical total ion chromatogram of CWEO, 1. camphene, 2. eucalyptol, 3. isobomeol, 4. methyl salicylate (internal standard), 5. β-elemene, 6. germacrone, 7. curdione.
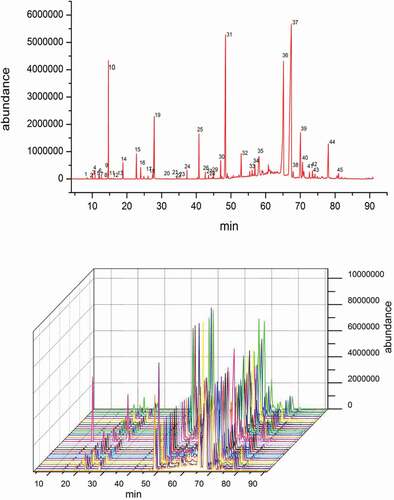
Binary chromatographic fingerprints of the essential oil: Essential oil samples from 30 batches of C. wenyujin from Zhejiang Province of China were separately analyzed by HPLC and GC-MS under optimal chromatographic separating conditions. Peaks with relatively high intensity and good resolutions were chosen as “common peaks,” indicating the sameness of the 30 samples. There were 37 common peaks present within 75 min from the HPLC chromatogram, and 45 common peaks within 90 min from the GC/MS chromatogram. Thus, the peak profile of the 37 constituents from HPLC chromatogram and the 45 constituents from GC/MS chromatogram were combined to establish the binary fingerprints of the CWEO.
Antibacterial activity against E. coli
The essential oil samples prepared from 30 batches of C. wenyujin were next assayed for antimicrobial activity against E. coli. The results of the antimicrobial activity tests are displayed in . All but sample no.5 demonstrated activity against E. coli. Eight essential oil samples exhibited high inhibitory effects with MIC below 0.5 μl/ml, 15 samples had MIC between 0.5 and 1.0 μl/ml, and five batches had MIC between 1 and 1.5 μl/ml. Only sample no. 8 exhibited low inhibitory effect with MIC above 2 μl/ml. Antibacterial activity of the essential oil from 30 batches of C. wenyujin. against E. coli.
Table 1. Antibacterial activity of the essential oil from 30 batches of C. wenyujin. against E. coli.
Chemometric analysis of HPLC and GC-MS data
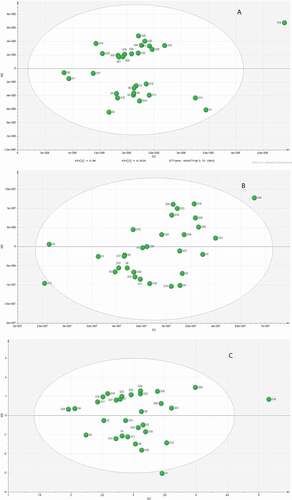
The unsupervised pattern recognition method, PCA was employed to identify strong outliers of the HPLC or GC-MS data for the 30 CWEO samples. OPLS was used to find potential markers responsible for antibacterial activity against E. coli. Because the binary fingerprint data was normalized, the single HPLC and GC-MS chromatograms data and the binary fingerprints after none scaled were applied to PCA to identity strong outliers and reduce the number of variables. As shown in PCA, in the score plot of GC-MS (), sample 16 was separated from the other samples. At the same time, the score plot of HPLC () indicated that sample 12 and 25, from different producing areas were outliers. However, the score plot of the binary fingerprints () gave two outliers: sample 1 and 16, both from the same producing area. As herbs from the same producing area should have more similar chromatograms than herbs from different regions,[Citation27] the PCA results of the binary fingerprints were more reasonable than the analysis of the GC-MS or HPLC data. Next, OPLS was employed to construct a model with a variable matrix including the HPLC, GC-MS peak area, and the binary fingerprints without the data for samples 1 and 16 (the two detected as strong outliers by PCA). Generally, the quality of an OPLS model is evaluated by the relevant R2X, R2Y, and Q2Y. A high level of R2Y depends on a high Q2Y. A Q2Y > 0.5 is considered good, and it is excellent if a Q2Y > 0.9. If a few outlying data points or many uncorrelated model terms are presented in the OPLS model, the differences between R2Y and Q2Y may be larger than 0.2–0.3.[Citation28]
Figure 3. The PCA score plot A. GC-MS, B. HPLC, C. The binary fingerprints.
As shown in , the values of R2X, R2Y, and Q2Y were all acceptable for the single HPLC or GC-MS data sets, but the combination of the two data resulted in improved values (R2Y = 0.838, Q2Y = 0.819), indicating better prediction. The results of GC-MS and the binary fingerprints have less difference between R2Y and Q2Y, increasing confidence in the analysis.
Table 2. Summary of OPLS.
Discussion
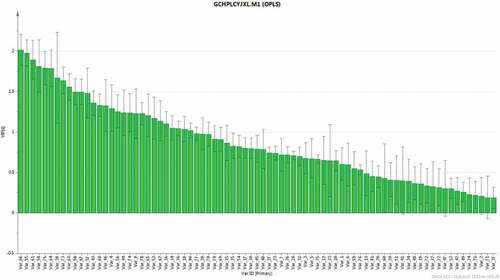
Based on the calculated VIP of the binary fingerprints (, the data of VIP > 1.5 were chosen), we found that nine variables (66, 55, 61, 58, 75, 64, 38, 73, and 63) made significant contributions to the antibacterial activity against E. coli. Eight of these nine variables were identified based on the HPLC fingerprints, and only one variable (38) was identified based on the GC-MS fingerprints. Furthermore, variables 66, 58 (From HPLC) (38 From GC-MS), and 75 were identified as germacrone, curdione, and furanodiene, respectively, which are together classified structurally as germacrenes.[Citation29] Previous reports have shown that germacrane sesquiterpenes have various biological purposes and effects in nature.[Citation30] The essential oil of Curcuma zedoaria, which has similar components with C. wenyujin,[Citation31] has been shown to have the antimicrobial activity against some of gram-positive and gram-negative pathogenic microorganisms.[Citation32] In vitro, germacrone and curdione were shown to have inhibitory effect against E. coli.[Citation33,Citation34] According to our knowledge, there was no previous report of inhibitory activity of furanodiene against E. coli, but its antifungal activity was described as less than that of germacrone.[Citation35] Interestingly, the VIP values of our assays against E. coli suggest that germacrone also has higher antibacterial activity than furanodiene. It has been suggested that the proton atom at C-8 might be contribute to the inhibitory activities on NO production of elemane-type sesquiterpenes,[Citation36] there have been no antibacterial activity-structure studies of these compounds, and additional studies are required.
Figure 4. The variable importance plot of the binary fingerprint in OPLC model.
Generally, spectrum-effect relationship studies utilize one-dimensional data matrices constructed of data from a single separation technique. In this study, CWEO was subjected to HPLC and GC-MS analysis, and the results were analyzed in one- or two-dimensional matrices. PCA analysis of the combined data matrix showed an improved ability to identity strong outliers that came from the same producing area. The OPLS-DA chemometric method of analysis was then applied to construct the spectrum-effect relationship based on the chromatographic characteristics of the data from the 28 samples and the antibacterial activities of these samples against E. coli. Compared with the one-dimensional data matrices, the investigated data matrix produced obviously better results, indicating better performance. The use of the two-dimensional matrices, allowed better representation of the chemical characteristics of the constituents of CHM than the use of one-dimensional data matrices, from either the GC-MS or HPLC analyses alone.
Conclusion
In this study, a data-level information fusion method was firstly applied to determine the active components of the CWEO. Germacrone, curdione, and furanodiene were identified as the components contributing to the good antibacterial activity of the samples against E. coli. Furthermore, this work shows that the construction of a spectrum-effect relationship based on two-dimensional matrices provides a powerful strategy to identify the peaks responsible for pharmacodynamic activities of herbal medicines.
Additional information
Funding
Related Research Data
References
- Zhu, C.-S.; Lin, Z.-J.; Xiao, M.-L.; Niu, H.-J.; Zhang, B. The Spectrum-Effect Relationship – A Rational Approach to Screening Effective Compounds, Reflecting the Internal Quality of Chinese Herbal Medicine. Chinese Journal of Natural Medicines 2016, 14(3), 177–184. DOI: 10.1016/S1875-5364(16)30014-0.
- Cheng, Y.; Chen, M.; Tong, W. An Approach to Comparative Analysis of Chromatographic Fingerprints for Assuring the Quality of Botanical Drugs. Journal of Chemical Information and Computer Sciences 2003, 43(3), 1068–1076. DOI: 10.1021/ci034034c.
- Cao, Y.; Wang, L.; Yu, X.; Ye, J. Development of the Chromatographic Fingerprint of Herbal Preparations Shuang-Huang-Lian Oral Liquid. Journal of Pharmaceutical and Biomedical Analysis 2006, 41(3), 845–856. DOI: 10.1016/j.jpba.2006.01.060.
- Samadi, N.; Masoum, S.; Mehrara, B.; Hosseini, H. Application of Linear Multivariate Calibration Techniques to Identify the Peaks Responsible for the Antioxidant Activity of Satureja hortensis L. and Oliveria decumbens Vent. Essential Oils by Gas Chromatography–Mass Spectrometry. Journal of Chromatography B 2015, 1001, 75–81. DOI: 10.1016/j.jchromb.2015.07.037.
- Xie, P. S.; Yan, Y. Z. Differentiation and Evaluation of Ginsengs and Their Preparations by Means of HPTLC Fingerprint Analysis. Journal of Planar Chromatography- Modern TLC 1988, 1, 29–34.
- Kusznierewicz, B.; Piasek, A.; Bartoszek, A.; Namiesnik, J. The Optimisation of Analytical Parameters for Routine Profiling of Antioxidants in Complex Mixtures by HPLC Coupled Post Column Derivatisation. Phytochemical Analysis 2011, 22(5), 392–402. DOI: 10.1002/pca.v22.5.
- Wang, L. C.; Cao, Y. H.; Xing, X. P.; Ye, J. N. Fingerprint Studies of Radix Scutellariae by Capillary Electrophoresis and High Performance Liquid Chromatography. Chromatographia. 2005, 62(5–6), 283–288. DOI: 10.1365/s10337-005-0624-6.
- Fan, X.-H.; Cheng, -Y.-Y.; Ye, Z.-L.; Lin, R.-C.; Qian, -Z.-Z. Multiple Chromatographic Fingerprinting and Its Application to the Quality Control of Herbal Medicines. Analytica Chimica Acta 2006, 555(2), 217–224. DOI: 10.1016/j.aca.2005.09.037.
- FDA. FDA Guidance for Industry—Botanical Drug Products (Draft Guidance); US Food and Drug Administration: Silver Spring, MD, 2000.
- SFDA. State Food and Drug Administration of China; Drug Stand. Chin.: Beijing, China, 2000; p 3.
- CPC. Pharmacopoeia of the Peoples Republic of China, in No. 1; Chinese Medical Science and Technology Press: Beijing, 2015; pp 1749.
- Nie, X.H.; Ao, Z.H.; Yin, G.Y.; Tao, W.Y. Effect of Extraction Techniqueson the Components and Antitumor Activity in Vitro of Volatile Oil from Curcuma Wenyujin. Pharmaceutical Biotechnology-Beijing 2003, 10(3), 152–154.
- Jp, J. Research Survey of the Antitumor Activity of Ezhu. Journal of traditional Chinese medicine 2000, 33, 62–64.
- Xia, Q.; Huang, Z.G.; Li, S. P.; Zhang. P. ; Wang, J.; He, L.N. The Experiment Study of the Anti-Virus Effects of Zedoary Oil on Influenza Virus and Respiratory Syncytial Virus. Chinese Pharmacological Bulletin 2004, 20(3), 357–358.
- Yang, F. Q.; Wang, H. K.; Chen, H.; Chen, J. D.; Xia, Z. N. Fractionation of Volatile Constituents from Curcuma Rhizome by Preparative Gas Chromatography. Journal of Automated Methods and Management in Chemistry 2011, 2011, 1–6. DOI: 10.1155/2011/942467.
- Yang, F.; Wang, Y.; Li, S. Simultaneous Determination of 11 Characteristic Components in Three Species of Curcuma Rhizomes Using Pressurized Liquid Extraction and High-Performance Liquid Chromatography. Journal of Chromatography A 2006, 1134(1–2), 226–231. DOI: 10.1016/j.chroma.2006.09.048.
- Yang, F.; Li, S. P.; Zhao, J.; Lao, S. C.; Wang, Y. T. Optimization of GC–MS Conditions Based on Resolution and Stability of Analytes for Simultaneous Determination of Nine Sesquiterpenoids in Three Species of Curcuma rhizomes. Journal of pharmaceutical and biomedical analysis 2007, 43(1), 73–82. DOI: 10.1016/j.jpba.2006.06.014.
- Zhu, J.; Lower-Nedza, A. D.; Hong, M.; Jie, S.; Wang, Z.; Yingmao, D.; Tschiggerl, C.; Bucar, F.; Brantner, A. H. Chemical Composition and Antimicrobial Activity of Three Essential Oils from Curcuma wenyujin. Natural product communications 2013, 8(4), 523–526.
- Bonjar, G. S. Evaluation of Antibacterial Properties of Iranian Medicinal-Plants against Micrococcus luteus, Serratia marcescens, Klebsiella pneumoniae and Bordetella bronchoseptica. Asian Journal of Plant Sciences 2004, 3(1), 82–86. DOI: 10.3923/ajps.2004.82.86.
- Zhu, H.; Wang, Y.; Liang, H.; Chen, Q.; Zhao, P.; Tao, J. Identification of Portulaca oleracea L. From Different Sources Using GC–MS and FT-IR Spectroscopy. Talanta. 2010, 81(1–2), 129–135. DOI: 10.1016/j.talanta.2009.11.047.
- Duo-Long, D.; Zheng, Y.-Y.; Chen, X.-F.; Huang, X.-Y.; Feng, S.-L. Advances in Application of High-Speed Countercurrent Chromatography in Separation and Purification of Flavonoids. Chinese Journal of Analytical Chemistry 2011, 39(2), 269–275. DOI: 10.1016/S1872-2040(10)60419-7.
- Yao, W.; Gu, H.; Zhu, J.; Barding, G.; Cheng, H.; Bao, B.; Zhang, L.; Ding, A.; Li, W. Integrated Plasma and Urine Metabolomics Coupled with HPLC/QTOF-MS and Chemometric Analysis on Potential Biomarkers in Liver Injury and Hepatoprotective Effects of Er-Zhi-Wan. Analytical and bioanalytical chemistry 2014, 406(28), 7367–7378. DOI: 10.1007/s00216-014-8169-x.
- Rajalahti, T.; Kvalheim, O. M. Multivariate Data Analysis in Pharmaceutics: A Tutorial Review. International Journal of Pharmaceutics 2011, 417(1–2), 280–290. DOI: 10.1016/j.ijpharm.2011.02.019.
- Ebrahimabadi, E. H.; Ghoreishi, S. M.; Masoum, S.; Ebrahimabadi, A. H. Combination of GC/FID/Mass Spectrometry Fingerprints and Multivariate Calibration Techniques for Recognition of Antimicrobial Constituents of Myrtus communis L. Essential Oil. Journal of Chromatography B 2016, 1008, 50–57. DOI: 10.1016/j.jchromb.2015.11.010.
- Wu, X.; Li, Y.; Wang, Q.; Li, W.; Feng, Y. Effects of Berberine and Pomegranate Seed Oil on Plasma Phospholipid Metabolites Associated with Risks of Type 2 Diabetes Mellitus by U-HPLC/Q-TOF-MS. Journal of Chromatography B 2015, 1007, 110–120. DOI: 10.1016/j.jchromb.2015.11.008.
- Guo, F.-Q.; Liang, Y.; Xu, C.; Huang, L.; Li, X. Comparison of the Volatile Constituents of Artemisia capillaris from Different Locations by Gas Chromatography–Mass Spectrometry and Projection Method. Journal of Chromatography A 2004, 1054(1–2), 73–79. DOI: 10.1016/S0021-9673(04)01473-6.
- Eriksson, L.; Kettaneh-Wold, N.; Trygg, J.; Wikström, C.; Wold, S. Multi-And Megavariate Data Analysis: Part I: Basic Principles and Applications; Umetrics Inc.: Umea, Sweden, 2006.
- Adio, A. M. Germacrenes A–E and Related Compounds: Thermal, Photochemical and Acid Induced Transannular Cyclizations. Tetrahedron. 2009, 65(8), 1533–1552. DOI: 10.1016/j.tet.2008.11.050.
- Connolly, J. D.; Hill, R. A. Dictionary of Terpenoids; Chapman & Hall: London, UK, 1991. DOI:10.1002/ffj.2730070418
- Li, J.; et al. 9-Nitrocamptothecin Nanostructured Lipid Carrier System: In Vitro Releasing Characteristics, Uptake by Cells, and Tissue Distribution In Vivo. Yao Xue Xue Bao= Acta Pharmaceutica Sinica. 2005, 40(11), 970–975. DOI:10.16438/j.0513-4870.2005.11.003
- Lai, E. Y. C.; Chyau, C.-C.; Mau, J.-L.; Chen, C.-C.; Lai, Y.-J.; Shih, C.-F.; Lin, L.-L. Antimicrobial Activity and Cytotoxicity of the Essential Oil of Curcuma Zedoaria. The American Journal of Chinese Medicine 2004, 32(02), 281–290. DOI: 10.1142/S0192415X0400193X.
- Uechi, S.; Ishimine, Y.; Hongo, F. Antibacterial Activity of Essential Oil Derived from Curcuma sp. (Zingiberaceae) against Foodborne Pathogenic Bacteria and Its Heat-Stability. Science Bulletin of the College of Agriculture-University of the Ryukyus (Japan) 2000, 47, 129–136.
- Phan, M. Antibacterial Activity of Sesquiterpene Constituents from Some Curcuma Species in Vietnam. Tap Chi Hoa Hoc 2000, 38(1), 91–94.
- Tsasi, G.; Sokovic, M.; Ciric, A.; Eriotou, E.; Sakadani, E.; Samaras, Y.; Skaltsa, H., Antifungal Compounds Isolated from Smyrnium olusatrum L. Essential Oil, Growing Wild in Cephalonia, Greece. Chemical Analysis and Structure Elucidation. Records of Natural Products 2016, 10(1), 93–102.
- Xia, G.; Zhou, L.; Ma, J.; Wang, Y.; Ding, L.; Zhao, F.; Chen, L.; Qiu, F. Sesquiterpenes from the Essential Oil of Curcuma Wenyujin and Their Inhibitory Effects on Nitric Oxide Production. Fitoterapia. 2015, 103, 143–148. DOI: 10.1016/j.fitote.2015.03.021.
- Ma, J.-H.; Zhao, F.; Wang, Y.; Liu, Y.; Gao, S.-Y.; Ding, L.-Q.; Chen, L.-X.; Qiu, F. Natural Nitric Oxide (NO) Inhibitors from the Rhizomes of Curcuma phaeocaulis. Organic & biomolecular chemistry 2015, 13(30), 8349–8358. DOI: 10.1039/C5OB00964B.