 ?Mathematical formulae have been encoded as MathML and are displayed in this HTML version using MathJax in order to improve their display. Uncheck the box to turn MathJax off. This feature requires Javascript. Click on a formula to zoom.
ABSTRACT
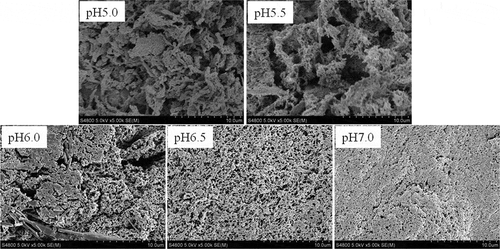
Texture of muscle food is dependent on the gelation properties of myofibrillar protein. Defining the performance of myofibrillar protein during gelation is beneficial for maintaining quality and developing muscle food. The myofibrillar protein from abalone muscle (AMP) was extracted and the gel-forming ability was investigated. The lowest protein solubility of AMP in distilled water was obtained at pH 5.5, but shifted to a lower pH value by ionic strength. The breaking force and deformation of AMP gel formed at pH 7.0 were 48.00 g and 27.70 mm, respectively, but they could not be detected at pH 5.0 and pH 5.5 due to the low gel-forming ability. Scanning electron microscopy data showed that a coarse and disorder gel containing clusters of agglomerates was observed at pH 5.0 and pH 5.5, but gradual compact network structure was observed in the gel formed at increasing pH. The glass transition temperature (Tg) of AMP gel formed at pH 5.5 was higher than that of AMP, and the Tg of AMP gel was increased with increasing the pH of gel-forming solution. It was found that the unfolding of tertiary structure of AMP at pH 7.0 was easier than that at pH 5.5 through the result of infrared spectra. We therefore conclude that both the solubility and gel-forming ability of AMP are pH dependent.
Introduction
Abalone is considered as one of the most highly valued seafood especially in south-east Asia due to its delicious taste and nutritional richness. Abalone yield of China has grown rapidly and reached 128,000 tons in 2015 years, and Fujian province account for 80%.[Citation1] In order to enable abalone to be sold in other regions, the products of abalone were treated by heating, such as dried abalone, frozen-steamed abalone, and canned abalone, which are increased gradually in the market. Some researchers have paid attention to the effect of heat treatment on the texture of abalone muscle. Gao et al.[Citation2–Citation4] investigated the effect of steaming and boiling on the rheological properties and histological structure of abalone muscle; the results revealed that the denaturation of myofibrillar protein, gelatination of collagen, and change of muscle tissue structure will cause modification in rheological properties. Zhu et al.[Citation5] reported that the alteration of shear force was closely correlated to myofibrils’ shrinkage and collagen gelatination in abalone muscle. These results confirm that myofibrillar protein has a certain impact on the texture of abalone muscle food. However, the physicochemical properties and thermal properties of AMP are rarely reported.
Myofibrillar proteins have an excellent gel-forming ability, which is mainly composed of myosin, actin, actomyosin, and tropomyosin. It is well known that myofibrillar protein plays an important role on the textural properties of muscle food.[Citation6] Researchers reported that myofibrillar protein is responsible for the water holding capacity (WHC) of muscle food.[Citation7] The higher texture profile analysis texture characteristics of fish are related to a higher content of myofibrillar protein.[Citation8] The degradation of beef myofibrillar protein caused more tender meat.[Citation9] One of the most important properties of myofibrillar protein in muscle food is their ability to form gel during the heating process. Gel formation in muscle involves partial denaturation of protein followed by irreversible aggregation which results in a three-dimensional network.[Citation10] During myofibrillar protein network formation, water retention is improved, affecting the yield, juiciness, and texture of the final muscle food. The gel properties of protein can be influenced by various factors, and pH is considered as one of the most important factors. For instance, a neutral pH was most beneficial for formation of the heat-induced scallop actomyosin gel.[Citation11] During heating at 1°C/min, fish myosin formed gel only at pH 5.5–7.5, but not at pH 8.0 and pH 9.0.[Citation12] In addition, it was reported that the higher gelling quality was produced by alkaline solubilization processing than conventionally washed surimi from Atlantic menhaden.[Citation13] Myofibrillar protein is the major protein of abalone, which is about 60% of total protein content.[Citation14] However, the gel properties of AMP that may play a key role in abalone muscle food have not been reported.
Fourier transform infrared spectroscopy (FTIR) is generally used to research the secondary structure of proteins in diverse environments, making it become a valuable technique for studying protein denaturation and aggregation. Amide I (1600–1700 cm−1) and amide II (1500–1600 cm−1) are considered to be the indicators of the secondary structure of proteins, but more researches are focused on amide I than amide II.
In this study, the effects of pH on the protein solubility of AMP and on the characteristics of its heat-induced gels were investigated, which aim to collect more insight into the gel properties of abalone myofibrillar protein and obtain theoretical guidance for developments in abalone muscle food.
Materials and methods
Materials
Fresh abalones (Haliotis Discus Hannai Ino) were purchased from Xiamen Dongyueyu Marine Food Co., Ltd. The abalone was 3-year-old, weighing 60 ± 10 g (including the shell and viscera).
AMP extraction
Myofibrillar protein was prepared from abalone muscle according to the method of Paredi[Citation15] with some modification. After removing the shell and viscera from abalone, the muscle was minced and mixed with 20 volumes of solution A (40 mM NaCl, 0.5 mM DTT, 1 mM MgCl2, 1 mM EGTA, and 10 mM phosphate buffer, pH 7.0). The mixture was then homogenized (FA25 Superfine Homogenizer, Fluko Equipment Shanghai Co., Ltd, Shanghai, China) at 10,000 rpm for 5 min. To avoid overheating, the sample was placed on ice and homogenized intermittently (25 s followed by a 10 s rest interval). The homogenate was then centrifuged at 10,000 rpm for 10 min. The sediment was collected, and the steps described above were repeated two times. The final acquisition was resuspended in 10 volumes of solution B (0.6 M NaCl, 1 mM EGTA, and 10 mM phosphate buffer, pH 7.0) and then centrifuged at 12,000 rpm for 30 min. Finally, the supernatant was subjected to dialysis in distilled water and freeze-dried to obtain the AMP. The freeze-dried AMP was dissolved in 2% SDS–8 M urea–20 mM Tris–HCl (pH 8.8) for checking the purity by sodium dodecyl sulphate-polyacrylamide gel electrophoresis (SDS-PAGE). All solutions used for the AMP preparation were kept cold at 4°C to minimize proteolysis and protein denaturation.
Protein solubility
Protein solubility of AMP was determined in 4°C distilled water or buffer solution (0.6 M NaCl, 50 mM sodium phosphate, pH 6.0, 4°C) within a range of pH values from 3.0 to 8.0. Protein concentration was diluted to 10 mg/ml, adjusted to the target pH values (from 3.0 to 8.0) using 0.1 M HCl or NaOH, and then collected protein solution was subjected to centrifugation (6000 rpm, 4°C, 15 min) in a refrigerated centrifuge (Eppendorf Centrifuge 5417R, Eppendorf AG, Hamburg, Germany). The protein subunits of supernatants were determined by SDS-PAGE. The protein concentration in the supernatant was determined using the Lowry method[Citation16] with bovine serum albumin as a standard. The protein solubility was determined according to the method of Tang[Citation17] and can be calculated using the following formula:
AMP solubility (%) = (protein concentration of sample/protein concentration of control) × 100
Sodium dodecyl sulphate-polyacrylamide gel electrophoresis
SDS–PAGE was performed with 4% stacking gel and 8% separating gel according to the method of Laemmli.[Citation18] After electrophoresis, gels were stained with 0.025% Coomassie Brilliant Blue R-250 in 5% methanol and 10% acetic acid and destained with 30% methanol and 10% acetic acid. A protein standard (Fermentas Life Sciences, Hanover, MD, USA) ranging from 10 to 200 kDa was used to estimate the molecular weight of the proteins.
Preparation of the AMP gels
The AMP was dissolved in buffer solution (0.6 M NaCl, 50 mM sodium phosphate, pH 6.0, 4°C). Protein concentration was diluted to 40 mg/ml, adjusted to the target pH values (from 5.0 to 7.0) using 0.5 M HCl or NaOH, and stirred to ensure sample homogeneity. The AMP gel-forming solution was placed into 10 ml glass beakers (diameter 25mm) and the height of AMP gel-forming solution in the glass beakers was approximately 30 mm. Three replicates of each treatment were used. The glass beakers were heated in a water bath (TXF200-S12 Model, Grant Instruments Ltd., Cambridge, UK) from 25°C to 80°C at 1.0°C/min increments, and then held at 80°C for 20 min. The glass beakers were immediately cooled by being held in ice water and then stored at 4°C overnight before analysis.
Textural properties
Textural properties of AMP gels were measured by a texture analyzer (TMS-PRO, Food Technology Co., USA) equipped with a spherical probe (diameter 5 mm) and 10 N load cell for breaking force (g) and deformation (mm) at a penetration speed of 30 mm/min. The textural properties of all the AMP gels were measured at room temperature and every measurement was repeated three times.
Water holding capacity
The WHC (%) was measured according to Kocher[Citation19] with slight modifications. The AMP gels were centrifuged at 1000 rpm for 10 min at 4°C. The weights of AMP gels before centrifugation and moisture loss were all recorded. The following formula was used to determine WHC (%):
where ML was the amount (g) of moisture loss from the AMP gel during centrifugation and CG was the weight of the heated AMP gel (g) before centrifugation. All treatments were run in triplicate.
Scanning electron microscopy
The microstructure of AMP gels was performed by the scanning electron microscope (S-4800, Hitachi Co., Tokyo, Japan). Samples were prepared with a thickness of 2–3 mm and then immersed in 0.1 M phosphate buffer (pH 7.2) containing 2.5% (v/v) glutaraldehyde at 4°C overnight. Then, the samples were washed three times with 0.1 M phosphate buffer (pH 7.2) before being dehydrated in ethanol with serial concentrations of 30%, 50%, 60%, 70%, 80%, 90%, and 100% (v/v). After being dehydrated, the samples were dried at the critical point (Tousimis samdri-PVT-3D, Rockville, MD, USA) using CO2 as a transition fluid. The prepared samples were mounted on aluminum specimen holders and coated with gold (Hitachi E-1010, Tokyo, Japan) and observed at an acceleration voltage of 5 kV.
Differential scanning calorimeter (DSC)
Thermal properties of the AMP and AMP gels were determined using DSC (Q2000, TA instruments, New Castle, DE, USA). Temperature calibration was performed using the Indium thermogram. Prior to the glass transition temperature (Tg) analysis using DSC, the AMP gels were freeze-dried and then conditioned in a desiccator containing silica gel for 2 weeks at room temperature to obtain the most dehydrated powders possibly. The AMP and AMP gels (5–10 mg) were accurately weighed into aluminum pan and sealed with hermetic lid, then scanned over the range from −10°C to 200°C at a basic heating rate of 10°C/min. Thermal denaturation temperature (Tm) of freeze-dried AMP was determined in 4°C distilled water at a protein concentration of 200 mg/ml, and scanned over the range from 5°C to 90°C at a basic heating rate of 2°C/min. An empty and sealed aluminum pan was used as a reference. The Tg and Tm of samples were obtained from the inflexion point of heat flow thermograms.
Fourier transform infrared spectroscopy
The FTIR spectroscopy analyses were carried out at room temperature, using a Thermo Nicolet iS50 FTIR spectrometer (Thermo Scientific, Waltham, MA, USA). The spectra in the range of 4000–400 cm−1 were rationed, and automatic signals gained were collected in 16 scans at a resolution of 4 cm−1. Prior to FTIR analysis, the freeze-dried AMP gels were conditioned in a desiccator containing silica gel for 2 weeks at room temperature and then mixed with KBr in a ratio of 1: 100 (w/w) and pressed into thin slices. The AMP were dried and directly pressed into thin slices for analysis of FTIR.
Statistical analysis
The data were analysed using Excel and SPSS for Windows v17.0 (SPSS Inc., Chicago, IL). Analysis of variance and Duncan’s multiple-range test were performed for statistical analyses. The probability value of p < 0.05 was used as the criterion for significant differences.
Results and discussion
Protein solubility
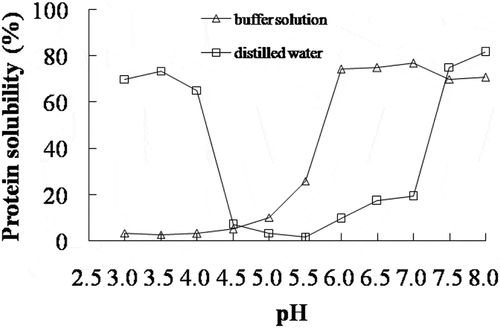
The solubility of AMP was determined in distilled water or buffer solution at different pH values (). In the distilled water, the lowest protein solubility of AMP was obtained at pH 5.5, and the protein solubility became higher with decreasing or increasing pH of AMP solution. This trend was similar to that of silver carp surimi.[Citation20] The net charge on the surface of the protein was decreased when the pH of protein solution was close to the isoelectric point,[Citation21] resulting in the decrease of electrostatic repulsion and protein solubility. Therefore, it was found that the isoelectric point of AMP was around pH 5.5. In the buffer solution, the lowest solubility of AMP was obtained at a lower pH value, probably since proteins are in a very unstable state under such conditions which would favour protein denaturation and consequently aggregation even at low temperature.[Citation22] The chloride ion binds with the positively charged amino acids to a stronger degree than the sodium ion, so the negative net charge of protein was increased by adding salts,[Citation12] which resulted in an increase of electrostatic repulsion and AMP solubility at pH 5.0–7.0 (). These results clearly showed that the AMP solubility at different pH was altered by ionic strength.
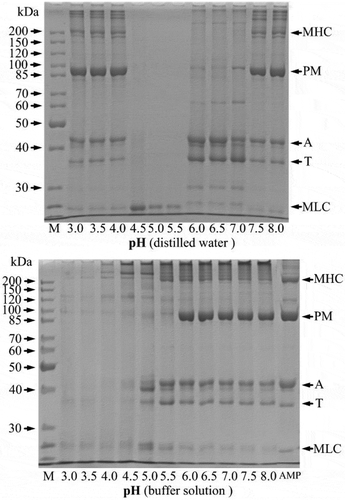
The protein fractions dissolved at different pH values were analysed by SDS-PAGE and shown in . In the distilled water, the protein fractions dissolved at pH 3.0–4.0 and 7.5–8.0 included all proteins of AMP. Especially, the band intensity of paramyosin (PM) was higher than the others, indicating that PM was the major component in the AMP. In pH of 4.5–5.5, only a band of less than 25 kDa was found. However, all protein fractions of AMP were dissolved only at pH 6.0–8.0 in the buffer solution, and the band intensity of them was disappeared with decreasing pH. The protein solubility () and the band intensity of protein fractions of AMP () showed a good correlation.
Textural properties
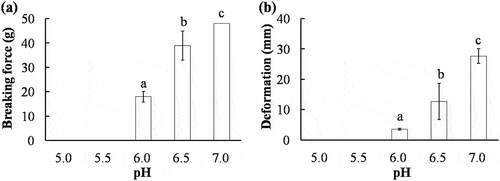
The breaking force and deformation of AMP gels are shown in . The breaking force and deformation of AMP gels formed at pH 5.0 and 5.5 were not detected due to the low gel-forming ability. Protein solubility is assumed to be a prerequisite for formation of protein gels. Proteins aggregate and are least soluble at their isoelectric point; this results in poor gels or even prevents gel formation.[Citation6] However, the breaking force and deformation of AMP gels elevated gradually as the pH of gel-forming solution increased from pH 6.0 to 7.0. Similar results have been reported in scallop actomyosin gels.[Citation11] An optimal gel formation was generally observed at pH 6.0 for fish myofibrils.[Citation23,Citation24] The negative effect of high pH on heat-induced gel for myofibrillar protein of fish was also reported and no gel was formed at pH 7.0.[Citation22] It was reported that the gel-forming ability of invertebrate actomyosin was different from fish actomyosin, and such differences were probably caused by the protein composition ratio of actomyosin and thermal stability, especially the largest divergence between invertebrate and fish is the presence or absence of the PM.[Citation25] Therefore, it may be concluded that the AMP dissolved in buffer solution had a greater gel-forming ability at high pH.
Water holding capacity
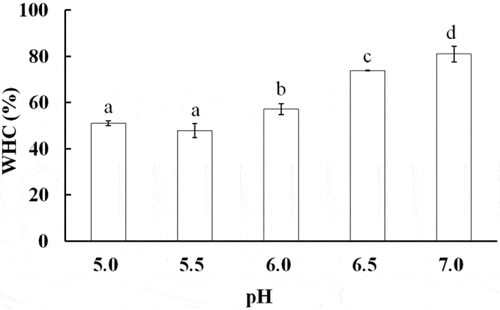
The WHC (%) of AMP gels at various pH values is shown in . This figure shows that the WHC increased significantly from 47.8% to 81.0% as the pH values were increased from 5.5 to 7.0. The results were similar to those obtained with fish and porcine myosin gels.[Citation12,Citation26] The WHC of protein gel usually represented the ability of protein to bind water. As the pH approached the isoelectric point of AMP, proteins tend to aggregate before heating because of increases in protein–protein interactions,[Citation21] resulting in the appearance of the formed heat-induced AMP gels that exhibited obvious syneresis. The capillaries of the insoluble protein system have contributed to entrap water for the protein. Above the isoelectric point of AMP, the protein swelled and bound a plenty of water because of an increase in binding sites for water molecules by electrostatic repulsion. Therefore, the WHC of AMP gel was increased with increasing the pH of gel-forming solution. It was interesting to note that the higher the breaking force of AMP gels, the higher the WHC. Chung et al. also reported that gel strength and WHC of Pacific whiting surimi increased as the pH was increased from 5.0 to 7.0.[Citation27]
Scanning electron microscopy
shows the scanning electron micrographs of AMP gels at various pH values. The gel-forming solution at pH 5.0 and pH 5.5 all formed a coarse and disorder gel with clusters of agglomerates, but gradually dense gel structure was observed in the gel formed at increasing pH, suggesting that the pH was able to change the surface structure of AMP gels. The charged groups of AMP were reduced gradually as the pH became close to the isoelectric point, resulting in the rate of aggregation faster than denaturation, and then the faster aggregation rate led to a coarse gel network and a low WHC.[Citation19] In contrast, a more compact gel network can be obtained if the rate of aggregation is slower than denaturation. Therefore, it could be presumed that the relative speed of denaturation and aggregation of the AMP at pH 7.0 were beneficial for formation of a fine gel network. With an increase in the pH of gel-forming solution, the smaller pores’ diameter in the three-dimensional network led to a larger specific surface of the gel structure, which resulted in a large effective contact area between protein and water molecules. Thus, the AMP gel formed at high pH had a greater WHC () because the water did not migrate easily, indicating that the WHC of gels was closely related to the microstructure. Similar results were reported in the lamb myofibrillar protein.[Citation21]
Differential scanning calorimeter
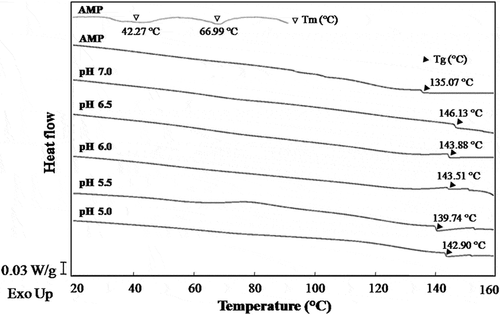
Thermal denaturation temperature (Tm) of AMP was analysed in . DSC thermograms of AMP showed two endothermic transitions with 42.27°C and 66.99°C, respectively. The first transition in DSC thermograms of AMP would be related to PM and myosin denaturation, and the actin contributed to the second transition. Similar results were reported in the scallop myofibrils.[Citation28]
The glass transition is the transformation of amorphous material from a glassy to a rubbery state with an increase in molecular mobility due to elevating temperature. In fact, the glass transition of polymers is considered to be strongly related to the molecular (microscopic) state.[Citation29] As shown in , the Tg of AMP was lower than that of AMP gel formed at pH 5.5. Generally, the Tg of protein could be enhanced because of the molecular cross-linking during protein gelation process. The cross-linking of proteins is caused by various molecular forces, including hydrogen bonding, hydrophobic interactions, disulphide bonding, ionic attractions, or a combination of these forces.[Citation30]
Mizuno et al.[Citation29] pointed out that the Tg of biopolymers in general can be determined by the state of the noncovalent bonds. Taylor[Citation31] stated that lower glass transition of matrix could be due to less hydrogen bonding involvement in glassy state. As can be seen, an increase in Tg was observed for the AMP gels with increasing the pH of gel-forming solution, possibly since the increasing compact of three-dimensional network limited the molecular mobility (), especially the molecular interaction can prevent the local molecular motion.[Citation29] The Tg of AMP gel formed at pH 5.0 was greater than that of pH 5.5 probably because of a stronger cross-linking by molecular forces. Based on the results of , it could be speculated that a greater gel-forming ability of AMP was observed with increasing the pH of gel-forming solution.
Fourier transform infrared spectroscopy
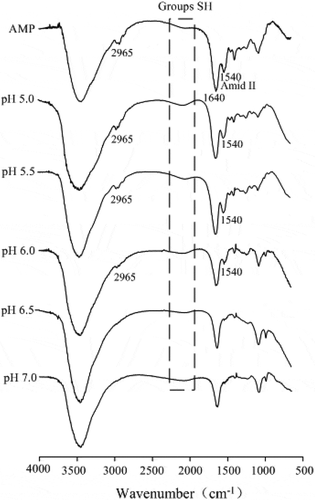
FTIR of AMP and AMP gels were analysed in . A wide band at 2965 cm−1 was attributed to the vibration of CH bond. However, the intensity of the 2965 cm−1 band in AMP gels decreased with increasing pH. It was reported that the intensity of the 2930 cm−1 band decreased with decreasing the polarity of the environment around hydrocarbon chains.[Citation32] The unfolding of protein with increasing pH may lead to the exposure of the methyl or methylene during gelation process, and the methylene groups may be bound to certain atoms that are more electronegative than carbon, resulting in the changes of environment of CH bond and then leading to a decrease in intensity of the 2965 cm−1 band.
The band at 2112–2135 cm−1 corresponding to SH[Citation33] had a more weaker band with increasing pH, possibly due to a decrease in SH groups during protein gelation process, indicating the formation of disulphide bonds and then further improving the gel strength ().
Amide I (1600–1700 cm−1) and amide II (1500–1600 cm−1) are generally employed to monitor the changes of protein secondary structure in various environments. As shown in , a peak (1540 cm−1) was observed between 1500 and 1600 cm−1 at AMP spectrum, primarily ascribed to N–H bending with a contribution from C–N stretching vibrations.[Citation34] However, in the AMP gels spectrum, the intensity of amide II (1540 cm−1) was diminished until disappeared completely with increasing the pH of gel-forming solution. In favourable situations, the amide II region is observed for random coil structure and allows a more accurate estimate of the helix and random components.[Citation35] The pH decrease may promote protein denaturation and aggregation with disordered interaction between proteins. Therefore, one may infer that the decrease in intensity of amide II was attributed to the diminishing of random coil structure, indicating that the unfolding of protein with increasing pH possibly led to the exposure of the hydrophobic amino acids and then enhanced the hydrophobic interactions between proteins, which corresponds to the greater gel strength () and Tg () during protein gelation process.
Conclusion
AMP solubility measurements revealed large differences between pH values. AMP was sensitive to pH and PM was observed as the major fraction of AMP by SDS-PAGE. The positive effect of high pH on thermal gelation was obtained for AMP, and the high quality of AMP gel with the highest gel strength, WHC, and dense microstructure was obtained at pH 7.0. Upon heating, the effects of pH on AMP gel-forming solutions were responded to Tg of AMP gels, which may help to promote understanding of the mechanism of the glass transition of food proteins and to control it for practical use. Based on the results of FTIR, some of the features changed with increasing pH were beneficial for formation of a fine AMP gel network. Therefore, it may be concluded that AMP exhibited a remarkable ability to form three-dimensional network structure, and the gelation characteristics of AMP at various pH values are indicative of abalone muscle food quality.
Additional information
Funding
References
- Anonymous. China Fisheries Yearbook; China Agricultural Press: Beijing, 2016; pp 32–34.
- Gao, X.; Tashiro, Y.; Ogawa, H. Rheological Properties and Structural Changes in Raw and Cooked Abalone Meat. Fisheries Science 2001, 67(2), 314–320. DOI: 10.1046/j.1444-2906.2001.00232.x.
- Gao, X.; Tashiro, Y.; Ogawa, H. Rheological Properties and Structural Changes in Steamed and Boiled Abalone Meat. Fisheries Science 2002, 68(3), 499–508. DOI: 10.1046/j.1444-2906.2002.00454.x.
- Gao, X.; Tashiro, Y.; Ogawa, H. The Correlation between Rheological Properties and Characteristic Values of Structure for Steamed Abalone Meat. Food Science and Technology Research 2002, 8(4), 304–310. DOI: 10.3136/fstr.8.304.
- Zhu, B. W.; Dong, X. P.; Sun, L. M.; Xiao, G. H.; Chen, X. J.; Murata, Y.; Yu, C. X. Effect of Thermal Treatment on the Texture and Microstructure of Abalone Muscle (Haliotis Discus). Food Science and Biotechnology 2011, 20(6), 1467–1473. DOI: 10.1007/s10068-011-0203-6.
- Sun, X. D.; Holley, R. A. Factors Influencing Gel Formation by Myofibrillar Proteins in Muscle Foods. Comprehensive Reviews in Food Science and Food Safety 2011, 10(1), 33–51. DOI: 10.1111/crfs.2011.10.issue-1.
- Offer, G.; Trinick, J. On the Mechanism of Water Holding in Meat: The Swelling and Shrinking of Myofibrils. Meat Science 1983, 8(4), 245–281. DOI: 10.1016/0309-1740(83)90013-X.
- Lin, W. L.; Zeng, Q. X.; Zhu, Z. W.; Song, G. S. Relation between Protein Characteristics and TPA Texture Characteristics of Crisp Grass Carp (Ctenopharyngodon idellus C. Et V) and Grass Carp (Ctenopharyngodon idellus). Journal of Texture Studies 2012, 43(1), 1–11. DOI: 10.1111/j.1745-4603.2011.00311.x.
- Shin, H. G.; Choi, Y. M.; Kim, H. K.; Ryu, Y. C., .; Lee, S. H.; Kim, B. C. Tenderization and Fragmentation of Myofibrillar Proteins in Bovine Longissimus Dorsi Muscle Using Proteolytic Extract from Sarcodon aspratus. LWT-Food Science and Technology 2008, 41(8), 1389–1395. DOI: 10.1016/j.lwt.2007.08.019.
- Lanier, T. C.; Carvajal, P.; Yongsawatdigul, J. Surimi Gelation Chemistry. In Surimi and Surimi Seafood, 2nd ed.; Park, J. W., Ed.; CRC Press: Florida, 2005; pp 436–489.
- Dong, X. P.; Ma, L. L.; Zheng, J.; Wang, J. T.; Wu, Q.; Song, S.; Zhou, D. Y. Effect of pH on the Physicochemical and Heat-Induced Gel Properties of Scallop Patinopecten Yessoensis Actomyosin. Fisheries science 2014, 80(5), 1073–1082. DOI: 10.1007/s12562-014-0778-y.
- Liu, R.; Zhao, M. S.; Liu, M. Y.; Yang, H.; Xiong, B. S.; Xie, J. B.; Qin, H. L. Effect of pH on the Gel Properties and Secondary Structure of Fish Myosin. Food Chemistry 2010, 121(1), 196–202. DOI: 10.1016/j.foodchem.2009.12.030.
- Kristinsson, H. G.; Liang, Y. Effect of pH-Shift Processing and Surimi Processing on Atlantic Croaker (Micropogonias undulates) Muscle Proteins. Journal of Food Science 2006, 71(5), C304–C312. DOI: 10.1111/jfds.2006.71.issue-5.
- Dong, X. P.; Li, Y.; Song, L.; Wang, Y.; Tan, M. Q.; Zhu, B. W. Changes of Water Distribution and Physicochemical Properties of Abalone (Haliotis Discus) Myofibrillar Proteins during Heat-Induced Gelation. Journal of Food Processing and Preservation 2016, 41(4).
- Paredi, M. E.; Mattio, N. D. E. V.; Crupkin, M. Biochemical Properties of Actomyosin of Cold Stored Striated Adductor Muscles of Aulacomya Ater Ater (Molina). Journal of Food Science 1990, 55(6), 1567–1570. DOI: 10.1111/j.1365-2621.1990.tb03570.x.
- Lowry, O. H.; Rosebrough, N. J.; Farr, A. L.; Randall, R. J. Protein Measurement with the Folin Henol Reagent. Journal of Biological Chemistry 1951, 193(1), 265–275.
- Tang, C. H.;. Functional Properties and in Vitro Digestibility of Buckwheat Protein Products: Influence of Processing. Journal of Food Engineering 2007, 82(4), 568–576. DOI: 10.1016/j.jfoodeng.2007.01.029.
- Laemmli, U. K.;. Cleavage of Structural Proteins during Assembly of Head of Bacteriophage T4. Nature 1970, 227(5259), 680–685. DOI: 10.1038/227680a0.
- Kocher, P. N.; Foegeding, E. A. Microcentrifuge-Based Method for Measuring Water-Holding of Protein Gel. Journal of Food Science 1993, 58(5), 1040–1046. DOI: 10.1111/j.1365-2621.1993.tb06107.x.
- Weng, W. Y.; Zheng, W. X. Silver Carp (Hypophthalmichthys molitrix) Surimi Acid-Induced Gel Extract Characteristics: A Comparison with Heat-Induced Gel. International Journal of Food Properties 2015, 18(4), 821–832. DOI: 10.1080/10942912.2013.864675.
- Ni, N.; Wang, Z.; He, F.; Wang, L.; Pan, H.; Li, X.; Wang, Q. Gel Properties and Molecular Forces of Lamb Myofibrillar Protein during Heat Induction at Different pH Values. Process Biochemistry 2014, 49(4), 631–636. DOI: 10.1016/j.procbio.2014.01.017.
- Lefevre, F.; Fauconneau, B.; Ouali, A.; Culioli, J. Thermal Gelation of Brown Trout Myofibrils from White and Red Muscles: Effect of pH and Ionic Strength. Journal of the Science of Food and Agriculture 2002, 82(4), 452–463. DOI: 10.1002/(ISSN)1097-0010.
- Autio, K.; Kiesvaara, M.; Polvinen, K. Heat-Induced Gelation of Minced Rainbow Trout (Salmo gairdneri): Effect of pH, Sodium Chloride and Setting. Journal of Food Science 1989, 54(4), 805–808. DOI: 10.1111/jfds.1989.54.issue-4.
- Lan, Y. H.; Novakofski, J.; McCusker, R. H.; Brewer, M. S.; Carr, T. R.; McKeith, F. K. Thermal Gelation of Myofibrils from Pork, Beef, Fish, Chicken and Turkey. Journal of food science 1995, 60(5), 941–945. DOI: 10.1111/jfds.1995.60.issue-5.
- Ehara, T.; Nakagawa, K.; Tamiya, T.; Noguchi, S. F.; Tsuchiya, T. Effect of Paramyosin on Invertebrate Natural Actomyosin Gel Formation. Fisheris Science 2004, 70(2), 306–313. DOI: 10.1111/j.1444-2906.2003.00805.x.
- Liu, R.; Zhao, M. S.; Xiong, B. S.; Xie, J. B.; Qin, H. L. Role of Secondary Structures in the Gelation of Porcine Myosin at Different pH Values. Meat Science 2008, 80(3), 632–639. DOI: 10.1016/j.meatsci.2008.02.014.
- Chung, Y. C.; Richardson, L.; Morrissey, M. T. Effects of pH and NaCl on Gel Strength of Pacific Whiting Surimi. Journal of Aquatic Food Product Technology 1994, 2(3), 19–35. DOI: 10.1300/J030v02n03_03.
- Paredi, M. E.; Tomas, M. C.; Crupkin, M. Thermal Denaturation of Myofibrillar Proteins of Striated and Smooth Adductor Muscles of Scallop (Zygochlamys patagonica). A Differential Scanning Calorimetric Study. Journal of Agricultural and Food Chemistry 2002, 50(4), 830–834. DOI: 10.1021/jf010767q.
- Mizuno, A.; Mitsuiki, M.; Motoki, M.; Ebisawa, K.; Suzuki, E. I. Relationship between the Glass Transition of Soy Protein and Molecular Structure. Journal of Agricultural and Food Chemistry 2000, 48(8), 3292–3297. DOI: 10.1021/jf991151s.
- Sun, X. D.; Arntfield, S. D. Molecular Forces Involved in Heat-Induced Pea Protein Gelation: Effects of Various Reagents on the Rheological Properties of Salt-Extracted Pea Protein Gels. Food Hydrocolloid 2012, 28(2), 325–332. DOI: 10.1016/j.foodhyd.2011.12.014.
- Taylor, L. S.; Zografi, G. Sugar–Polymer Hydrogen Bond Interactions in Lyophilized Amorphous Mixtures. Journal of pharmaceutical sciences 1998, 87(12), 1615–1621. DOI: 10.1021/js9800174.
- Larsson, K.; Rand, R. P. Detection of Changes in the Environment of Hydrocarbon Chains by Raman Spectroscopy and Its Application to Lipid-Protein Systems. Biochimica et Biophysica Acta (BBA)-Lipids and Lipid Metabolism 1973, 326(2), 245–255. DOI: 10.1016/0005-2760(73)90250-6.
- Tolano-Villaverde, I. J.; Ezquerra-Brauer, J. M.; Ocano-Higuera, V. M.; Torres-Arreola, W.; Ramirez-Wong, B.; Herrera-Urbina, R.; Marquez-Rios, E. Effect of pH and Chitosan Concentration on Gelation of Protein Concentrate from Giant Squid Mantle (Dosidicus gigas). International Journal of Food Science and Technology 2016, 51(6), 1360–1368. DOI: 10.1111/ijfs.13095.
- Karthikeyan, S.; Mani, P. Effect of Heavy Metals on Tissue Protein of an Edible Fish Cirrhinus mrigala as Dependent on pH and Water Hardness. Biophysics 2014, 59(2), 321–325. DOI: 10.1134/S0006350914020110.
- Pelton, J. T.; McLean, L. R. Spectroscopic Methods for Analysis of Protein Secondary Structure. Analytical Biochemistry 2000, 277(2), 167–176. DOI: 10.1006/abio.1999.4320.

