
 ?Mathematical formulae have been encoded as MathML and are displayed in this HTML version using MathJax in order to improve their display. Uncheck the box to turn MathJax off. This feature requires Javascript. Click on a formula to zoom.
ABSTRACT
Water-holding capacity is closely related to gel microstructure, and is a very important quality trait in surimi and surimi product. The changes in the secondary structure, gel microstructure, and the migration of water in bighead carp (Aristichthys nobilis) myosin gel induced by different temperatures (50–90°C) were investigated. The α-helical structure of myosin decreased at temperatures of 40°C or higher. The fractal dimension of the gels increased at 40, 50, and 60°C, but decreased at temperatures over 60°C. The pore size of the gels increased with temperatures up to 50°C, decreased at 60°C, and then increased with temperatures up to 90°C again. The transverse relaxation times also varied; T21 remained constant at temperatures over 40°C; T22 decreased at temperatures lower than 50°C, increased at 60°C, and then decreased with temperatures up to 90°C; and T23 increased at temperatures lower than 50°C and then remained constant until 90°C. Principal component analysis showed that the proportion of T22 water (PT22) was inversely correlated with the unfolding of myosin, whereas directly correlated with the pore size. The proportion of T23 water (PT23) was positively correlated with the fractal dimensions of the gels, whereas negatively correlated with the pore size. The migration of the secondary layer of water was mainly caused by hydrophobic force and the physical space formed by the myosin backbone, and the migration of water within the third layer was mainly caused by capillary pressure. Therefore, the mobility and redistribution of waters depend on the water retention mechanism, which is determined by the physical structure of gels. This study provides further information about the relationship between the NMR data, gel microstructure, water mobility, and distribution.
Introduction
Water-holding capacity (WHC) of surimi and surimi products is related to the microstructure of the gels, which are considered as a series of interconnected capillary tubes.[Citation1] Therefore, WHC was suggested to be mediated primarily by capillary pressure.[Citation2,Citation3] However, the physical structures within gels are mainly influenced by temperature and the heating duration.[Citation4–Citation8] During heating, proteins unfold, aggregate, and eventually form a three-dimensional network.[Citation9,Citation10] The peptide backbone becomes extensively hydrated and the mobility of the water reduces when protein unfolding.[Citation10] Furthermore, the water molecules near the hydrophobic groups that were exposed when the protein unfolded arrange themselves into hydrogen-bonded clathrates, which are “ice-like” structures. As a result, the mobility of water molecules decreases, and the system becomes less random.[Citation11] A good equilibrium between the unfolding and aggregation of myosin is important for the formation of a gel with a good microstructure. Protein aggregation prior to unfolding leads to a coarse microstructure with larger pores and thus a lower capillary pressure, which, in turn, results in a lower WHC, and vice versa.[Citation12] Therefore, WHC is closely correlated with the unfolding and aggregation of the protein. However, how waters are incorporated into the protein matrix is still not completely understood, although most researchers believe in the prevailing hypothesis of capillary pressure following the Young–Laplace equation.[1–Citation3]
Low-field nuclear magnetic resonance (LF-NMR) spectroscopy has been used to study the relationship between the mobility of water and the food microstructure.[Citation13–Citation15] The NMR spin-spin relaxation (T2) is an important index representing the status of the water molecules.[Citation16] However, the three-dimensional network of the gel system was so complex that the relationship between the NMR data and the gels microstructure is not clear.
In this article, we investigated the moisture distribution and migration within bighead carp myosin heat-induced gel at various temperatures, as different temperatures caused changes in the unfolding and aggregation of the proteins. Therefore, we can get gels with different physical structure for to further understand the relationships between water migration, myosin secondary structures, and the three-dimensional network of the gels. Moreover, the present study suggested the differences in water mobility mainly attributed to the different water holding mechanism (s) and physical structure among gels.
Materials and methods
Materials and chemicals
Fresh bighead carp weighting 1000 ± 50 g (a total of three fishes) were purchased from the Auchan supermarket (Zhenjiang, China) and placed in a plastic bag filled with oxygen. The fishes were transported to the laboratory on ice in a polystyrene box within 30 min. Adenosine triphosphate disodium was obtained from Aladdin (Aladdin Co., Shanghai, China). All other chemicals were purchased from Sinopharm Chemical Reagent Co., Ltd. (Shanghai, China). All reagents and chemicals are analytical grade.
Preparation of myosin protein
Myosin from the dorsal muscle of the bighead carp was prepared as described by Liu et al.[Citation17] with some modifications. The fresh bighead carp was stunned by knife-blade, gutted, immediately beheaded, and then cut in half through the dorsal flesh. The dorsal muscle was separated from the skin and bone by hand before chopping. The muscle was then promptly mixed with 100 mM KCl, 20 mM Tris-HCl (pH 7.5) buffer in a 10:1 v/v ratio (solvent:muscle). The fish muscle was kept on ice at temperatures below 8°C during the extraction process. The minced muscle was homogenized using a Waring blender (T18, IKA Co., Staufen, Germany) at 1,2000 × g for three intervals of 20 s each. The mixture was allowed to rest for 15 min at 4°C and then centrifuged at 3000 × g for 5 min (4°C) (Avanti J-26XP, Beckman Coulter, Germany). The precipitate was diluted by five times with a buffer containing 450 mM KCl, 5 mM beta-mercaptoethanol, 200 mM Mg(CH3COOH)2, 1 mM [ethylenebis (oxyethylenenitrilo)] tetraacetic acid (EGTA), and 20 mM Tris-maleic acid (pH 6.8). Adenosine triphosphate disodium was added to the solution at a final concentration of 10 mM. The buffer was allowed to rest for 90 min at 4°C and then centrifuged at 1,2000 × g for 10 min at 4°C. The supernatant was slowly diluted by seven times with 1 mM KHCO3 solution and kept at 4°C for 25 min prior to centrifugation at 1,2000 × g for 10 min. The precipitate was resuspended in a 500 mM KCl, 5 mM beta-mercaptoethanol, 20 mM Tris-HCl (pH 7.5) buffer at a 1: 2.5 v/v ratio of precipitate: buffer and left to rest for 10 min at 4°C. The solution was then diluted by five times in 1 mM KHCO3. MgCl2 was added to the solution to a final concentration of 10 mM. After homogenization, the suspension was stored overnight at 4°C and then centrifuged at 17,000 g for 25 min (4°C). The collected myosin was kept on ice for further analysis.
Myosin determination
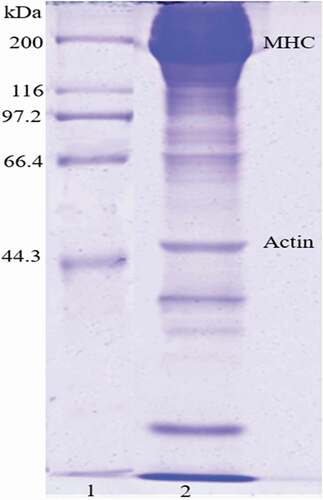
The collected myosin was dissolved in 500 mM NaCl, 20 mM Tris-HCl (pH 7.0), and then was centrifuged at 9000×g for 10 min at 4°C. The supernatant solution was used to prepare gels. The concentration of myosin in the supernatant solution was over 25 mg·mL−1, which was determined by the Bradford method.[Citation18] The purity of the myosin was determined by sodium dodecyl sulfate-polyacrylamide gel electrophoresis (SDS-PAGE).[Citation19] Myosin purity was also determined by densitometry (Gel-Pro Analyzer, Version 4.00, Media Cybernetics, Bethesda, MD, USA). The electrophoretic profile of the extracted myosin is shown in . The purity of myosin used in this work was greater than 90%, although a little actin existed.
Figure 1. SDS-PAGE of myosin extracted from fish muscle. Lane 1 designates molecular weight markers, loaded with 5 µg, and lane 2 for protein collected with 20 µg. MHC: myosin heavy chain.
Raman spectroscopy analysis
The myosin solution was heated at 40, 50, 60, 70, and 90°C for 30 min, respectively. Following heating, the samples were cooled in water and frozen in a deep freezer at −80°C for more than 4 h. The samples were then freezing dried for 30 h with vacuum freeze-drying equipment (Boyikang Co., Ltd., Beijing, China). The experiments of Raman spectra were performed using laser Raman microspectroscope (DXR, Thermo Co., Waltham, MA, USA) at an excitation wavelength of 532 nm. The spectral resolution was 2 cm−1. The samples were placed on a slide focused at approximately 10 mw. The spectra were recorded within the 400–3500 cm−1 range. The final spectral data of each sample were obtained by averaging 40 scans. All spectra were collected with multipoint baseline correction and smoothing using Omnic 8.2.0 software (Thermo Fisher Scientific Inc., Waltham, MA, USA). The peak intensity and the range area from 1600 to 1700 cm−1 were obtained by deconvolution, second derivative analysis, and fitting in Peak Fit 4.12 software (Sea Solve Software Inc., San Jose, CA, USA). The amide І band (approximately 1650 cm−1) was used to estimate the secondary structure of the protein.[Citation20]
Scanning electron microscopy (SEM)
The samples were prepared according to the procedure described by Hayakawa et al.[Citation21] with some modifications. The collected myosin was put in a series of small beakers (2 cm diameter) and heated at 40, 50, 60, 70, and 90°C for 30 min. Heat-induced myosin gel samples (5 × 5 × 1 mm cubes) were fixed in 3% glutaraldehyde containing 0.1 M phosphate buffer (pH 7.0) for 4 h. The gel pieces were rinsed three times with 0.1 M phosphate buffer (pH 7.0) and fixed again in 1% osmium tetroxide for 24 h at 4°C. The samples were dehydrated in a series of graded concentrations of ethanol, soaked in isoamyl acetate for 15 min, and then dried with a critical point dryer (CPD-030, Baltec Co., Pfäffikon, Switzerland). The dried specimens were coated with 10 nm of gold and later observed with a scanning electron microscope (Quanta-200, FEI Co., Hillsboro, OR, USA) with an accelerating voltage of 10 kV. Fifteen SEM images were obtained from each sample for a pore-scale analysis.
Analysis of the pore diameters from SEM images
SEM images were analyzed using the publicly available software ImageJ 1.43 µ (NIH, Bethesda, MD, USA). The black areas represent the network holes, whereas the white areas represent the protein aggregates based on the thresholded binary images. To minimize human bias, a 10 × 10 μm grid was overlaid on top of each micrograph, and only the pores situated at grid intersections were selected and measured.[Citation1] The average equivalent pore diameter was calculated according to the following equation[Citation22]:
where d is the average equivalent pore diameter, A is the average area, n is the number of pore, S is the total area of the image, and k is the pore fraction.
Fractal dimension (Df) evaluation
The fractal dimension of the thresholded binary images was calculated by the box-counting method using MATLAB software (version 7.11, The Math Works Inc., Natick, MA, USA) and by Eqs. (3) and (4).[Citation23]
where Nr is the box’s number within a gel network at the given scale, and r is the corresponding scale. The evaluation of Df is based on the two-dimensional space. Therefore, it is necessary to add an extra dimension to the D value to characterize the three-dimensional structure of a protein gel.[Citation24]
LF-NMR measurement
Following the method described by Han et al.[Citation25] with some modifications. myosin gel (1 g) was placed inside the transparent tube (12 mm in diameter), and then was measured on the Niumag Benchtop Pulsed NMR analyzer (Niumag PQ001, Niumag Electric Cooperation, Shanghai, China) operating at a proton resonance frequency of 22.6 MHz. The transverse relaxation time (T2) was measured using the Carr–Purcell–Meiboom–Gill (CPMG) with 12,000 echo, 8 scans, 6 s between scans, and a half-echo time of 400 µs between pulses of 90 and 180.[Citation26,Citation27] The low-field NMR relaxation curve was fitted to a multiexponential curve according to the following equations with Multi-Exp Inv Analysis software (Niumag Electric Cooperation, Shanghai, China).
where A(t) is the amplitude at time t, t is the time of decay, A0i is the amplitude of the component i, and T2i is the transversal relaxation time of the component i.
Statistical analysis
All experiments were run in triplicate and the data are presented as the mean with the standard deviation. Data were subjected to analysis of variance (ANOVA) and the differences between treatments were determined by Duncan’s multiple range test. The significance of difference was established at p < 0.05. All statistical analyses were performed using SPSS 18.0 (SPSS Inc, Chicago, IL, USA).
Results and discussion
Changes in secondary structure as observed by Raman spectroscopy
The Raman spectra of the bighead carp myosin heated at various temperatures (40–90°C) are shown in ). The data from amide I, a fraction of various myosin secondary structures, are shown in . As shown in ), the percentage of α-helix tended to decrease as the temperature increased. When incubated at 40°C for 30 min, the α-helix content of the bighead carp myosin decreased from 39.4% to 37.3%, indicating that the myosin is unfolding. When heated at 90°C for 30 min, the α-helix content of the myosin significantly decreased by 38.6% (p < 0.01). The results showed that the degree of myosin unfolding increased with the increasing temperature. The percentages of random coils and β-turns also markedly increased (p < 0.05). Liu et al.[Citation28] reported that α-helix of silver carp myosin gradually decreased with increasing temperature. Hydrogen bonds and hydrophobic interactions are the critical factors in maintaining the native helical conformation of the myosin. Moreover, the balance must be maintained between intermolecular hydrogen bonding and side chain charge, which arises from the kinetic motion of molecules, as determined by temperature. With temperature increasing, the large degree of random motion tends to diminish the hydrogen bonds formation. As a result, the helix will collapse.[Citation29] During the protein unfolding, the percentage of disordered secondary structures increased along with a concomitant exposure of hydrophobic amino acids, which then caused neighboring protein molecules to interact, resulting in aggregation of the protein molecules. The bound water and the secondary layer of water around the protein molecules arranged themselves into hydrogen-bonded clathrates, which are “ice-like” structures.[Citation11] However, the unfolding and aggregation processes varied under different heating conditions. Consequently, hydrophobic interactions and hydrogen bonds between myosin and water molecules also varied, which causes different mobilities and redistributes the waters within gels.
Table 1. The changes of secondary structure percentage in amide І band at different heating temperatures.
Figure 2. Raman spectra (a) and changes of α-helix content of myosin (b) were profiled at different heating temperature.
a, b, c, d, and e represented the profiles at 40, 50, 60, 70, and 90°C, respectively.
Microstructure of the bighead carp myosin gel
The gel’s macroscopic and microscopic structural attributes change with the alteration of heat treatment conditions,[Citation30] by changing the rates and mechanisms of denaturation and aggregation.[Citation25] ) shows SEM micrographs of the bighead carp myosin gels at temperatures 40, 50, 60, 70, and 90°C (a1–e1) and their corresponding 8-bit binary images (a2–e2). Significant differences in the physical structure of gels depending on temperature were obtained. Initially, the size of the aggregates seemed to be small and then increase with increasing temperature. At 40°C, the gel was mainly composed of particle aggregates ()—a1, a2). At 50°C, the organized network structure appeared in the sample ()—b1, b2), but the surface of the gel was rough. Additionally, the interconnection between protein molecules increased, which is visible in the threshold images ()). The average pore diameter decreased from 0.105 µm to 0.080 µm as the temperature increased to 60°C and then increased markedly to approximately 0.128 µm when the temperature up to 90°C. Compared with the data at 60°C, bigger pore size and more free water were present at 40°C. Additionally, the gel that formed at 90°C exhibited the same value ()). The smallest average pore diameter was seen in the gel that was heat induced at 60°C, which might be caused by the modori from the endogenous protease in the fish muscle.[Citation31,Citation32] At 60°C, part of the aggregates and covalent cross-linking within the gel might be destroyed by the endogenous protease, resulting in a smaller pore size. As discussed earlier, myosin unfolded with increasing temperatures, and more reactive groups, which was necessary for aggregation, exposed. Therefore, the reactive groups of myosin molecules reacted more adequately and led to the formation of the continuous gel matrix and eventually a smaller pore size.[Citation33,Citation34]
Figure 3. Typical SEM micrographs at 5000× magnification (a) and changes of fractal dimension and pore diameters (b) of myosin gel.
The SEM images, a1~e1, and the binary thresholded images (at a grey level of 100), a2~e2 at 40, 50, 60, 70, and 90°C, respectively. Scale bar in SEM images represents 1 µm.
Fractal analysis is an effective method for quantifying the changes in the microstructure of the gel.[Citation35] The fractal dimension (Df) gives the degree of complexity of the protein aggregates. From the slopes of the plots, the values of D of the heat-induced gels were 1.841 (40°C), 1.863 (50°C), 1.890 (60°C), 1.875 (70°C), and 1.871 (90°C), and the corresponding values of Df were 2.841, 2.863, 2.890, 2.875, and 2.871, respectively. The Df values increased from 2.841 to 2.890 as the temperature increased from 40°C to 60°C, which indicated that the gels were weak-link because of a low concentration (25 mg·mL−1). The results suggested a high degree of complexity and the formation of a more ordered microstructure for all samples.[Citation25] An increased degree of complexity for all the samples compared to the Df of 40°C was obtained as was reported by others.[Citation25,Citation36] As shown in , the unfolding of the α-helical structures increased as the temperature increased. Moreover, the formation of internal order failed to keep pace with the myosin unfolding, which led to a large amount of protein self-aggregation and a higher Df value at 60°C. In addition, the modori of fish protein gel should be considered. The lower Df values at 70°C (2.875) and 90°C (2.871) could be attributed to the rapid aggregation that disrupted the protein’s intermolecular interactions. The surface hydrophobicity increased as the protein unfolded at higher temperatures. Higher hydrophobicity means increased interactions among protein molecules, which culminated in larger aggregates. Therefore, the gel that formed at a high temperature was composed of numerous larger aggregates, resulting in a larger pore size. Capillarity pressure is negatively correlated with pore sizes within three-dimensional networks of gels.[Citation1,Citation2,Citation12] Consequently, the WHC of the heat-induced gels decreased with increasing temperature because the mean pore size within the gels increased. Similarly, Park et al.[Citation37] reported that the pore diameter within fish surimi gel increased during the heating of gels up to 90°C. Stevenson et al.[Citation3] also indicated that pores with smaller or similar diameters formed in Alaska Pollock gels at higher heating temperatures. These results indicated that the distribution of water within gels is significantly dependent on the structure of the three-dimensional network.[Citation11,Citation38]
LF-NMR relaxation
) shows the relaxation time distribution of the samples, which were prepared by heating at 40, 50, 60, 70, and 90°C for 30 min. As shown in this figure, every curve had three peaks, which represented the T21 relaxation time (1–10 ms), the T22 relaxation time (200–400 ms), and the T23 relaxation time (1000–2500 ms). The T21 relaxation time was the shortest, indicating that the hydrogen atoms that belonged to the waters of hydration were closely bound to the proteins within the gels. The T22 relaxation time indicated that the hydrogen atoms had low mobility and low homogeneity, proving that they were part of a second layer of water (semibound water) around the protein molecules. The T23 relaxation time was the longest, indicating that the hydrogen atoms belonged to a third layer of water (with higher mobility), which was easily lost during the heating process.[Citation39,Citation40] High T2 values suggested long relaxation times, which indicated that the binding forces between bound hydrogen atoms and macromolecules were weak. In contrast, low T2 value suggested that the hydrogen atoms were bound to the macromolecules by stronger forces.[Citation41] In addition, T2 reflected the mobility of the waters contained in gel pores, which supported the hypothesis of capillarity.[Citation3] High T2 values indicated the waters had high mobility in big pores, while low T2 value suggested that the mobility of waters in small pores was very limited.
Figure 4. LF-NMR T2 relaxation curves (a), T2 relaxation time (b) and the corresponding water populations (c) of bighead carp myosin gels as a function of heating temperature for 30 min (mean ± SD, n = 3).
PT21, PT22, and PT23 are proportions for T21, T22, and T23, respectively.
,) show the T2 values and the corresponding waters populations in the bighead carp myosin gel (25 mg·mL−1) heated at various temperatures (40, 50, 60, 70, and 90°C) for 30 min. The T21 relaxation times of the myosin gels heated-induced at 40, 50, 60, 70, and90°C was approximately 4 ms. Meanwhile, the T22 relaxation time substantially decreased from 231.01 to 100.00 ms as the temperature increased (p < 0.05); however, it abruptly returned to 200.00 ms at 60°C. The T23 relaxation time significantly increased from 932.60 to 2154.43 ms as the temperature increased to 50°C. The T23 relaxation time remained constant as the temperature further increased. The proportion of T21 water (PT21) was approximately 0.82% and remained stable (F value = 0.218, p > 0.05) during heating at various temperatures. The proportion of T22 water (PT22) declined significantly, from 86.63% to 70.05%, as the temperature increased from 40°C to 60°C (p < 0.05) ()). However, PT22 increased at temperatures of 70°C or 90°C. Compared with the proportion of T22 water (PT22), the proportion of T23 water (PT23) noticeably increased from 13.84% to 28.85% as the temperature increased from 40°C to 60°C. However, the PT23 decreased when the samples were heated at 70°C or greater. Changes of individual water molecules for T21 cannot fully explain the changes of the protein structure, which should be clear from the T2 data of all water molecules in gels.[Citation29] Stevenson et al.[Citation3] suggested that T21 remained constant across gel treatments, including slow ramp heating and rapid heating. However, the data were not consistent with a non-significant change in the T2b (corresponding to T21 in this work) portion within the pork myofibrillar protein thermal gel.[Citation11] Fish myosin is less stable than terrestrial animal myosin.[Citation42] The intermolecular bonds in the bighead carp myosin were significantly weaker than those in pork myosin at temperatures below 60°C.[Citation43] Furthermore, the modori phenomenon occurred during the formation of fish surimi gel at approximately 60°C. Therefore, the three-dimensional network of fish protein was destroyed at 60°C, resulting in a decrease in the pore size of the gel and the PT22. Consequently, the T22 increased in the gels. However, the gels formed at 70°C or higher had more regular networks because the extent of myosin aggregation increased. As a result, the pore size of the gels increased ()), leading to an increase in PT22 and a decrease in PT23. The highly organized protein secondary structures (high α-helix content) became irregular (increased random coils and β-turns) due to the unfolding of myosin at high temperature (), and the surface area and volume of myosin increased. Although the hydrophilic amino acids originally present on the surface of myosin were still attracted to the water molecules, the hydrophobic amino acids exposed by protein unfolding repelled both the bound water and the secondary layer of water. Therefore, the second layer of water, which was retained within the tertiary and/or quaternary structures of the protein, might have been extruded during protein unfolding.[Citation40] Meanwhile, the three-dimensional networks of the gels formed at higher temperatures (>70°C) were more regular than those of the gels formed at low temperatures (<60°C), which caused the hydrophobic pores of the protein to become buried and form smaller pores. Consequently, the secondary layer of water was further pushed out. The content of the secondary layer of water was correlated with the pore sizes within gels, and the pore size increased as temperature increased (). As shown in ) and ), the smaller the pore sizes, the less water was in the secondary layer. This result suggested that the secondary layer of water was not bound by capillary forces but was trapped by the myosin chain three-dimensional network. Although the three-dimensional network formed by the myosin backbone trapped the waters, if the volume of the pores was too small, the water would be lost to the third layer of water. Therefore, the secondary layer of water was trapped by the three-dimensional network but not by capillary pressure. Wu et al.[Citation40] suggested that a decreasing T2 value generally indicated water loss, whereas an increasing T2 values indicated water gain. Stevenson et al.[Citation3] asserted that larger values of T21 (corresponding to T22 in this work) were weakly associated with higher water-holding capacity. Therefore, the T22 data was indicative of the mobility and redistribution of the waters within heat-induced myosin gels. Moreover, the data were more accurately reflected the changes in protein secondary structures and the interaction between the water and protein in small pores.
The T23 relaxation time did not correlate with the third layer of water in this work, which had higher mobility in big pores ()), when the gels formed at higher temperatures (>50°C). The changes in the water content in the third layer were consistent with the fractal dimension of the gels; however, they were negatively correlated with the changes in pore size within the gels. Gels most likely hold water via capillary pressure.[Citation1] Therefore, the results in this work indicate that water molecules in the third layer were immediately trapped within the regular three-dimensional network of the gel by capillary pressure. Furthermore, a small amount of water in the second layer could be squeezed out of the T22 water pools into the T23 water pools during the initial stages of myosin denaturation at approximately 42°C.[Citation44] However, the change in T23 in this study did not represent a change in the properties of the water, which could have been caused by the relatively narrow range of pore sizes in the gels ()). The results of the third layer of water showed that the water-holding capacity were correlated with the pore size within the gels, which was negatively correlated to capillary pressure. The mobility and redistribution of water within the third layer were mainly affected by the pore sizes within the heat-induced myosin gels. This seems to prove the capillary theory that the WHC of the gels should decrease as the gel pore size increases.[Citation3] In practice, the WHC of surimi gels is usually expressed in terms of expressible waters and is calculated by subtracting the mass of the water expressed during centrifugation from the specimen weight. Therefore, in this work, the PT23 could be considered a measure of the WHC within myosin gels. However, Bertram et al.[Citation13] suggested that WHC, which highly correlated with T22, was mainly affected by the loosely bound extra-myofibrillar water.
Principal component analysis of LF-NMR and fractal dimension data
Principal component analysis (PCA) was performed to describe the relationships among the measured parameters (). These results show the first two principal components (PC) solutions of the PCA for WHC, NMR data and gel physical structure properties of bighead carp myosin during heat-induced gelation. The first two principal components explained 88.54% of the total variation, indicating a strong relationship between T2 relaxation data and the gel microstructure properties. The first principal component (PC1), which described 70.38% of the variation, showed that T21, T23, PT21, PT23, and Df were positively correlated with each other, whereas T22, PT22 and the pore diameter were negatively related to T21, T23, PT21, PT23, and Df in PC1. The second component, which explained 18.16% of the variations, was positively correlated with T22, T23, PT21, PT23, and pore diameter and negatively correlated with T21, PT22, and Df. A pronounced effect mediated by Df and pore size on the water content and mean T2 relaxation times in the thermal-induced myosin gel was observed. These results suggested water-holding capacity is depended on micro- and macrostructural changes in the gel.
Figure 5. Principal component analysis (PCA) bi-plot for PC1 and PC2 showing the relationship between the analyzed parameters.
PT21, PT22, and PT23 are proportion of T21, T22, and T23, respectively. di: pore diameter.
Conclusion
The unfolding and aggregation of myosin differed when the myosin molecules were heated at different temperatures, which resulted in varied secondary structures in the myosin and three-dimensional networks within the gels. Therefore, the distribution and mobility of the water molecules within the myosin gel were different at various temperatures. The T22 relaxation time reflected not only the mobility of the second layer of water within the gels but also the change in the microstructure of the gels. In contrast, the T23 relaxation time did not correlate with the content of water within the third layer of the gels but could be considered as a measure of the WHC for the gels. The results further explained the correlations between relaxation time distribution spectra and waters in gels were influenced by the gels microstructure. The second layer of water was mainly forced out by hydrophobic force, but some of the waters were physically trapped in the space formed by the myosin backbone, and the third layer of water was basically kept by capillary pressure in the gels. Therefore, the correlation between of the NMR relaxation time and the WHC for gels depends on the water holding mechanism of the gel, which was determined by gels microstructure. Moreover, the present study provided further information to explain the water holding mechanism (s) associated with differences in water mobility and physical structure among gels.
Additional information
Funding
References
- Stevenson, C. D.; Dykstra, M. J.; Lanier, T. C. Capillary Pressure as Related to Water Holding in Polyacrylamide and Chicken Protein Gels. Journal of Food Science 2013, 78(2), C145–151. DOI:10.1111/1750-3841.12036.
- Liu, W.; Laniera, T. C.; Osborne, J. A. Capillarity Proposed as the Predominant Mechanism of Water and Fat Stabilization in Cooked Comminuted Meat Batters. Meat Science 2016, 111, 67–77. DOI:10.1016/j.meatsci.2015.08.018.
- Stevenson, C. D.; Liu, W.; Lanier, T. C. Rapid Heating of Alaska Pollock and Chicken Breast Myofibrillar Protein Gels as Affecting Water-Holding Properties. Journal of agricultural and food chemistry 2012, 60(40), 10111–10117. DOI:10.1021/jf3032292.
- Lanier, T. C.; Lin, T. S.; Liu, Y. M.; Hamann, D. D. Heat Gelation Properties of Actomyosin and Surimi Prepared from Atlantic Croaker. Journal of Food Science 1982, 47(6), 1921–1925. DOI:10.1111/j.1365-2621.1982.tb12914.x.
- Zhang, L.; Zhang, F.; Wang, X. Changes of Protein Secondary Structures of Pollock Surimi Gels under High-Temperature (100°C and 120°C) Treatment. Journal of Food Engineering 2016, 171, 159–163. DOI:10.1016/j.jfoodeng.2015.10.025.
- Ding, Y.; Liu, R.; Rong, J.; Xiong, S. Heat-Induced Denaturation and Aggregation of Actomyosin and Myosin from Yellowcheek Carp during Setting. Food chemistry 2014, 149(8), 237–243. DOI:10.1016/j.foodchem.2013.10.123.
- Shimada, M.; Takai, E.; Ejima, D.; Arakawa, T.; Shiraki, K. Heat-Induced Formation of Myosin Oligomer-Soluble Filament Complex in High-Salt Solution. International journal of biological macromolecules 2015, 73, 17–22. DOI:10.1016/j.ijbiomac.2014.11.005.
- Yongsawatdigul, J.; Park, J. W. Thermal Denaturation and Aggregation of Threadfin Bream Actomyosin. Food Chemistry 2003, 83(3), 409–416. DOI:10.1016/S0308-8146(03)00105-5.
- Jia, D.; You, J.; Hu, Y.; Liu, R.; Xiong, S. Effect of CaCl2 on Denaturation and Aggregation of Silver Carp Myosin during Setting. Food Chemistry 2015, 185, 212–218. DOI:10.1016/j.foodchem.2015.03.130.
- Lanier, T. C.; Carvajal, P.; Yongsawatdigul, J. Surimi Gelation Chemistry. In Surimi and Surimi Seafood, 2nd ed.; Park, J. W., Eds.; CRC Press: Boca Raton, 2004, pp 451–452.
- Lanier, T. C.; Yongsawatdigul, J.; Carvajal, P. Surimi Gelation Chemistry. In Surimi and Surimi Seafood, 3rd ed.; Park, J. W., Eds.; CRC Press: Boca Raton, 2014, pp 119.
- Sun, X. D.; Holley, R. A. Factors Influencing Gel Formation by Myofibrillar Proteins in Muscle Foods. Comprehensive Reviews in Food Science and Food Safety 2011, 10(1), 33–51. DOI:10.1111/j.1541-4337.2010.00137.x.
- Hanne, C. B.; Peter, P. P.; Henrik, J. A. Relationship between Meat Structure, Water Mobility, and Distribution: A Low-Field Nuclear Magnetic Resonance Study. Journal of Agricultural and Food Chemistry 2002, 50(4), 824–829. DOI:10.1021/jf010738f.
- Mariette, F.; Investigations of Food Colloids by NMR and MRI. Current Opinion in Colloid & Interface Science 2009, 14(3), 203–211. DOI:10.1016/j.cocis.2008.10.006.
- Mcdonnell, C. K.; Allen, P.; Duggan, E.; Arimi, J. M.; Casey, E.; Duane, G. The Effect of Salt and Fibre Direction on Water Dynamics, Distribution and Mobility in Pork Muscle: A Low Field NMR Study. Meat science 2013, 95(1), 51–58. DOI:10.1016/j.meatsci.2013.04.012.
- Han, M.; Zhang, Y.; Fei, Y.; Xu, X.; Zhou, G. Effect of Microbial Transglutaminase on NMR Relaxometry and Microstructure of Pork Myofibrillar Protein Gel. European Food Research and Technology 2009, 228(4), 665–670. DOI:10.1007/s00217-008-0976-x.
- Liu, R.; Zhao, S.; Liu, Y.; Yang, H.; Xiong, S.; Xie, B.; Qin, L. Effect of pH on the Gel Properties and Secondary Structure of Fish Myosin. Food Chemistry 2010, 121(1), 196–202. DOI:10.1016/j.foodchem.2009.12.030.
- Bradford, M. M.; A Rapid and Sensitive Method for the Quantitation of Microgram Quantities of Protein Utilizing the Principle of Protein-Dye Binding. Journal Analytical biochemistry 1976, 72(1–2), 248–254. DOI:10.1016/0003-2697(76)90527-3.
- Laemmli, U. K.; Cleavage of Structural Proteins during the Assembly of the Head of Bacteriophage T4. Nature 1970, 227, 680–685. DOI:10.1038/227680a0.
- Li-Chan, E. C. Y.; The Applications of Raman Spectroscopy in Food Science. Trends in Food Science & Technology 1996, 7(11), 361–370. DOI:10.1016/S0924-2244(96)10037-6.
- Hayakawa, T.; Yoshida, Y.; Yasui, M.; Ito, T.; Iwasaki, T.; Wakamatsu, J.; Hattori, A.; Nishimura, T. Heat-Induced Gelation of Myosin in a Low Ionic Strength Solution Containing L-Histidine. Meat science 2012, 90(1), 77–80. DOI:10.1016/j.meatsci.2011.06.002.
- Zhu, Y.; Liu, Y.; Zhang, Q.; Zhao, S.; Xiong, S. Effect of Heating Methods on Gel Properties of Silver Carp Fish Surimi. Shipinkexue/Food Science 2011, 32, 107–110.
- Chalida, N.; Sakamon, D.; Somchart, S. Changes in Protein Compositions and Their Effects on Physical Changes of Shrimp during Boiling in Salt Solution. Food Chemistry 2008, 108(1), 165–175. DOI:10.1016/j.foodchem.2007.10.058.
- Kaye, B. H.; Methods for Determining the Fractal Dimension: Analysis of Images. In The Fractal Approach to Heterogeneous Chemistry; Avnir, D., Eds.; John Wiley & Sons: Chichester, 1989. pp 55–66.
- Han, M.; Wang, P.; Xu, X.; Zhou, G. Low-Field NMR Study of Heat-Induced Gelation of Pork Myofibrillar Proteins and Its Relationship with Microstructural Characteristics. Food Research International 2014, 62, 1175–1182. DOI:10.1016/j.foodres.2014.05.062.
- Carr, H. Y.; Purcell, E. M. Effects of Diffusion on Free Precession in Nuclear Magnetic Resonance Experiments. The American Journal of Physiology 1954, 94, 630–638.
- Meiboom, S.; Gill, D. Modified Spin-Echo Method for Measuring Nuclear Relaxation Times. Review of scientific instruments 1958, 29(8), 688–691. DOI:10.1063/1.1716296.
- Liu, R.; Zhao, S. M.; Xiong, S. B.; Xie, B. J.; Liu, H. M. Studies on Fish and Pork Paste Gelation by Dynamic Rheology and Circular Dichroism. Journal of food science 2007, 72(7), E399–E403. DOI:10.1111/j.1750-3841.2007.00470.x.
- Carvajal, P. A.; Lanier, T. C.; Macdonald, G. A. Stabilization of Proteins in Surimi. In Surimi and Surimi Seafood, 2nd ed.; Park, J. W., Eds.; CRC Press: Boca Raton, 2004, pp 169–170.
- Schmidt, R. H.; Gelation and Coagulation. In Protein Functionality in Foods; Pour-El, A., Ed.; American Chemical Society: Washington, 1981; Vol. 147, pp 131–147.
- Jiang, S. T.; Lee, J. J.; Chen, H. C. Proteolysis of Actomyosin by Cathepsins B, L, L-Like and H from Mackerel (Scomber Australasicus). Journal of Agricultural and Food Chemistry 1996, 44, 769–773. DOI:10.1021/jf950250c.
- Cao, M.; Hara, K.; Osatomi, K.; Tachibana, K.; Izumi, T.; Ishihara, T. Myofibril-Bound Serine Proteinase (MBP) and Its Degradation of Myofibrillar Proteins. Journal of Food Science 1999, 64(4), 644–647. DOI:10.1111/j.1365-2621.1999.tb15102.x.
- Hemung, B. O.; Li-Chan, E. C. Y.; Yongsawatdigul, J. Thermal Stability of Fish Natural Actomyosin Affects Reactivity to Cross-Linking by Microbial and Fish Transglutaminases. Food chemistry 2008, 111(2), 439–446. DOI:10.1016/j.foodchem.2008.04.014.
- Wang, H.; Luo, Y.; Shen, H. Effect of Frozen Storage on Thermal Stability of Sarcoplasmic Protein and Myofibrillar Protein from Common Carp (Cyprinus Carpio) Muscle. International Journal of Food Science & Technology 2013, 48(9), 1962–1969. DOI:10.1111/ijfs.12177.
- Dàvila, E.; Parés, D. Structure of Heat-Induced Plasma Protein Gels Studied by Fractal and Lacunarity Analysis. Food Hydrocolloids 2007, 21(2), 147–153. DOI:10.1016/j.foodhyd.2006.02.004.
- Pugnaloni, L. A.; Matia-Merino, L.; Dickinson, E. Microstructure of Acid-Induced Caseinate Gels Containing Sucrose: Quantification from Confocal Microscopy and Image Analysis. Colloids and Surfaces B: Biointerfaces 2005, 42(3–4), 211–217. DOI:10.1016/j.colsurfb.2005.03.002.
- Park, Y. D.; Yoon, K. S.; Lee, C. M. Thermal Syneresis Affected by Heating Schedule and Moisture Level in Surimi Gels. Journal of food science 2008, 73(2), E103–E107. DOI:10.1111/j.1750-3841.2007.00644.x.
- Barbut, S.; Gordon, A.; Smith, A. Effect of Cooking Temperature on the Microstructure of Meat Batters Prepared with Salt and Phosphate. LWT-Food Science and Technology 1996, 29(5–6), 475–480. DOI:10.1006/fstl.1996.0073.
- Bertram, H. C.; Karlsson, A. H.; Rasmussen, M.; Pedersen, O. D.; Dønstrup, S.; Andersen, H. J. Origin of Multiexponential T2 Relaxation in Muscle Myowater. Journal of Agricultural and Food Chemistry 2001, 49(6), 3092–3100. DOI:10.1021/jf001402t.
- Wu, Z. Y.; Bertram, H. C.; Kohler, A.; Bocker, U.; Ofstad, R.; Andersen, H. J. Influence of Aging and Salting on Protein Secondary Structures and Water Distribution in Uncooked and Cooked Pork. A Combined FT-IR Microspectroscopy and 1H NMR Relaxometry Study. Journal of Agricultural and Food Chemistry 2006, 54(22), 8589–8597. DOI:10.1021/jf061576w.
- Belton, P. S.; Jackson, R. R.; Packer, K. J. Pulsed NMR Studies of Water in Striated Muscle: I. Transverse Nuclear Spin Relaxation Times and Freezing Effects. Biophysica Acta (BBA)-General Subjects 1972, 286(1), 16–25. DOI:10.1016/0304-4165(72)90084-0.
- Goetz, J.; Koehler, P. Study of the Thermal Denaturation of Selected Proteins of Whey and Egg by Low Resolution NMR. LWT-Food science and technology 2005, 38(5), 501–512. DOI:10.1016/j.lwt.2004.07.009.
- Liu, R.; Zhao, S. M.; Xie, B. J.; Xiong, S. B. Contribution of Protein Conformation and Intermolecular Bonds to Fish and Pork Gelation Properties. Food Hydrocol. 2011, 25(5), 898–906. DOI:10.1016/j.foodhyd.2010.08.016.
- Micklandery, E.; Boyan, P.; Peter, P. P.; Søren, B. E. NMR-Cooking: Monitoring the Changes in Meat during Cooking by Low-Field 1H-NMR. Trends in Food Science & Technology 2002, 13(9–10), 341–346. DOI:10.1016/S0924-2244(02)00163-2.