
 ?Mathematical formulae have been encoded as MathML and are displayed in this HTML version using MathJax in order to improve their display. Uncheck the box to turn MathJax off. This feature requires Javascript. Click on a formula to zoom.
ABSTRACT
The complex permittivity for four processing stages of coffee: coffee cherries, pulped coffee, green coffee, and roasted coffee was obtained and divided into two groups. The wet group is constituted by cherry and pulped coffee, and the dry group by green and roasted coffee. The wet group presented a dielectric constant between 64 and 43, and a loss factor between 34 and 12. The dry group has values oscillating between 1.55 and 1.1 for the dielectric constant, and 0.037 and 0.005 for the loss factor. The permittivity difference between the wet and dry groups suggests the dependence of the coffee permittivity on the water content, along with the presence of other polar compounds. A decaying response for the dielectric constant was seen, with a proportion of 30:1 from the wet to the dry group. The loss factor presents a convex response for the wet group and a constant response for the dry group with a factor of 500 to a 100:1 from the wet to the dry group. A set of 18 samples at every stage was used to estimate the moisture content by partial least squares. The Meyer and Schilz coefficient was used for these models, that resulted in prediction errors of 2.8% and 3.8% when compared to the stage mean moisture content for the wet group. The dry group resulted in errors of 21% and 89.7%. These results indicate that the complex permittivity of coffee is capable of estimating physicochemical variables as the moisture content of the beans at distinct processing stages.
Introduction
Coffee is one of the most globally known and traded commodities.[Citation1] Nevertheless, the coffee market has experienced a major transformation due to the demand increase for differentiated coffees, or “specialty coffees.” Although this specialty label is still worth of deliberation, it refers to coffees with particular organoleptic features from specific geographical regions.[Citation2] The specialty condition is defined by accredited institutions that have defined cupping protocols for the brew preparation and hedonic scales for the evaluation of the samples. One example of these institutions is the Specialty Coffee Association of America.[Citation3] An important portion of the coffee dedicated to this specialty segment is obtained by “wet processing.” The wet processing of coffee refers to the mechanical removal of the skin and pulp from the bean, the wet fermentation of the seeds, and drying of the mucilage-free seeds to obtain parchment coffee.[Citation4] This processing happens near the coffee plantations or at local processing plants. Different quality control stages are undertaken by the producer to guarantee the best product possible.[Citation2] The first stage is the selection of the ripe cherries,[Citation5] followed by the assessment of the fermentation conditions, and the evaluation of parchment coffee drying (i.e., moisture content and water activity levels).[Citation6] Still, this assessment of quality still relies on handcraft tools or methods that are time consuming and expensive. The technological development around the processing of coffee close to the smallholders has a positive impact on the production costs and the consistency of quality.
Most technology for coffee has been dedicated to green or roasted coffee, or is mostly developed for laboratory facilities.[Citation7] As the maturity of the cherry is critical to the beverage’s quality,[Citation5] the technological evaluation of the coffee cherries according to quality might represent an important breakthrough for the processing. Consequently, the evolution of the cherry ripening has been studied by various approaches such as: evaluation of the fruit volatility,[Citation8,Citation9] cherry color,[Citation10,Citation11] and measurement of other complementary variables as the titratable acidity, soluble solid content or Brix, and firmness of the cherry.[Citation6] Nevertheless, and despite of these studies, the Colombian coffee industry still relies on the harvesting of the cherries based on the fruit’s appearance.[Citation7]
The dielectric spectroscopy technique in the radio-frequency and microwave range has shown to have excellent capabilities for different agriculture applications. The method consists in the study of the complex permittivity of insulating non-metallic samples. The permittivity is represented by a complex number and is frequency dependent.[Citation12] The real part of the permittivity, known as the dielectric constant, accounts for the interaction of an incident electromagnetic field with the sample. The loss factor, which corresponds to the imaginary part, represents the losses that originate from temperature dissipation. Because low-power radiation is required for such studies, the technique has been considered for noninvasive analysis of different types of agriculture and other related products.[Citation13] In the case of coffee, research of the dielectric response has focused on the study of parchment coffee in the audio frequency range (5 kHz–5 MHz) for moisture content detection,[Citation14] and the description of the water features in green and roasted coffee.[Citation15] To the knowledge of the authors, the literature does not report the dielectric features of coffee cherries or pulped coffee. If the dielectric response of these coffee samples are related to the maturity of the cherry or other quality associated variables, it is possible to transfer the application to low cost portable solutions for in-field use.[Citation16]
This paper presents the results of the complex permittivity of four coffee stages: the coffee cherries, pulped, green, and roasted coffee in the 0.3–6 GHz range, and studies the estimation of a physicochemical variable (i.e., moisture content) that is critical to the processing of coffee with the permittivity response of the coffee samples.
Material and methods
Dielectric spectroscopy characterization
The dielectric spectroscopy technique allows the characterization of coffee in all processing stages without any additional processing. The coffee permittivity is affected by the contents of polar compounds as methanol, ethanol, water, along with other sugars contained in the pulp, mucilage, and seeds.[Citation9] These polar compounds have relaxation frequencies between 1 GHz and 20 GHz that vary across the stages as the moisture content also fluctuates.
The study requires of wideband technology (i.e., 300 MHz–6 GHz) and must be compatibile with high and low moisture content samples that are directly extracted from the processing of coffee. Commercial dielectric spectroscopy systems are not broadband, operate at lower frequencies, or are not compatible with samples of varying moisture content.[Citation13] Consequently, this study presents a dual technology approach. A Keysight N1501A (Santa Rosa, USA)[Citation17] open circuit coaxial probe was used to measure coffee cherries and pulped coffee, which were denominated as the wet group. This device is wideband, operates in the frequency range of interest, but is not compatible with low moisture samples that are not ground. Hence, a dielectric platform to measure these samples was designed and fabricated. The operation principle of the platform is a couple of planar transmission lines that are exposed to the sample.[Citation18] This platform operates in the same frequency range (i.e., 300 MHz–6 GHz), and is compatible with all types of samples. Furthermore, this technology is based on low cost versatile printed circuit board (PCB) technology.
Dielectric platform design and validation
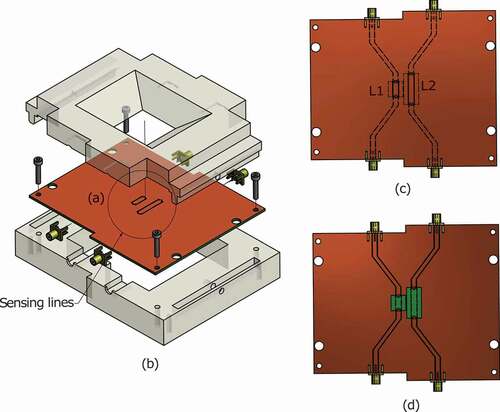
The dielectric platform is based on two coplanar waveguide lines with the same topology, but different lengths (see ). The propagation constant of the wave travelling through the transmission lines is calculated by a TRL (Thru, Reflect, Line) calibration technique. The propagation constant is a function of the permittivity of the sample and the substrate used for the printed circuit board. Once the propagation constant is calculated, it is possible to retrieve the permittivity of the sample lying on top of the lines.[Citation18] To measure liquids and coffee samples, the platform counts with a funnel-shaped plastic cover to contain different substrates with varying bulk density.
Figure 1. Dielectric platform with isometric view of (a) printed circuit board (PCB), and (b) plastic container, (c) PCB top view (with distances and
), and (d) bottom view.
The experimental validation of the platform consists on the comparison of the measurements of four polar fluids that were also measured with the Keysight N1501A dielectric performance probe: distilled water, ethanol at 95% purity, methanol at 99% purity, and a low permittivity fluid. Then, the platform’s extracted dielectric constant was corrected according to the methodology in[Citation19] with the previously measured fluids. This is required due to simplifications performed in the permittivity calculation.
The platform measurements were performed using a Rohde & Schwarz ZVB20 4-port network analyzer (Munich, Germany). The device was calibrated with the TOSL method from 0.3 to 6 GHz, set to 801 points with an intermediate frequency filter configuration of 10 kHz. The Keysight N1501A dielectric performance probe was used connected to a HP8753D vector network analyzer (Santa Rosa, USA), which was adjusted with the same configuration and frequency range as the ZVB20, and air, short, and distilled water samples.
Coffee samples
Two different coffee varieties were selected for this study: Catimor (CA) and Caturra (CU). All samples were collected in the coffee cherry stage, during the 2016 harvest, from a smallholding farm at Pilalito, Colombia, in the department of Huila. The crop is at 1350 amsl, with an average temperature of 21°C and precipitations of around 1520 mm every year. The specimens were stored, transported and wet processed at the pilot plan of Universidad Surcolombiana in Neiva, Huila.
The set comprises 18 samples, 9 for each variety. Ripe or almost ripe cherries were selected for this set, according to the Colombian coffee industry harvest standards.[Citation6] The development of the endosperm and growth of the bean results in an increase of dry matter; hence, slight variations in the moisture content of the bean are expected with the progress of ripeness.[Citation20] Ten kilograms (10 kg) of fresh cherries collected at the plantations were stored at 8°C and transported to the pilot plant in a time window not superior to 6 hours. The coffee cherries were then mechanically pulped with a Gaviota 300 pulping machine (Bogotá, Colombia). The remaining pulped coffee (i.e., ~ 5 kg) was fermented for 18–20 hours in plastic containers. After this period, the beans were washed to remove any mucilage residues and sun-dried until a moisture content between 9% and 10% was achieved. The remaining coffee was hulled in an Ingesec laboratory hulling machine (Bogotá, Colombia), and roasted in a Quantik TC-150A R/G laboratory roaster (Armenia, Colombia) according to the SCAA cupping protocol standards.[Citation3]
The moisture content of green and roasted beans was measured with a Gehaka Agri Moisture Tester G600 (Sao Paulo, Brazil). The moisture content for cherry and pulped samples was obtained by the wet basis gravimetrical method according to the ISO 6673 standard.[Citation21] Aluminum tins were used to contain the samples, and each empty tin was weighed in a four-digit precision scale. The weight of each container was recorded as WT. Once the 5 g coffee sample was deposited inside the tin, the weight was obtained again and corresponds to the wet weight (WW+ WT). Then, the samples were introduced in a Memmert 55 oven (Schwabach, Germany) set at 105°C. The contents of the tins were dried at this temperature for 24 hours. The samples were weighed again to register the dry weight of the contents (DW+ WT). Accordingly, the moisture content was calculated (1).[Citation21] All measurements were obtained in triplicate.
The bulk density was obtained by the traditional weight and volume method. First, the weight of the beaker to contain the samples was measured. Then, the samples were deposited in the beaker to account their volume. The full beaker was weighed again, and the weight from the empty beaker subtracted from this last measurement. Finally, the bulk density was computed by dividing the weight of the samples by their volume. As with the moisture content characterization, the bulk density measurement were performed in triplicate.
For the dielectric tests, 40 g of each coffee stage were stored at 4°C immediately after being processed. These samples were stored for no more than two weeks, when the dielectric spectroscopy studies were performed. The samples were taken out and stabilized two hours prior to the analysis, in a controlled humidity environment (i.e., at 65% humidity). The moisture content considered in the study corresponds to the values registered before storage at 4°C. The coffee cherry and pulped coffee samples were processed with both the probe and the dielectric platform, while the green and roasted coffee samples were processed with the dielectric platform. These measurements were also performed in triplicate.
Data analysis
Working with both the dielectric constant and the loss factor might be misleading as both features depend on the bulk density of the samples.[Citation22] Meyer and Schilz developed a bulk density independent relationship, which is frequency dependent, and presented good results for wheat and barley moisture content characterization. The Meyer and Schilz coefficient (2).[Citation22]
The dielectric constant and the loss factor present a linear (ρ) and quadratic (ρ2) dependence on the bulk density.[Citation23] Hence, the Meyer and Schilz coefficient eliminates this dependence by obtaining the quotient between these two quantities.[Citation24] The Pearson correlation coefficient was calculated between the bulk density for the 18 samples and the response at each frequency point for the dielectric constant, the loss factor and the Meyer and Schilz coefficient. Then, a general data distribution containing the value of correlation for all frequencies was obtained. This distribution was the basis for selecting the feature for the partial upcoming models.
All statistical analyses were performed with the mdatools package in R 3.4.4,[Citation25] and modeled by partial least squares (PLS).[Citation24] Variable Importance Projection (VIP) was used to select the most significant variables.[Citation26] Hence, variables with VIP under 1 were iteratively removed from the model if the root square mean error of the model (RMSE) improved. The latent variable selection was performed by 10-fold cross validation, by selecting the number of latent variables that resulted in the least RMSE. The data set was divided into 12 random samples (i.e., 6 for each variety) for calibration, and the remainder 6 for prediction. These sample division was randomly performed 15 times to verify for possible equivalent models. The coefficients, VIP values, and RMSE values were averaged to represent the final model. The results from both PLS models are depicted in the biplots, and the model’s accuracy are presented in the average RMSE values obtained for both calibration and prediction models.
The PLS biplots present the scores for the first two components on the left plot. Both color and shape represent variety. The right plot presents the loadings plot. The loadings plot presents the values for 15 frequencies points that were evenly distributed among the 0.3–6 GHz range. The blue arrow in the right arrow depicts the direction of the moisture content as an indicator on how the frequency values relate to the variable of interest.
Results and discussion
Dielectric platform validation
The first part of the platform validation corresponds to the measurement of four different polar compounds with both technologies. presents the results for distilled water (), ethanol (
), methanol (
), and a low permittivity polar fluid (
).
Figure 2. Dielectric platform and Keysight N1501 probe measurements: dielectric constant (DC) [left axis] and loss factor (L) [right axis] for (a) water, (b) methanol, (c) ethanol, and (d) biodiesel.
![Figure 2. Dielectric platform and Keysight N1501 probe measurements: dielectric constant (DC) [left axis] and loss factor (L) [right axis] for (a) water, (b) methanol, (c) ethanol, and (d) biodiesel.](/cms/asset/6bb34e68-eb6b-4795-8866-5b5e126dbe8d/ljfp_a_1490320_f0002_oc.jpg)
presents good agreement between the results of the Keysight N1501A probe and the dielectric platform. presents the comparison between the permittivity for green coffee obtained in this study with the extrapolated Debye model for parchment coffee presented in.[Citation14] This figure also presents good agreement for the samples under analysis, especially for the dielectric constant.
Figure 3. Comparison of (a) dielectric constant and (b) loss factor for green coffee in this study and parchment coffee in.[Citation14]
![Figure 3. Comparison of (a) dielectric constant and (b) loss factor for green coffee in this study and parchment coffee in.[Citation14]](/cms/asset/a8fbcf59-a677-4e9c-8bf3-a12c113d6d1d/ljfp_a_1490320_f0003_oc.jpg)
Complex permittivity of coffee
The complex permittivity of coffee for the four processing stages is presented in . The first column depicts the dielectric constant and the loss factor for the wet group (i.e., cherry and pulped). The second column presents the same quantities for the dry stages (i.e., green and roasted). The solid line represents the mean for the first sample set (n = 18), while the standard deviation is represented by the colored region around the line.
Figure 4. Mean and standard deviation, minimum, and maximum values for the dielectric constant of (a) coffee cherries and pulped coffee and (b) green and roasted coffee. Mean and standard deviation, minimum, and maximum values for the loss factor of (c) coffee cherries and pulped coffee and (d) green and roasted coffee.
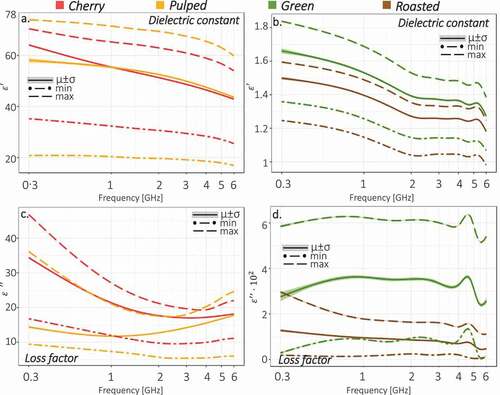
The moisture content for coffee cherries varied from 63.5 to 71.6%, 52.4 to 60.2% for pulped coffee, 8.1 to 10.4% for green coffee, and 0.8 to 1.6% for roasted coffee. The bulk density of the samples varied from 436.6 to 552.8 kg/m3 for coffee cherries, 542.2 to 938.5 kg/m3 for pulped coffee, 665.2 to 737.8 kg/m3 for green coffee, and 322.1 to 381.5 kg/m3 for roasted coffee.
The dielectric constant for the coffee cherry stage varies from 65 to 42 in the selected frequency range, with maximum values that go from 76 to 60 and minimum values from 35 to 25 (see .a). The loss factor is greater in the beginning of the range (i.e., ~ 35), representing that low relaxation frequency compounds dominate the response at these frequencies, and decreases to 18 with a minimum of 17 at 3 GHz. When the cherries are pulped, the dielectric constant decreases to 58 but gets close to the cherry stage response after 1 GHz. The minimum values are lower, and the maximum values are greater than the cherry stage. The minimum to maximum range of the data might be related to the variation of the bulk density of the pulped coffee samples when compared to the cherry samples. Consequently, the bulk density does contribute to the permittivity of the studied samples.
For the loss factor, there is a reduction of about 60% of the losses at the beginning of the band for pulped coffee when compared to the cherry stage, and they converge to similar values after 3 GHz. Contrarily to the dielectric constant, the minimum and maximum values for the losses seem to be consistent with the reduction of the loss factor at the end of the band and the moisture content loss during the processing. This tendency might represent a loss of other components during the threshing of the skin different from water, as ethanol or methanol.[Citation9] Oppositely, the end of the band might be dominated by the water contained inside the mucilage and the beans.
In the case of green and roasted coffee, a reduction with a factor between 30 and 40 for the dielectric constant is perceived. This is consistent with the moisture content reduction of these samples. The trend for green and roasted coffee is similar with an offset type shift of about 0.15 for the dielectric constant. The dielectric constant variation for these dry samples is associated to their moisture content and bulk density. The losses for both stages are low, varying from 0.035 to 0.026 for green coffee and from 0.012 to 0.005 for roasted coffee. Green coffee presents an increment of the losses at the beginning of the band while roasted coffee’s losses reduce with the frequency increase. It is important to notice that both samples present low moisture contents, and the difference in the losses behavior might be related to the higher water activity in the green coffee samples. The distance between the maximum and minimum values for green coffee is greater, with elevated standard deviation. As with pulped coffee, the variability in these samples might be related to the wider variation of the bulk density at this processing stage.
Bulk density and permittivity
depicts the absolute Pearson correlation for each permittivity quantity as presented in the materials and methods section. This information is relevant as all frequencies are considered as independent variables in the partial least squares model.
Figure 5. Absolute Pearson correlation for every dielectric attribute and all processing stages.
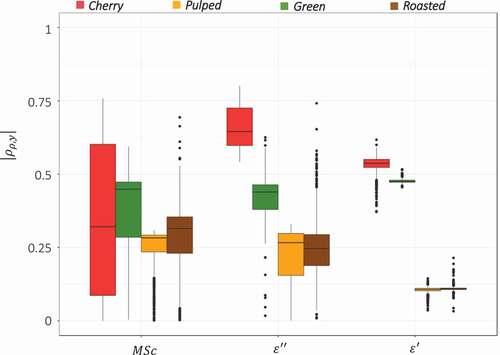
The least variance correlation values where obtained for the dielectric constant. The boxplot shows that the MSc has high variance, as the 25–75% quartile varies between 0.13 and 0.56 for coffee cherry, 0.29 and 0.48 for green coffee, 0.24 and 0.28 for pulped coffee, and 0.23 and 0.35 for roasted coffee. However, the lower median values for most of the stages were obtained for the Meyer and Schilz coefficient. Median values for each stage are: 0.3 for coffee cherry, 0.45 for green coffee, 0.28 for pulped coffee, and 0.3 for roasted coffee. Consequently, the Meyer and Schilz coefficient was selected for the moisture content modeling.
Modeling of the moisture content
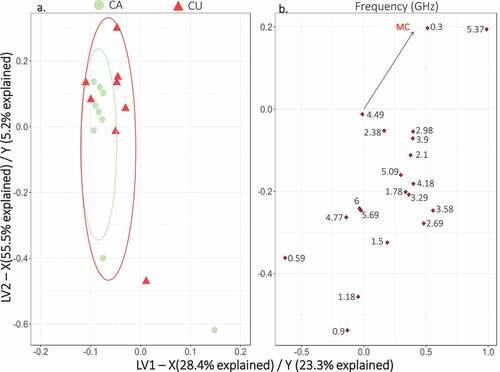
As mentioned in the materials and methods section, the moisture content for each stage was modeled by PLS (n = 18). presents the biplot for the coffee cherries model. The first two latent variables represent 96.5% of the variation of the permittivity and 35.7% of the moisture content. The variety information is distributed across both latent variables; still, the differentiation between these varieties by their cherry stage permittivity is not evident. High frequency variables (i.e., ~ 4–6 GHz) distribute along the direction of the moisture content, especially for the first latent variable.
Figure 6. PLS biplot of coffee cherry samples for moisture content estimation - (a) scores (b) loadings for 15 frequencies.
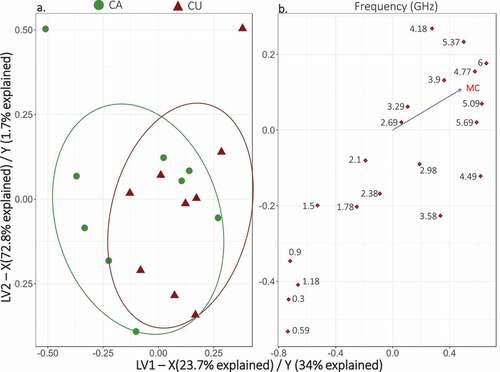
The low frequency variables (i.e., ~ 0.3–1.2) are distributed in the opposite direction of the moisture content. The interaction between these frequency ranges may result interesting and contribute to the estimation of the moisture content of the coffee cherries.[Citation27]
The biplot for the moisture content of green coffee is presented in .
Figure 7. PLS biplot of green coffee samples for moisture content estimation - (a) scores (b) loadings for 15 frequencies.
The first two latent variables represent 83.9% of the variability of the permittivity of the samples, and 28.5% of the variability of the moisture content. The biplot for green coffee shows a tight distribution of the samples across latent variable 1, except for two outlier samples. For the analyzed varieties, Catimor samples are less spread than Caturra. For green coffee samples, the loadings cluster around positive LV1 and negative LV2 values. Loadings for coffee cherry group around a line that starts in the third quadrant and moves towards the first quadrant of the two-dimensional mapping. High loading variables that are colinear to the moisture content are 0.3 GHz and 5.37 GHz, while 0.59 GHz aligns in the opposite direction of LV1, and 0.9 GHz and 1.18GHz in the opposite direction of LV2. The RMSE and cross validated determination coefficient for all moisture content (MC) models are presented in .
Table 1. Root mean square error (RMSE) and cross-validated determination coefficient (Q2) for moisture content (MC) models (calibration (C)/prediction (P)).
The predictive capabilities of the models are good as the error increase from the calibrated to the predicted data in 10% in average, except for roasted coffee. The cherry and pulped coffee models show low error increase: 0.4 and 1%, respectively. The mean moisture content for each processing stage shows a reduction of water with processing. The moisture content decrease from cherry to pulped coffee originates from the loss of most of the mucilage and the skin during pulping. The green coffee drying and Maillard reaction in roasted beans explain the water loss in these two stages.[Citation6] Consequently, this moisture content variations contribute to the permittivity changes between stages shown in .
As with other agriculture applications, the complex permittivity of coffee has shown to be an accurate proxy for the estimation of the water content of the samples.[Citation13,Citation28] For the studied frequency range, the performance is superior for the wet groups (i.e., cherry and pulped) than for the dry group. Consequently, the permittivity study in the 0.3–6 GHz results interesting for the moisture content estimation of cherry and pulped coffee.
The dielectric spectroscopy technique can be used and evaluated to assess other stages of the processing. For example, fresh pulped coffee samples can be extracted from the fermentation tank to evaluate the progress of the process or assess related process variables. Additionally, coffee cherry samples could be analyzed to assess the maturity of the samples.
Although the performance for green coffee is not the best, other water related variables might be studied at this stage. For example, the water activity in the green coffee beans is an important feature in the chemical composition of the coffee brew. [Citation29] Hence, evaluating the predictive capacities of the complex permittivity of green coffee for the estimation of the water activity of the beans can be a potential extension of this work.
Conclusion
This work presents the complex permittivity for four processing stages of coffee: coffee cherries, pulped coffee, green coffee, and roasted coffee, and the prediction feasibility of the permittivity to estimate the moisture content of the samples. The study considered technologies and dielectric quantities that were compatible with the samples of each processing stage without any further processing. The operation of the dielectric platform designed for this study was validated with four polar compounds and previously reported parchment coffee data. The novelty of this study relies on the exploration of processing stages that are accessible to the coffee smallholders, and not only to the coffee processing industry. The dependence on the bulk density at this frequency range is still important. Future studies could consider alternatives relationships that minimize the bulk density effect or perform nonlinear modeling of the data to compensate for this dependence.[Citation22] As an alternative analytical approach, the dielectric spectroscopy approach losses the resonant nature of other approaches that have proven to be effective for this type of coffee studies.[Citation30–Citation34] One of the most notable advantages of this approach is that the samples do not require of any sort of previous handling and that the wide frequency range offers the possibility of exploring several behaviors. Consequently, this technology offers an intermediate alternative between data availability and easiness of analysis and use.
Acknowledgments
Physical analysis of coffee and sample collection was performed by Erika Tatiana Cortés Macías, Dayana Alejandra Orozco Blanco, and Wilmer Licerio Ladino Garzón from the Cesurcafé group, at Universidad Surcolombiana. Dielectric measurements (i.e., coaxial probe and platform) were performed by William Romero, from Universidad de los Andes.
Additional information
Funding
References
- International Coffee Organization - The Current State of the Global Coffee Trade | #CoffeeTradeStats. Food Research International. http://www.ico.org/monthly_coffee_trade_stats.asp.
- Sunarharum, W. B.; Williams, D. J.; Smyth, H. E. Complexity of Coffee Flavor: A Compositional and Sensory Perspective. Food Researcher International 2014, 62, 315–325. DOI: 10.1016/j.foodres.2014.02.030.
- Cupping standards. http://://www.scaa.org/?page=resources&d=cupping-standards.
- Poltronieri, P.; Rossi, F. Challenges in Specialty Coffee Processing and Quality Assurance. Challenges 2016, 7, 19. DOI: 10.3390/challe7020019.
- Puerta-Quintero, G. I.;. Influencia De Los Granos De Café Cosechados Verdes En La Calidad Física Y Organoléptica De La Bebida. Cenicafé 2000, 51, 136–150.
- Arcila, J.; Farfán, F.; Moreno, A.; Salazar, L.; Hincapié, E. Sistemas De Producción De Café En Colombia, 1st EditioCENICAFE; Caldas: Chinchina, 2007
- Sustainability that matters 1927-2010. https://www.federaciondecafeteros.org/static/files/informe_sostenibilidad_eng.pdf.
- Mathieu, F.; Malosse, C.; Frérot, B. Identification of the Volatile Components Released by Fresh Coffee Berries at Different Stages of Ripeness. Journal Agricultural Food Chemical 1998, 46, 1106–1110. DOI: 10.1021/jf970851z.
- Ortiz, A.; Vega, F. E.; Posada, F. Volatile Composition of Coffee Berries at Different Stages of Ripeness and Their Possible Attraction to the Coffee Berry Borer Hypothenemus Hampei (Coleoptera : Curculionidae). Journal of Agricultural and Food Chemistry 2004, 52, 5914–5918. DOI: 10.1021/jf049537c.
- Sandoval, Z.; Prieto, F.; Betancur, J., Digital Image Processing for Classification of Coffee Cherries, in Electronics, Robotics and Automotive Mechanics Conference (CERMA), 2010, 2010, pp. 417–421.
- Silva, S. D.; De Queiroz, D. M.; Pinto, F. D. C.; Santos, N. T. Coffee Quality and Its Relationship with Brix Degree and Colorimetric Information of Coffee Cherries. Precis Agricultural 2014, 15, 543–554. DOI: 10.1007/s11119-014-9352-y.
- Damez, J.-L.; Clerjon, S. Quantifying and Predicting Meat and Meat Products Quality Attributes Using Electromagnetic Waves: An Overview, 2013, 95, 879-896.
- Sosa-Morales, M. E.; Valerio-Junco, L.; López-Malo, A.; García, H. S. Dielectric Properties of Foods: Reported Data in the 21st Century and Their Potential Applications. LWT - Food Sciences Technological 2010, 43, 1169–1179. DOI: 10.1016/j.lwt.2010.03.017.
- Berbert, P. A.; Queiroz, D. M.; Sousa, E. F.; Molina, M. B.; Melo, E. C.; Faroni, L. R. D. Dielectric Properties of Parchment Coffee. Journal Agricultural Engineering Researcher 2001, 80, 65–80. DOI: 10.1006/jaer.2000.0689.
- Iaccheri, E.; Laghi. L.; Cevoli, C.; Berardinelli, A.; Ragni, L.; Romani, S. Different Analytical Approaches for the Study of Water Features in Green and Roasted Coffee Beans. Journal Food Engineering 2015, 146, 28–35. DOI: 10.1016/j.jfoodeng.2014.08.016.
- Lime Microsystems. FPRF MIMO Transceiver IC With Integrated Microcontroller LMS7002M; Surrey Tech Centre Occam Road, Guildford, United Kingdom 2015.
- Keysight Technologies. Basics of Measuring the Dielectric Properties of Materials. Application note. Keysight Technologies, Santa Rosa, California 2015.
- Roelvink, J.; Trabelsi, S.; Nelson, S. O. A Planar Transmission-Line Sensor for Measuring the Microwave Permittivity of Liquid and Semisolid Biological Materials. IEEE Transactions Instruments Measurement 2013, 62, 2974–2982. DOI: 10.1109/TIM.2013.2265453.
- Blackham, D. V.; Pollard, R. D. An Improved Technique for Permittivity Measurements Using a Coaxial Probe. IEEE Transactions Instruments Measurement 1997, 46, 1093–1099. DOI: 10.1109/19.676718.
- de Castro, R. D.; Marraccini, P. Cytology, Biochemistry and Molecular Changes during Coffee Fruit Development. Brazilian Journal Plant Physiological 2006, 18, 175–199. DOI: 10.1590/S1677-04202006000100013.
- Adnan, A.; Von Hörsten, D.; Pawelzik, E.; Mörlein, D. Rapid Prediction of Moisture Content in Intact Green Coffee Beans Using near Infrared Spectroscopy. Foods 2017, 6, 38. DOI: 10.3390/foods6080062.
- Berbert, P. A.; Molina, M. B.; de Oliveira Carlesso, V.; de Oliveira, M. R. Use of a Dielectric Function for Determination of Coffee Seeds Moisture Content. Bragantia 2008, 67, 541–548. DOI: 10.1590/S0006-87052008000200032.
- Nelson, S. O.; You, T.-S. Relationships between Microwave Permittivities of Solid and Pulverised Plastics. Journal Physical D Applications Physical 1990, 23, 346–353. DOI: 10.1088/0022-3727/23/3/014.
- Wehrens, R.;. Chemometrics with R : Multivariate Data Analysis in the Natural Sciences and Life Sciences; Springer, New York, United States 2011.
- Mdatools: Multivariate Data Analysis for Chemometrics. https://cran.r-project.org/web/packages/mdatools/mdatools.pdf.
- Andersen, C. M.; Bro, R. Variable Selection in Regression-A Tutorial. Journal Chemometrics 2010, 24, 728–737. DOI: 10.1002/cem.1360.
- Castro-Giraldez, M.; Fito, P. J.; Chenoll, C.; Fito, P. Development of a Dielectric Spectroscopy Technique for the Determination of Apple (Granny Smith) Maturity. Innovative Food Sciences Emergency Technological 2010, 11, 749–754. DOI: 10.1016/j.ifset.2010.08.002.
- Berbert, P. A.; Molina, M. A. B.; Carlesso, V. O.; Oliveira, M. T. R. Moisture Determination in Coffee Seeds by the Capacitance Method at Radiofrequencies. Reviews Bras Sementes 2007, 29, 159–170.
- Manzocco, L.; Nicoli, M. C. Modeling the Effect of Water Activity and Storage Temperature on Chemical Stability of Coffee Brews. Journal of Agricultural and Food Chemistry 2007, 55, 6521–6526. DOI: 10.1021/jf070166k.
- Craig, A. P.; Franca, A. S.; Oliveira, L. S. Discrimination between Immature and Mature Green Coffees by Attenuated Total Reflectance and Diffuse Reflectance Fourier Transform Infrared Spectroscopy. Journal Food Sciences 2011, 76, C1162–C1168. DOI: 10.1111/j.1750-3841.2011.02359.x.
- Bona, E.; Marquetti, I.; Varaschim Link, J.; Yasuo Figueiredo Makimori, G.; da Costa Arca, V.; Luis Guimar, A. Support Vector Machines in Tandem with Infrared Spectroscopy for Geographical Classification of Green Arabica Coffee. LWT - Food Sciences Technological 2017, 76, 330–336. DOI: 10.1016/j.lwt.2016.04.048.
- Tolessa, K.; Rademaker, M.; de Baets, B.; Boeckx, P. Prediction of Specialty Coffee Cup Quality Based on near Infrared Spectra of Green Coffee Beans. Talanta 2016, 150, 367–374. DOI: 10.1016/j.talanta.2015.12.039.
- Barbin, D. F.; De, A. L.; Felicio, S. M.; Sun, D.-W.; Nixdorf, S. L.; Hirooka, E. Y. Application of Infrared Spectral Techniques on Quality and Compositional Attributes of Coffee: An Overview. Food Researcher International 2014, 61, 23–32. DOI: 10.1016/j.foodres.2014.01.005.
- Santos, J. R.; Viegas, O.; Scoa, R. N. M. J. P.; Ferreira, I. M. P. L. V. O.; Rangel, A. O. S. S.; Lopes, J. A. In-Line Monitoring of the Coffee Roasting Process with near Infrared Spectroscopy: Measurement of Sucrose and Colour. Food Chemistry 2016, 208, 103–110. DOI: 10.1016/j.foodchem.2016.03.114.