
ABSTRACT
Fish oil is beneficial to health and its quality is significantly impacted by the extraction method. To determine the effect of various methods used to extract the oil on its chemical composition and thermal properties, tilapia oil extracted by dilute alkali hydrolysis, enzymatic hydrolysis, and microwave-assisted methods were investigated in this study. Nutrient analyses showed that freeze-dried tilapia contained fat (36.69 g/100 g freeze-dried tilapia), protein (49.95 g/100 g freeze-dried tilapia), ash (12.04 g/100 g freeze-dried tilapia) and moisture (1.21 g/100 g freeze-dried tilapia). Chemical analysis showed that the fish oil extracted by dilute alkali hydrolysis had the lowest acid value (AV) and peroxide value (POV) (AV: 0.77 mg KOH/g oil and POV: 3.76 mmol/kg oil) compared to the oil extracted using the other methods. The main fatty acid components were palmitic acid (22.78–23.16%), oleic acid (25.73–26.19%), and linoleic acid (15.69–15.98%). Furthermore, the oil extracted by dilute alkali hydrolysis showed significantly higher content of DHA+ EPA (2.30%). The thermal behaviors indicated that the aforementioned oils had significantly different crystal structures. The main endothermic peaks of fish oil extracted by dilute alkali hydrolysis, enzymatic hydrolysis and microwave-assisted methods were located at −2.03℃, −3.20℃ and −4.37℃, respectively. However, infrared spectroscopic analyses indicated them had the same characteristic functional groups. Consequently, different extraction methods significantly affect the oil’s physical and chemical properties without affecting spectral characteristics. Furthermore, these results advocated the use of alkali hydrolysis for fish oil extraction.
Introduction
Tilapia (Oreochromis spp), also known as oreochromis mossambicus or hybrid tilapia, is one of the most famous and important freshwater fish; the second widely and successfully farmed species among aquatic animals around the world.[Citation1,Citation2] Tilapia, typically eaten fresh or sold as frozen fish fillets, is popular among consumers due to its delicious meat, high protein content, and unsaturated fatty acid (UFA) content.[Citation3]Nowadays tilapia has been widely farmed in Africa and Asia.[Citation4,Citation5]With the increase of tilapia consumption, the reuse of tilapia waste (such as head, bone, tail, offal) has become a focus of attention and most factories choose to use them to process surimi, feed and fish oil.[Citation6,Citation7] In particular fish oil, the most widely used functional oil not only widely praised by consumers, but also brought huge profits to the sellers. Many scientific studies have proved that fish oil has high nutritional value as it is rich in polyunsaturated fatty acids (PUFAs), which consist of ω-3 PUFAs and ω-6 PUFAs, particularly docosahexaenoic acid (DHA) and eicosapentaenoic acid (EPA).[Citation8,Citation9] DHA can significantly promote an infant’s intellectual development, enhance memory, and improve eyesight; accordingly, it has been dubbed the Brain Gold.[Citation10] In addition, EPA can prevent atherosclerosis, hypertension, and allergic reactions.[Citation11,Citation12]
Several methods for the extraction of fish oil have been developed, including traditional Soxhlet, mechanical pressing, boiling process, dilute alkali hydrolysis, enzymatic hydrolysis, supercritical extraction, and microwave-assisted method, with each method having both benefits and downsides.[Citation13] The large-scale fish oil factories normally extract fish oil by mechanical pressing as it is simple and easy to operate; however, the efficiency is not high. The solvent-extraction method is commonly used in small laboratory studies, and its extraction time is longer and therefore not suitable for industrial production. Relatively dilute alkaline hydrolysis and enzymatic hydrolysis both have the advantages of the green, safe, low cost, and microwave-assisted method is, in fact, using microwave to shorten the time of the soxhlet extraction, so it has extensive applicability of soxhlet extraction, and also has the advantages of short time efficient, therefore the potential of these three methods with industrialized production. Moreover, a number of studies have indicated that the quality and nutritional value of oil depended on the extraction methods, such as the composition of phenolic compounds and FAs as well as oil volatile profiles, as shown by the work of Khattb[Citation14], Santos[Citation15], Pizarro[Citation16], Khoddami[Citation17], and Vichi.[Citation18] Therefore, the analysis of the effects of different extraction methods on the quality and nutritional value of fish oil is of practical significance. However, this type of report is underexplored, especially on tilapia fish oil. Thus, a need remains to study the value of extraction methods on tilapia oil processing.
Therefore, the object of our research was compared the effects of three extraction methods (dilute alkali hydrolysis, enzymatic hydrolysis, and microwave-assisted method) on tilapia oil characteristics (the chemical composition, FA composition and content, thermal properties, and spectroscopic characterization), so as to find a method which can be applied to industrial production and better preserve the nutritional value of tilapia oil. The findings of this study will provide more information on how to process fish oil efficiently to maintain optimal nutritional value and quality.
Materials and methods
Chemicals
Standard fatty acid methyl esters (FAME, GLC-463) were obtained from Nu-Chek Prep Inc. (Elysian, MN, USA). Methanol, n-hexane, and other solvents used for gas chromatography(GC) analysis were purchased from Aladdin (Shanghai, China). Alkaline protease (enzyme activity: 200U/mg) was purchased from Yuanye Biological Technology Co., Ltd. (Shanghai, China). Solvents and reagents (potassium hydroxide, potassium nitrate, hexane, and others) were analytical reagent grade.
Sample preparation
Tilapia (length: 25.00 ± 1.26 cm, weight: 1.50 ± 0.24 kg) samples were captured between May and July 2017 in Haikou province, China, and then immediately transported in ice to the laboratory. The captured tilapia is reservoir cultured and its main food is phytoplankton. Fish samples were weighed, cleaned, and vacuum-freeze-dried (–80°C, 1.3 Pa, 48 hours) to a constant weight. The samples were homogenized by a disintegrator and stored at −80°C until analyzed. Freeze-dry processing was used as we determined from previous laboratory studies that this technique is ideal to work with raw materials.
Oil extraction
Oil samples were extracted via three methods: enzymatic hydrolysis, diluted alkaline hydrolysis, and microwave-assisted method. From preliminary laboratory studies, we determined the optimal process for the three extraction methods.
The processing of dilute alkali hydrolysis: (i) Putting some freeze-dried tilapia samples into triangle bottle,and then adding proper amount of deionized water and adjusting the solid-liquid ratio(1:2.5,m/v), (ii) Adjusting pH to 8.0 with 10 g/100 mL KOH solution, (iii) Hydrolysis condition: temperature of 55°C and time of 30 min, (iv) Adding KNO3(3 g/100 g raw materials), salting-out time of 20 min, (v) Centrifugation of 8000 r/min,and then siphon upper liquid.
The processing of enzymatic hydrolysis: (i) Putting some freeze-dried tilapia samples into triangle bottle,and then adding proper amount of deionized water and adjusting the solid-liquid ratio (1:2, m/v), (ii) Adjusting pH to 9.0 with 10 g/100 mL KOH solution, (iii) Hydrolysis condition: enzyme dosage of 0.8 g/100 g raw materials, temperature of 55°C, and time for 2.5 h, (iv) Enzyme deactivation: temperature of 90°C, and time of 5 min, (v) Centrifugation of 8000 r/min,and then siphon upper liquid. The conditions for the microwave-assisted method were hexane as the optimal solvent, a solid-liquid ratio of 1:10(m/v), microwave power of 100 W, extraction time of 10 min. After the extraction,it is centrifuged at 8000 r/min. The oil samples were concentrated on 0.22-μm filters and then stored at −80°C before analysis.
Nutrient and chemical composition
Nutrient composition (protein, fat, moisture, and ash) analysis was carried out according to the Association of Official Analytical Chemists. The acid value (AV) and peroxide value (POV) were determined according to the American Oil Chemists Society (AOCS) official methods.[Citation19,Citation20] Color and luster of oil samples were tested by WSL-Lovibond (Zhejiang Top instrument CO.,Ltd.,China). Odor is assessed by the professional senses.[Citation20]
Fas analysis
The composition of FA and FAME in tilapia oil was analyzed by GC with a flame ionization detector (FID) and a fused silica capillary column (100 m × 0.25 mm × 0.2 μm) coated with 100% cyanopropyl polysiloxane (CP-Sil 88, Chrompack; Agilent Technologies, Shanghai, China). Hydrogen (99.999%) was used as the carrier gas at a flow rate of 30 mL/min; nitrogen (99.999%), hydrogen, and air were used as the makeup gas. The FID and injector temperatures were kept at 250°C. The oven temperature program (86 min in total) was as follows: The initial temperature was set at 45°C for 4 min, increased to 175°C at a rate of 13°C/min, maintained for 27 min,further raised to 215°C at a rate of 4°C/min, and finally kept at 215°C for 35 min. The injector and detector were kept at 250°C.[Citation21,Citation22] Analysis of all peaks was accomplished by comparison of their retention time with that of FAME standards and the percentage of FAs is determined by area normalization (expressed as a percentage of the peak area).
Thermal Properties Analysis (Differential scanning calorimetry, DSC)
Nitrogen (99.999%) was used as the purge gas and flowed at 10°C/min. Samples of 0.0050–0.0100 g were weighed into aluminum pans to the nearest 0.0001 g, and the covers were hermetically sealed into place. An empty, hermetically sealed aluminum pan was used as the reference. Before sample analysis, the baseline was obtained with an empty, hermetically sealed aluminum pan.[Citation23,Citation24]
Spectroscopic characterization
The oil samples were evenly daubed on the KI2 flake. Spectroscopic absorption in the infrared region was obtained with a resolution of 2 cm–1, 18 scans, and within the frequency range of 4000 to 400 cm–1 .[Citation15] Infrared spectra were pretreated by point smoothing, normalization, and baseline correction.
Statistical analysis
All experiments were conducted as three parallel experiments and analyzed using Origin 9.0 software. Single factor analysis of variance (one-way ANOVA) and Duncan’s test were used to analyze the FAs content and chemical composition of oil samples. Data are expressed as the mean value ± standard deviation. Significance level was considered at p<0.05.
Results and discussion
Nutrient composition of freeze-dried tilapia
The nutrient composition of the sample is presented in . In a traditional extraction method, the fish would be cleaned and then air dried; however, with this technique, it is difficult to guarantee the uniformity of water content in raw materials. Here, we used freeze-dry processing, as we determined from previous laboratory studies that this technique is ideal to work with raw materials. The nutrient content of freeze-dried tilapia consisted of moisture (1.21 g/100 g freeze-dried tilapia), protein (49.95 g/100 g freeze-dried tilapia), fat (36.69 g/100 g freeze-dried tilapia), and ash (12.04 g/100 g freeze-dried tilapia); thus, comparatively high content levels of fat and protein were found.
Table 1. Nutrient composition of freeze-dried tilapia (dry weight bases).
Chemical composition of oil samples
AV and POV are important indexes to evaluate the quality of oil, with low values usually indicating good quality.[Citation25] shows that AV (0.77 mg KOH/g oil) and POV (3.76 mmol/kg oil) of fish oil extracted by diluted alkaline hydrolysis were significantly lower than those of enzymatic hydrolysis and microwave-assisted method. Further, color and odor are the most intuitive indicators of physical quality of fish oil, and the color and odor of the fish oil extracted by diluted alkaline hydrolysis were more acceptable than those from the oil obtained by the other methods. The fish oil extracted by the enzymatic method had a relatively unpleasant smell and a deeper color, probably due to the use of alkaline protease (alkaline protease smells bad, and its color is reddish brown). Through statistical analysis, we observed that the quality of fish oil obtained by the aforementioned methods is significantly different (p < 0.05).And the quality of oil Samples extracted by diluted alkaline hydrolysis significantly better than the others.
Table 2. Chemical composition of tilapia fish oil.
Fas analysis
The content of saturated fatty acids (SFAs) in tilapia fish oil was 32.78–34.64%, for which the content of C16:0 was the highest (22.78–23.16%), followed by C18:0 (5.29–5.62%) and C14:0 (2.95–3.16%) (). Further, the content of monounsaturated fatty acids (MUFAs) was 37.21–39.10%, which mainly consisted of oleic acid (25.73–26.19%), palmitic acid (9cC16:1, 5.56–5.88%), and 11cC18:1 (3.93–4.02%). The results also show that the content of PUFAs in all oil samples was about 26.64–27.21%, of which the content of ω-6 PUFAs was 21.58–21.92% and that of ω-3 PUFAs was 5.02–5.28%. In addition, a small amount (1.29–1.75%) of trans fatty acids (TFAs) was detected in tilapia oil. In recent years, many studies have shown that UFAs are closely related to human health by effectively promoting blood circulation, inhibiting tumor and atherosclerosis, and improving immunity and intelligence, among other effects.[Citation26] Therefore, tilapia fish oil has high nutritional value.
Table 3. Content of FAs in tilapia fish oil extracted by three extraction methods (total FAs %).
shows that the main FA components in tilapia oil were palmitic acid (C16:0, 22.78–23.16%), oleic acid (9cC18:1 n-9, 25.73–26.19%), and linoleic acid (9c12cC18:2 n-6, 15.69–15.98%); this result is in agreement with the work by Chen[Citation27] and AlSouti.[Citation28] Some studies have shown that palmitic acid inhibits the increase of hepatic stellate cells and the expression of alpha smooth muscle actins, thereby inhibiting hepatic fibrosis.[Citation29] Further, oleic acid is a MUFA that functions in the regulation of blood sugar, blood fat, and cholesterol.[Citation30] Linoleic acid is an essential FA in the human body and can promote growth and development. A previous study has also shown that linoleic acid may have a role in the development of vision and intelligence in infants.[Citation10] Overall, the contents of FAs in tilapia oil above 1% included C14:0, C16:0, 9cC16:1, 10cC17:1, C18:0, 9cC18:1 n-9, 11cC18:1, 9c12cC18:2 n-6, C18:3 n-6, C18:3 n-3, 11cC20:1 n-9, C22:4 n-6, and C22:6 n-3; most of these are UFAs.
shows that the FAs content were depended on the extraction conditions, especially for ω-3 PUFAs, ω-6 PUFAs, and TFAs. The ω-3 PUFAs extracted by dilute alkali hydrolysis were 5.28%, which were significantly higher than those of the other two extracts (p < 0.05). More importantly, through single factor analysis of variance, the content of many functional ingredients, including linoleic acid(LA), EPA, DPA, Arachidonic acid(AA), and Conjugated linoleic acid(GLA), had significant differences (p < 0.05).
The composition and content of UFAs are important indices to evaluate the nutritional value of fish oil. Among the three methods tested, dilute alkali hydrolysis yielded the highest UFA content (66.31%) in fish oil, followed by that obtained from enzymatic hydrolysis (64.21%). Particularly pronounced was this difference in yield of MUFAs, as the highest amount was obtained from diluted alkaline hydrolysis (39.10%), whereas enzymatic hydrolysis and the microwave-assisted method resulted in a comparable lower MUFA content. Furthermore, the highest content of (DHA+ EPA) was obtained by dilute alkali hydrolysis (2.30%). This may be because enzymatic extraction of fish oil requires high temperature to eliminate enzymes, and microwave assisted extraction process will generate heat during the process. As higher temperature leads to the destruction of UFAs, both these processes might result in oil with a lower UFA content. Therefore, different extraction methods have significant effects on the content and composition of FAs in tilapia fish oil. When compared with the fish oil extracted using other methods, the nutritional value of tilapia fish oil extracted by dilute alkali hydrolysis is better.
Crystallization and melting behavior of tilapia fish oil
DSC was used to determine the quality characteristics of tilapia oil. This method has many advantages, including direct determination of the energy change of physical or chemical changes related to crystallization and melting.[Citation31] It also provides effective information that can be used to monitor lipids structure and predict the effect of oil and fat in lipids composition on crystallization behavior.[Citation32–Citation34] Thus, the DSC crystallization curve and melting curve can be used to evaluate the degree of oil deterioration in a fast and direct manner.[Citation35] The physical properties of oil are mainly determined by the composition, structure, and composition of lipids.
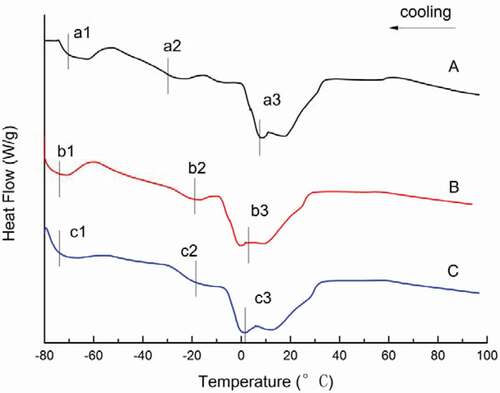
The thermal curves for fish oil extracted by different methods are given in and for different heating and cooling rates, respectively. The corresponding transition temperatures are given in the Figs ( and ). In the DSC melting curves from the heating rate studies, the melting curves for dilute alkali hydrolysis and enzymatic hydrolysis consisted of two peaks, whereas that of the microwave-assisted method consisted of only one peak (). The two endothermic peaks found in samples extracted by dilute alkali hydrolysis and enzymatic hydrolysis may have originated from the presence of different amounts of lipids as compared to the microwave-assisted method.[Citation23,Citation36] In the oil samples, one major melting peak was found as a single, wide endothermic peak, shown at A2 (–2.03°C), B2 (–3.20°C), and C1 (–4.37°C). The endothermic peaks (A1, B1) present at about −38°C may be the unstable melting peaks of amorphous lipids and the more stable melting peaks of crystals. They may be due to a rearrangement of the polymer crystal structure of lipids. shows that all crystallization curves have three exothermic peaks. In the cooling profile, the oil extracted by dilute alkali hydrolysis crystallized at –73.41°C, –34.51°C, and 3.26°C; the oil extracted by enzymatic hydrolysis crystallized at –74.46°C, –17.98°C, and 3.33°C; and the oil extracted by the microwave-assisted method crystallized at –74.79°C, –18.96°C, and 2.18°C. According to Tan[Citation36,Citation37], finding multiple peaks on fat melting behavior by DSC are normal, but there are two main reasons for this phenomenon. One is related to the lipids composition as different chemical compositions result in different melting points and thus, crystallization occurs at different temperatures and multiple melting peaks can be observed. The other reason is due to the recrystallization phenomenon. There are three types of lipids crystal structures: α, β and β’. The α crystal has the lowest melting point and easy filtration. The β type crystal is the most stable, has the highest melting point, coarse grain, and is easy to filter. The DSC crystallization curve of fish oil has three main crystallization exothermic peaks between –80°C and –58°C, –58°C and –10°C, –10°C and 10°C, which fall within the thermal transition region of the α, β, and β’ crystals. In addition, the presence of a small shoulder peak (, peak a2, b2, and c2) may be ascribed to the crystallization of lipids with a combination of FAs in the glycerol moiety, as previously reported.[Citation36]
Table 4. Comparison of DSC transition temperatures for melting and crystallization curves of fish oil samples.
Figure 1. DSC melting curves of tilapia fish oil.
(A: Diluted alkaline hydrolysis; B: Enzymatic hydrolysis; C: Microwave-assisted method)
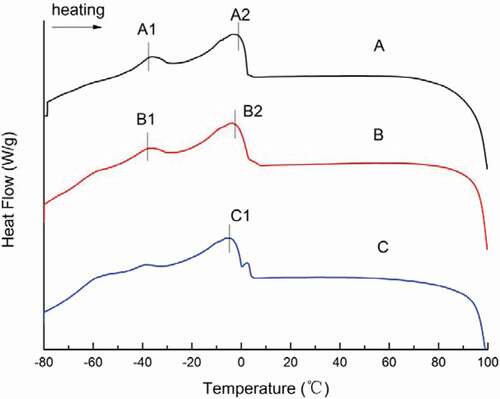
Figure 2. DSC crystallization curves of tilapia fish oil.
(A: Diluted alkaline hydrolysis; B: Enzymatic hydrolysis; C: Microwave-assisted method)
Spectroscopic characterization
The spectroscopic behavior of the oils obtained by the different extraction methods in the infrared region is shown in . The results of the spectroscopic profiles show that the extraction methods did not interfere with the infrared absorbance characteristics of fish oil. Each fish oil sample contained abundant oleic acid, linoleic acid, and other unsaturated fatty acids. The main functional groups and structures were identified as methyl, methylene, carbonyl, and ester groups. Twelve characteristic peaks were displayed in the spectrum, including sharp-pointed and high peaks around the band range of 2925 cm–1 and 1745 cm–1. Further, five medium intensity peaks were observed with band ranges of about 3460 cm–1, 2855 cm–1, 1455 cm–1, 1161 cm–1, and 721 cm–1. Other peaks were shown with low signal. Another signal appeared between 2700 cm–1 and 3650 cm–1, which suggests that the fish oil had moisture, alcohols, or primary products of oxidation.
Figure 3. Infrared spectra of tilapia fish oil samples from three extraction methods.
(A: Diluted alkaline hydrolysis; B: Enzymatic hydrolysis; C: Microwave-assisted method)
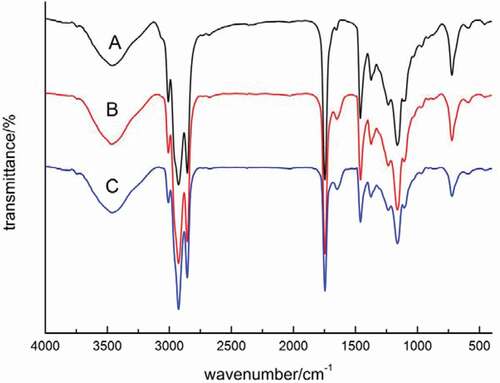
The wide bands at 2925 cm–1, 2855 cm–1, 1455 cm–1,1235 cm–1, and 721 cm–1 are characteristic of methylene (—CH2) and have symmetric, antisymmetric, shear, bending, and rocking vibration, respectively. For compounds having — (CH2) n—, the signal at 721 cm–1 indicates a chain of n > 4. Further, the band range of about 1745 cm–1 to 1161 cm–1 is characteristic of functional esters (—C = 0).
The comparison of the infrared spectral profile of the oils and their possible changes are shown in . The results showed no changes in the position of the infrared bands and the strength of the signals obtained by the three different extraction methods, indicating that the extraction methods do not affect the behavior of bands characteristic of long chain FAs and functional esters in tilapia oil.[Citation15]
Conclusion
Tilapia fish oil plays a significant role in health care and can be produced as a value-added product. Effects of the three extraction methods (dilute alkali hydrolysis, enzymatic hydrolysis, and microwave-assisted methods) on the chemical composition and thermal properties of the fish oil obtained are reported in this paper. By comparing the characteristics of the fish oil extracted using the three methods, it was found that the physicochemical indices (AV and POV) of the oil extracted by dilute alkali hydrolysis were significantly lower than those obtained using enzymatic hydrolysis and microwave-assisted methods. Furthermore, the color and odor of fish oil were more acceptable for the extract obtained by dilute alkali hydrolysis than that obtained using the other methods. Some characteristics such as PUFAs contents, crystallization and melting behaviors of the oils obtained by different methods are significantly different depending on the conditions used. Although the infrared spectroscopic profile of the oil samples indicated that the extraction methods have no effect on the behavior of bands characteristic of long chain FAs and saturated esters in fish oil. Therefore, different extraction methods significantly affect the physical and chemical properties of the oil samples without affecting its spectral characteristics. Furthermore, the quality of fish oil extracted by dilute alkali hydrolysis is relatively good and this extraction method has great potential for industrial production.
Additional information
Funding
References
- Yildirimaksoy, M.; Lim, C.; Davis, D. A.; Shelby, R.; Klesius, P. H. Influence of Dietary Lipid Sources on the Growth Performance, Immune Response and Resistance of Nile Tilapia, Oreochromis Niloticus, to Streptococcus Iniae Challenge. Journal of Applied Aquaculture 2007, 19(2), 29–49. DOI: 10.1300/J028v19n02_02.
- Ng, W. K.; Romano, N. A. Review of the Nutrition and Feeding Management of Farmed Tilapia Throughout the Culture Cycle. Reviews in Aquaculture 2013, 5(4), 220–254. DOI: 10.1111/raq.12014.
- Afm. E.S.Alternative Dietary Protein Sources for Farmed Tilapia, Oreochromis Spp. Aquaculture (Amsterdam, Netherlands). 1999, 179(1–4), 149–168. doi:10.1016/S0044-8486(99)00159-3.
- Saroat, R.; Samart, S. U.; Saisunee, K.; Manat, C.; Soottawat, B. Biochemical and Gelling Properties of Tilapia Surimi and Protein Recovered Using an Acid-Alkaline Process. Food Chemistry 2009, 112(1), 112–119. DOI: 10.1016/j.foodchem.2008.05.047.
- Gupta, M. V.; Acosta, B. O. A Review of Global Tilapia Farming Practices. Aquaculture Asia 2004, 10(1), 7-12, 16.
- Arruda, B. D.; Ferraz, L. Utilization of Fish Waste from the Processing of Nile Tilapia (Oreochromis Niloticus) to Obtain Fish Silage and Fish Oil as By-Products. Beitrge Zur Pathologie 1977, 161, 4, 363–375.
- Shahidi, F.; Shahidi, F. Maximising the Value of Marine By-Products, Woodhead Pubishing Limited. 2007; Vols. i–iii.
- Sahena, F.; Ism, Z.; Jinap, S.; Yazid, A. M.; Khatib, A.; Nan, N. Fatty Acid Compositions of Fish Oil Extracted from Different Parts of Indian Mackerel (Rastrelliger Kanagurta) Using Various Techniques of Supercritical CO2 Extraction. Food Chemistry 2010, 120(3), 879–885. DOI: 10.1016/j.foodchem.2009.10.055.
- Chow, C. K.; Fatty Acids in Foods and Their Health Implications. Food Science & Technology 2008, 38, 10, 6–10.
- Das, U. N.; Estrogen, Statins, and Polyunsaturated Fatty Acids: Similarities in Their Actions and Benefits-Is There a Common Link? Nutrition (Burbank, Los Angeles County, Calif.) 2002, 18, 2, 178–188.
- Bucher, H. C.; Hengstler, P.; Schindler, C. Meier, G. N-3 Polyunsaturated Fatty Acids in Coronary Heart Disease: A Meta-Analysis of Randomized Controlled trials.American. Journal of Medicine 2002, 112(4), 298–304. DOI: 10.1016/S0002-9343(01)01114-7.
- Hu, F.B.; Bronner, L.; Willett, W.C.; Stampfer, M.J.; Rexrode, K.M.; Albert, C.M.; Hunter, D.; Manson, J.E. Fish and Omega-3 Fatty Acid Intake and Risk of Coronary Heart Disease in Women. Journal of the American Medical Association 2002, 287(14), 1815–1821.
- Rubio-Rodríguez, N.; Diego, S. M. D.; Beltrán, S.; Jaime, I.; Sanz, M. T.; Rovira, J. Supercritical Fluid Extraction of Fish Oil from Fish By-Products: A Comparison with Other Extraction Methods. Journal of Food Engineering 2012, 109(2), 238–248. DOI: 10.1016/j.jfoodeng.2011.10.011.
- Khattab, R. Y.; Zeitoun, M. A.Quality Evaluation of Flaxseed Oil Obtained by Different Extraction Techniques. LWT - Food Science and Technology 2013, 53(1), 338–345. DOI: 10.1016/j.lwt.2013.01.004.
- Santos, O. V.; Corrêa, N. C. F.; Soares, F. A. S. M.; Gioielli, L. A.; Costa, C. E. F.; Lannes, S. C. S. Chemical Evaluation and Thermal Behavior of Brazil Nut Oil Obtained by Different Extraction Processes. Food Research International 2012, 47(2), 253–258. DOI: 10.1016/j.foodres.2011.06.038.
- Pizarro, M. L.; Becerra, M.; Sayago, A.; Beltrán, M.; Beltrán, R. Comparison of Different Extraction Methods to Determine Phenolic Compounds in Virgin Olive Oil. Food Analytical Methods 2013, 6(1), 123–132. DOI: 10.1007/s12161-012-9420-8.
- Khoddami, A.; Ghazali, H. M.; Yassoralipour, A.; Ramakrishnan, Y; Ganjloo, A. Physicochemical Characteristics of Nigella Seed (Nigella Sativa L.) Oil as Affected by Different Extraction Methods. Journal of the American Oil Chemists’ Society 2011, 88(4), 533–540. DOI: 10.1007/s11746-010-1687-6.
- Vichi, S.; Guadayol, J. M.; Caixach, J.; Lópeztamame, E. S.; Buxaderas, S. Comparative Study of Different Extraction Techniques for the Analysis of Virgin Olive Oil Aroma. Food Chemistry 2007, 105(3), 1171–1178. DOI: 10.1016/j.foodchem.2007.02.018.
- AOCS. Official Methods and Recommended Practices of the American Oil Chemists’ Society Method Cd 8-53. In Peroxide Value Acetic Acid-Chloroform Method; 4th ed.; American Oil Chemists' Society. 1993.
- AOCS. Official Methods and Recommended Practices of the American Oil Chemists’ Society Method Cd 3d-63; In Acid Value of Fats and Oils Cyclohexane-Acetic Acid Method; American Oil Chemists' Society. 1993.
- Cao, J.; Li, H.; Xia, X.; Zou, X. G.; Li, J.; Zhu, X. M.; Deng, Z.Y. Effect of Fatty Acid and Tocopherol on Oxidative Stability of Vegetable Oils with Limited Air. International Journal of Food Properties 2015, 18(4), 808–820.
- Lei, L.; Li, J.; Luo, T.; Fan, Y. W.; Zhang, B.; Ye, J.; Ye, H.; Sun, Y.; Deng, Z.Y. Predictable Effects of Dietary Lipid Sources on the Fatty Acids Compositions of Four 1-Year-Old Wild Freshwater Fish from Poyang Lake. Journal of Agricultural & Food Chemistry 2013, 61(1), 210.
- Hongkwong, L.; Tan, C. P.; Karim, R.; Ariffin, A. A.; Bakar, J. Chemical Composition and DSC Thermal Properties of Two Species of Hylocereus Cacti Seed Oil: Hylocereus Undatus and Hylocereus Polyrhizus. Food Chemistry 2010, 119(4), 1326–1331. DOI: 10.1016/j.foodchem.2009.09.002.
- Tan, C. P.; Che, M. Y. Differential Scanning Calorimetric Analysis for Monitoring the Oxidation of Heated Oils. Food Chemistry 1999, 67(2), 177–184. DOI: 10.1016/S0308-8146(99)00115-6.
- Cao, J.; Deng, L.; Zhu, X. M.; Fan, Y.; Hu, J. N.; Li, J.; Deng,Z.Y. Approach to Evaluate the Oxidation State of Vegetable Oils Using Characteristic Oxidation Indicators. Journal of Agricultural & Food Chemistry 2014, 62(52), 12545–12552.
- Arab-Tehrany, E.; Jacquot, M.; Gaiani, C.; Imran, M.; Desobry, S.; Linder, M. Beneficial Effects and Oxidative Stability of Omega-3 Long-Chain Polyunsaturated Fatty Acids. Trends in Food Science & Technology 2012, 25(1), 24–33. DOI: 10.1016/j.tifs.2011.12.002.
- Chen,C.Y.; Sun,B.L.; Li,X.X.; Li,P.Y.; Guan,W.T.; Bi,Y.Z.; Pan,Q. N-3 essential fatty acids in Nile tilapia, Oreochromis niloticus: Quantification of optimum requirement of dietary linolenic acid in juvenile fish. Aquaculture 2013,416-417(2), 99-104.
- Alsouti, A.; Alsabahi, J.; Soussi, B.; Goddard, S. The Effects of Fish Oil-Enriched Diets on Growth, Feed Conversion and Fatty Acid Content of Red Hybrid Tilapia. Oreochromis sp.Food Chemistry 2012, 133(3), 723–727. DOI: 10.1016/j.foodchem.2012.01.080.
- Abergel, A.; Sapin, V.; Dif, N.; Chassard, C.; Darcha, C.; Marcand,S.J.; Gaillard,M.B.; Rock,E.; Dechelotte,P.; Sauvant,P. Growth Arrest and Decrease of α-SMA and Type I Collagen Expression by Palmitic Acid in the Rat Hepatic Stellate Cell Line PAV-1. Digestive Diseases and Sciences 2006, 51(5), 986–995.
- Neuringer, M.;. Infant Vision and Retinal Function in Studies of Dietary Long-Chain Polyunsaturated Fatty Acids: Methods, Results, and Implications. American Journal of Clinical Nutrition 2000, 71(1 Suppl), 256–266. DOI: 10.1093/ajcn/71.1.256S.
- Mchugh, J.; Fideu, P.; Herrmann, A.; Stark, W. Determination and Review of Specific Heat Capacity Measurements during Isothermal Cure of an Epoxy Using TM-DSC and Standard DSC Techniques. Polymer Testing 2010, 29(6), 759–765. DOI: 10.1016/j.polymertesting.2010.04.004.
- Sessa, D. J.; Nelsen, T. C.; Kleiman, R.; Arquette, J. D. Differential Scanning Calorimetry Index for Estimating Level of Saturation in Transesterified Wax Esters. Journal of the American Oil Chemists’ Society 1996, 73(2), 271–273. DOI: 10.1007/BF02523909.
- Nascimento, A. C.; Tecelão, C. S. R.; Gusmão, J. H.; Fonseca, M. M. R. D.; Ferreira-Dias, S. Modelling Lipase-Catalysed Transesterification of Fats Containing N −3 Fatty Acids Monitored by Their Solid Fat Content. European Journal of Lipid Science & Technology 2004, 106(9), 599–612. DOI: 10.1002/ejlt.200401000.
- Katsuki, K.; Miyagawa, Y.; Nakagawa, K.; Adachi, S. Liquid-Solid Phase Equilibria and the Frozen Ratio of Ternary Aqueous Solution of Acetic Acid and Sodium Chloride. International Journal of Food Properties 2017, 20(S2), S1848–S1855.
- Noorzyanna, Y.; Marikkar, N.; Mustafa, S.; Sahri, M. M. Composition and Thermal Analysis of Ternary Mixtures of Avocado Fat: Palmstearin: Cocoabutter (Avo: PS:CB). International Journal of Food Properties 2017, 20(2), 465–474. DOI: 10.1080/10942912.2016.1166130.
- Tan, C. P.; Che, M. Y. Differential Scanning Calorimetric Analysis of Edible Oils: Comparison of Thermal Properties and Chemical Composition. Journal of the American Oil Chemists’ Society 2000, 77(2), 143–155. DOI: 10.1007/s11746-000-0024-6.
- Tan, C. P.; Man, Y. B. C. Differential Scanning Calorimetric Analysis of Palm Oil, Palm Oil Based Products and Coconut Oil: Effects of Scanning Rate Variation. Food Chemistry 2002, 76(1), 89–102. DOI: 10.1016/S0308-8146(01)00241-2.