
 ?Mathematical formulae have been encoded as MathML and are displayed in this HTML version using MathJax in order to improve their display. Uncheck the box to turn MathJax off. This feature requires Javascript. Click on a formula to zoom.
ABSTRACT
In this paper, a model for controlling paddy drying by incorporating accumulated temperature is introduced and defined. Drying experiments using freshly harvested paddy were conducted at different levels of drying air parameters including temperature (T = 27°C, 31°C, 35°C, 39°C, and 43°C), relative humidity (RH = 45%, 50%, 55%, 60%, and 65%), initial moisture content (M0 = 17%, 19%, 21%, 23%, and 25%) and airspeed (V = 0.4, 0.5, 0.6, 0.7, and 0.8 m s−1). When T = 31°C, RH = 60%, M0 = 19%, and V = 0.5 ms−1, the crack additional percentage reached a minimum value of 0.508%, with the average precipitation rate at 0.719%·h. Further, an accumulated temperature and quality chart was provided in this paper. The x-coordinate of this chart is temperature, and the initial moisture content represents the y-coordinate. It covers the drying conditions of the actual dryer well and has a wide range of applicability for real-world environment. The model developed in this study not only provides a scientific reference for precise drying and intelligent control of paddy but also guide the actual drying operation.
Introduction
Paddy, the world’s third-most productive agricultural crop after corn and sugarcane, is one of the most important grains in terms of human nutrition and caloric intake, accounting for more than 20% of the world’s food energy consumption. [Citation1] With the progress of science and technology and the enrichment of drying theory, various drying methods and dryers have been developed [Citation2–Citation4], such as the horizontal rotary dryer [Citation5], the industrial fluidized bed drying of paddy [Citation6], and the industrial inclined bed dryer. [Citation7] Hot air is a commonly used drying medium for all those technologies introduced. In that development and studies, the optimizing control of the hot air used as the drying medium for the targeted grain is an important area of study to develop an effective model for the best drying conditions. This study will improve the drying model by incorporating accumulated temperature to improve the accuracy in a more systematic manner.
Paddy drying is a normal process of heat and mass transfer. The drying process and quality changes can be systematically simulated via the establishment of a comprehensive differential equation [Citation8–Citation11] . In practice, the design and automatic control of grain-drying equipment often involve an empirical thin-layer drying model.[Citation12,Citation13] Shei and Chen [Citation10] established and validated a thin-layer drying model by integrating the partial differential equation model and the Page model.[Citation14] They compared the data from their experiments with the results from computer simulations and found that they were consistent. Their model contains four independent variables: drying medium temperature, absolute humidity, drying time and tempering time. Their study concluded that all four variables have an impact on the average drying rate of the paddy. Kucuk, et al. [Citation15] evaluated the accuracy of fitting the experimental data for a large number of thin-layer drying models, and developed the Midilli–Kucuk model, which is the best for fitting experimental data. They showed that the temperature, relative humidity, and flow velocity of the drying medium, affect the drying process, indicating that these drying parameters must be used as experimental factors during thin-layer drying experiments. Using these drying parameters helps to ensure that the model can be more accurate and practical. Foroughi-Dahr, et al.[Citation16] added the tempering process to the thin-layer drying model and tested the accuracy of experimental fitting for all kinds of thin-layer drying models. Finally, the Midilli model [Citation17] was found to be the most suitable for fitting the drying process before tempering, and the two-term model was found to be the most suitable for fitting the drying process after tempering.
Improper drying rates and certain factors can lead to the formation of cracks in paddy grain, also known as “burst waist,” which reduces the quality and taste of paddy. The wet stress and thermal stress caused by drying rate, temperature gradient, and moisture gradient are the causes of these cracks.[Citation18] “Burst waist” during milling is a critical problem in the paddy industry that leads to poor market value and quality downgrade of the cooked broken paddy in comparison with the cooked whole grain paddy. The cracking of paddy is strongly related to the final moisture content of paddy as well as developed fissures in the kernels during harvesting and drying operations. Therefore, improving the drying process is an essential step to producing grains with higher quality.[Citation1] Ondier, et al.[Citation19] studied the changes in the quality of head paddy rate, color, and pasting viscosity, finding that low temperature drying at 26°C had no adverse effect on the drying rate and could improve the drying quality. Thus, it can be shown from previous studies that the main factors affecting the crack in the drying process include temperature, relative humidity, and air velocity. This provides a useful reference as a starting point for our study.
Accumulated temperature is a necessary index for crop growth. The theory of accumulated temperature was first proposed by A.F. Aolaier–Delie in 1735. [Citation20] He believed that, even if the experienced growth hours are different, when the plant develops to a certain stage, its required temperature is relatively consistent. Thus, the accumulated temperature can accurately reflect the maturity of crops. Dong, et al. [Citation21] showed, with a series of studies on accumulated temperature that the change in accumulated temperature has great influence on crop growth, cropping systems, agricultural production, and land use. Through the calculation of accumulated temperature, the growth of corn can be better controlled.[Citation22] Qin, et al.[Citation23] showed that the accumulated temperature is the key factor to increase the yield of corn, and the yield can be further improved by using other means when the accumulated temperature is sufficient. Wu et al. [Citation24] mentioned the application of accumulated temperature in the process of controlling corn drying, and proposed the accumulation temperature model of corn drying, which provided a useful reference for this study. The accumulated temperature theory was also used to study the production and viability of peanut pollen by some experts.[Citation25] Previous studies fully demonstrated that the temperature, especially the accumulated temperature, plays an important role in ensuring seed germination [Citation26–Citation28], vegetation growth and distribution [Citation29], higher crop yield [Citation30,Citation31], and pest reduction. [Citation32,Citation33] Similarly, we believe that accumulated temperature has a similar effect on grain growth for the drying of paddy because the accumulated temperature required for the grain to fall into safe moisture thresholds under certain drying conditions is relatively stable. To the best of our knowledge, the study presented in this paper is the first to use the amount of accumulated temperature to reflect the drying process in a model. This will improve the accuracies of the model.
Based on previous studies carried out by other researchers reviewed earlier, we were able to obtain relatively reliable models of grain drying on a trial scale. However, in the actual drying process of paddy, there are many factors that affect the drying, and they have different ranges (such as the paddy temperature range is about 30–45ºC [Citation34]). Through this study, we hope that the results can reflect the situation as close as possible to the actual production conditions. In this study, the concept of equivalent accumulated temperature is also introduced into the model, which is a first in this domain. Finally, based on the established model, the accumulated temperature and paddy quality chart was provided. The generated chart provides an overall drying condition to be modeled, which can be translated easily. Further, this chart can provide useful reference for scientific research in the field by incorporating the effect of accumulated temperature, and it can also be used to guide the actual drying operations with high accuracy under real-world conditions.
Materials and methods
Test equipment
The thin-layer drying testbed used in this test was independently developed and has obtained an invention patent right.[Citation35] The structure of the test device is shown in and . It is manufactured by Changchun JLU science instrument equipment Co. Ltd.
Figure 1. Structure diagram of the grain thin-layer drying test device with multi-parameter regulating function: 1. wind shunt; 2. axial flow fan; 3. material bin door; 4. material tray; 5. sensor bin; 6. electric sealing valve; 7. heating pipe; 8. inner tank; 9. wet exhaust fan; 10. test-bed shell; 11. sensor group; and 12. humidifier
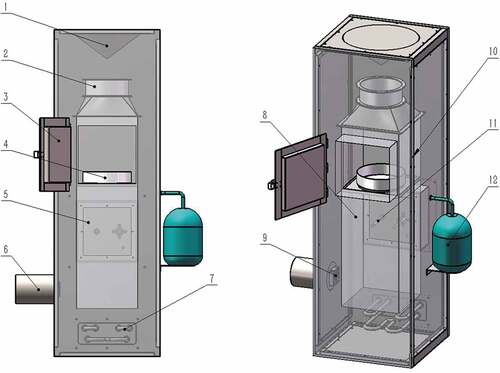
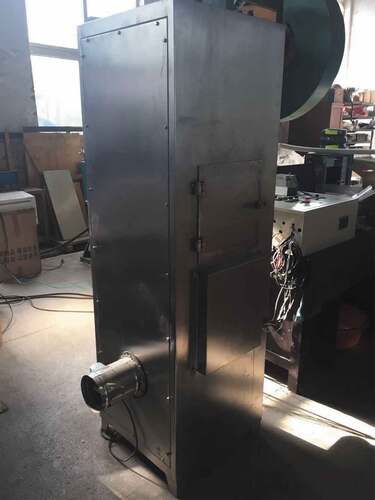
Figure 2. The grain thin-layer drying test device picture
The thin layer drying testbed used in this experiment has precisely controlled relative humidity. The relative humidity control accuracy of this testbed is ±2% (this accuracy is relatively high compared to similar studies [Citation36,Citation37]). The machine is 1700 mm high and the transverse section is a square with side length of 550 mm. The testbed has two inner and outer layers, which is the test-bed shell (, 10) and inner tank (, 8) respectively. Above the inner bladder, a 50-W axial fan (, 2) is installed, with the wind direction flowing up. An electronic balance with an accuracy of 0.01 is installed in the drying bin for weighing grain automatically. The heating pipe (, 7) is arranged at the bottom of the shell under the inner tank. The purpose of this design is to ensure that the hot air flows upward naturally to combine with the axial fan above the inner tank, which can better drive the inner circulation of the drying medium in the whole device. The humidifier (, 12) is arranged outside the shell, supported by the support plate and connected with the testbed through a silica gel hose. The sensor bin (, 5) is located above the heating pipe and closer to the material bin to measure temperature, relative humidity, and airflow velocity in the bin. The measured data are transmitted to the upper computer, and used to control the switch of the heating pipe and the fan inverter, thereby controlling temperature and airflow velocity. The sensor bin includes one RST-JWSH-5 temperature and humidity sensor (Rotronic), and one JC503-CIV100 anemometer, one PT100 each. The material bin is above the sensor bin. When the test bed is running, the heating pipe heats the air and passes through the grain layer (, 4) from the bottom. After the heat exchange, the hot air is pumped to the top of the shell by an axial fan. Then, the hot air is divided between the shell and the inner tank, using a diverter, which is fully mixed with the water added by the humidifier at the bottom of the device. After crossing the heating pipe again and finally arriving into the inner tank, where the internal cycle is complete. If the humidity inside the shell exceeds the pre-set amount, the wet exhaust fan (, 9) and the electric sealing valve (, 6) can be opened automatically. When the relative humidity detected by the humidity sensor is lower than the pre-set amount, the exhaust fan is stopped, and the electric sealing valve is closed. This controls the relative humidity inside the shell. The internal cycle has the function of tail-gas recycling, which can effectively save energy and prevent moisture loss in the device.
Test materials and methods
The experiment was started in October 2016 to coincide with the harvest season in northeast China with a total of 36 groups of trials. In order to avoid the influence of different paddy varieties on the test results, we only selected a paddy grain named “Super Rice” for the test. To ensure the initial moisture and quality of the test grain, the freshly harvested paddy was vacuum packed and sealed. The mass of each bag was approximately 1,500 g. Then, it was placed in a cold box with an ambient temperature of 4°C to prepare for the test.
Before the experiment began, we measured the original moisture content of the paddy by the Standard moisture measurement method.[Citation38] We started the test device after various factors were set up in the host computer. When the value of each factor reached the desired value and stable, a 1,000-g paddy was put into the material bin to start the test. During the test, the sample was weighed every 15-min with the objective of obtaining enough points to draw the drying curve of the rice and prepare for analysis of the data. After the data were uploaded to the upper computer, the fan was restarted. In the upper computer program, a weighing method was embedded to measure the food moisture, as in EquationEquation (1)(1)
(1) . When the moisture content was close to 13.5%, 70 g of the sample was placed inside a sealed bag in preparation for quality testing.
The moisture content of the paddy wet basis at different drying times, Mt, was calculated according to EquationEquation (1)(1)
(1) .[Citation39,Citation40]
where mst is the quality of moisture contained in paddy at time t/g; mt is the peel quality (material plate) of paddy at time t/g; m0 is the initial quality of paddy/g; and M0 is the initial wet-base moisture content of paddy/%; Mt is the moisture content of the paddy wet-basis at different drying times/%.
The software used for the data analysis in this experiment was “Design Expert (V8.0.6.1),” a professional test program design and data processing software. The establishment of an orthogonal experimental scheme needs to encode the actual value of each control factor, and the interaction term of each control factor and the square term of each control factor need to be coded. This makes each factor column, interaction column and square column independent and facilitates the analysis of test data in the later stage. The process is handled by the software. After each group of tests were carried out according to the test scheme, the corresponding regression model and the corresponding ANOVA table were obtained by inputting the test results into the software. From the ANOVA table, the significance of the regression equation, the significance of each factor, and the inaccuracy of the equation were obtained.
Test design and method
Test scheme
In this test, a multiple quadratic orthogonal rotation test method was used to establish a four-factor five-level orthogonal test table. As shown in , four control factors were set: drying medium temperature, X1; drying medium relative humidity, X2; grain initial moisture, X3; and drying medium flow rate, X4.
Table 1. Orthogonal test table of four factors and five levels
The effect of the temperature of the dry medium on the additional crack percentage can be found in previous studies.[Citation1,Citation12,Citation18] The temperature range is determined per GB/T21015-2007, “Technical specification for paddy drying.” This national standard states that the allowable heating temperature of paddy during drying is ≤40°C. If the paddy-drying temperature is more than 45°C, the paddy starch becomes disordered, free fatty acids increase, and the aging degree of paddy is increased, leading to deterioration of the paddy taste. Therefore, the drying temperature should not be higher than 45°C. [Citation34] Based on the relative humidity collected in several circulation paddy dryers, the relative humidity range in was 40–65%. The effect of initial moisture on output is studied because the drying curves of grains with different moisture content differ under the same drying conditions.[Citation16,Citation41] The initial moisture content of the paddy interval selected in this study covered the water content of the treated object of the actual dryer. Air flow velocities were collected in several circulating paddy dryers.
Output index and test method
The crack additional percentage is the difference between the crack percentage after drying and the initial crack percentage.[Citation42] Before the test, 300 undried grains of sample was peeled and placed in a crack lamp for observation. Then, the number of cracks were recorded to calculate the initial crack percentage. After the drying process was completed, 300 dried grains of the sample with moisture content of 13.5% were taken, and the above work was repeated to obtain the crack percentage of safe moisture content samples. Finally, the crack additional percentage, Y1, was calculated.
The accumulated temperature is the total effective temperature of paddy during the entire drying process. The start point of effective temperature is the 0°C-phase transition temperature of water. The significance of studying the accumulated temperature of cereals lies in realizing the accurate online control of paddy moisture and quality. The product of drying medium temperature and drying time is the accumulated temperature value, Y2.
Results and discussion
The statistical results are presented in which shows the calculated crack percentage and the accumulated temperature for each group of paddy samples considering the following parameters: drying medium temperature, drying medium relative humidity, grain initial moisture, and drying medium flow rate; the description of each parameter can be found in . In each experiment, an average of 6 h was spend on measurements, which were collected over 20 days.
Table 2. Experimental statistical results
Crack additional percentage test and results
Quadratic polynomial regression model and response surface test
To take the crack additional percentage of paddy as output, Y1, multivariate quadratic regression analysis was performed using the Design Expert software, and the variance analysis of the influence of various factors on the crack additional percentage of paddy was obtained, as shown in .
Table 3. Influence of various factors on the crack additional percentage of paddy
The F value of the model is 336.53, and the overall significant level is less than 0.0001, the R2 value of the models is 0.9951, indicating extreme significance. When significant level is 0.05, the P values of ,
,
,
,
,
, and
are less than 0.05, indicating they have a significant effect on the crack additional percentage. The rest of the terms are not significant. Therefore, the terms giving P value more than 0.05 are eliminated and plugged into EquationEquation (2)
(2)
(2) .
Influence of various factors on crack additional percentage
shows that, within the scope of the test scheme, the crack additional percentage is positively correlated with the drying medium temperature. It is negatively correlated with the drying medium humidity and is positively correlated with the initial moisture of paddy. Finally, it is positively correlated with the drying media flow rate. When the drying medium temperature exceeds 35°C, the crack additional percentage increases sharply.
Figure 3. Response surface diagram of the influence of each control factor on the crack additional percentage. (a) Response surface diagram of the influence of X1 and X2 on the crack additional percentage. (b) Response surface diagram of the influence of X1 and X3 on the crack additional percentage. (c) Response surface diagram of the influence of X1 and X4 on the crack additional percentage. (d) Response surface diagram of the influence of X2 and X3 on the crack additional percentage. (e) Response surface diagram of the influence of X2 and X4 on the crack additional percentage. Response surface diagram of the influence of X3 and X4 on the crack additional percentage
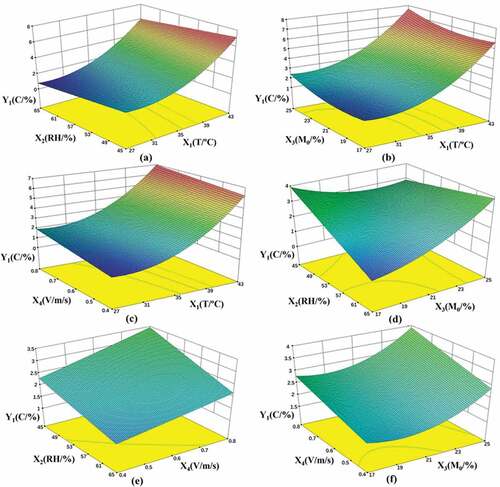
In ), when the initial moisture content of paddy is 19%, the crack additional percentage has a valley value of 1.2311%. Then, with the decrease of the initial moisture of paddy, the growth rate of paddy popping increases. This phenomenon is shown in ). This phenomenon occurs when the initial moisture of paddy is high. The moisture inside the paddy more easily precipitates and the temperature stress inside the paddy is smaller. When the initial moisture of paddy is low, the internal moisture of paddy is relatively difficult to precipitate, resulting in rice that needs to absorb more energy when the drying begins. Thus, the internal temperature stress of paddy increases, so that the crack additional percentage also shows a rising trend. [Citation43]
In ), when the initial moisture content of paddy is relatively low, the crack additional percentage negatively correlates with the relative humidity of the drying medium. When the initial moisture content of paddy is relatively high, the opposite occurs, because there is a positive correlation between the initial moisture of paddy and the crack additional percentage. Thus, the initial moisture of the paddy has a more significant effect on the crack additional percentage.
Verification
To ensure the accuracy of the regression equation, three groups of validation tests were carried out. The values of each factor are listed in , including the experimental values, the simulated values of the regression equation, and the relative errors. It can be seen in that the relative error of at least two experiments in the three validation tests of each test group was less than 5%, indicating that the regression equation could be used to describe the relationship between the four factors and the crack additional percentage. Thus, the model is reliable and can be applied in practice.
Table 4. Relative error table of the regression equation of the crack additional percentage of paddy
Parameter optimization
The process parameters were optimized by using the Design Expert software. Based on the analysis results of the response surface, we took the minimum crack percentage as the performance index, showing that the crack additional percentage could reach its lowest value of 1.090% when the drying medium temperature was 31.2°C. The relative humidity of the drying medium was about 62.5%, the initial moisture of paddy was 20%, and the airflow velocity was 0.5 ms−1. The average precipitation rate was 0.796%/h in this condition.
Accumulated temperature test and results
Model of quadratic polynomial regression and the test results of response surface
Taking accumulated temperature of paddy as the output, Y2, the multivariate quadratic regression analysis was performed using Design Expert software (V8.0.6.1), and the variance analysis of the influence of various factors on the accumulated temperature of paddy was obtained, as shown in .
Table 5. Influence of various factors on the accumulated temperature of paddy
The F value of the model was 38.36, and the overall significant level was less than 0.0001. The R2 values of the models were 0.9552. Thus, the model was extremely significant. When the significant level was 0.05, the P values of ,
,
,
,
and
were less than 0.05, indicating that they had a significant effect on the crack additional percentage. The rest of the terms were insignificant. Therefore, the terms producing P values more than 0.05 were eliminated, as plugged into EquationEquationEquation(3)
(3)
(3)
(3)
(3) .
Analysis of the influence of various factors on drying accumulated temperature of paddy
From , which shows the scope of the test scheme, it can be seen that the drying accumulated temperature of paddy negatively correlates with the drying medium temperature. It positively correlates with the drying medium humidity, positively correlates with the initial moisture of paddy, and negatively correlates with the drying media flow rate.
Figure 4. Response surface diagram of the influence of each control factor on the accumulated temperature. (a) Response surface diagram of the influence of X1 and X2 on the accumulated temperature. (b) Response surface diagram of the influence of X1 and X3 on the accumulated temperature. (c) Response surface diagram of the influence of X1 and X4 on the accumulated temperature. (d) Response surface diagram of the influence of X2 and X3 on the accumulated temperature. (e) Response surface diagram of the influence of X2 and X4 on the accumulated temperature. (f) Response surface diagram of the influence of X3 and X4 on the accumulated temperature
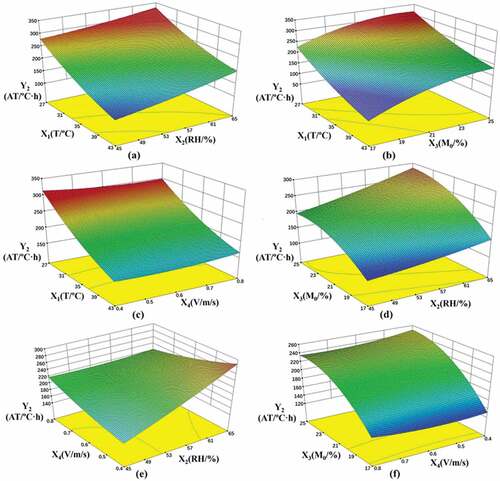
In ), when the drying medium temperature is constant, with the increase in the initial moisture of the paddy, the drying accumulated temperature of paddy gradually increases. When the initial moisture of paddy rice is certain, the drying accumulated temperature of paddy increases faster with the decrease in the drying medium temperature.
In ), when the initial moisture content of paddy is low, the change in the relative humidity of the drying medium has no significant effect on the drying accumulated temperature of paddy. With the increase in initial moisture, the drying accumulated temperature of paddy gradually decreases, and the effect of the relative humidity of the drying medium on the drying accumulated temperature of paddy increases.
In ), when the drying medium flow rate is high, the relative humidity of the drying medium does not have a significant effect on the drying accumulated temperature of paddy. When the relative humidity of the drying medium is low, there is a positive correlation between the drying accumulated temperature of paddy and the drying medium flow rate. When the relative humidity of the drying medium is high, the drying accumulated temperature of paddy negatively correlates with the drying medium flow rate. The reason for this phenomenon is that the relative humidity of the drying medium, compared to its flow rate, has a more significant effect on the drying accumulated temperature of paddy.
Verification
To ensure the accuracy of the regression equation, three groups of validation tests were carried out. The values of each factor are shown in , including the experimental values, the simulated values of the regression equation, and the relative errors. shows that the relative errors of the three validation tests are less than 5%, proving that the regression equation can be used to describe the relationship between the four factors and the accumulated temperature. Thus, the model is reliable and can be applied in practice.
Table 6. Relative error of the regression equation of the accumulated temperature of paddy
Establishment of tool chart of accumulated temperature and drying quality of paddy
From the actual test, the flow velocity of the drying medium in the dryer was stable in the range of 0.45–0.55 ms−1, and the relative humidity range of the drying medium was between 45% and 65% during the actual drying process. Therefore, taking the flow velocity of the drying medium as 0.5 ms−1 and the relative humidity of drying medium as 45%, 55%, and 65%, the contour map of the regression equation, coupled with the crack additional percentage and the accumulated temperature under the three relative humidity values of drying medium, was established. This is shown in . According to the contour map, the influence of the drying medium temperature and the initial moisture content on Y1 and Y2, under the condition of the flow velocity of the drying medium and the relative humidity of the drying medium, are certain. Additionally, it can be used to directly find the crack additional percentage and the accumulated temperature in some drying conditions.
Figure 5. Contour map of the accumulated temperature and the drying quality
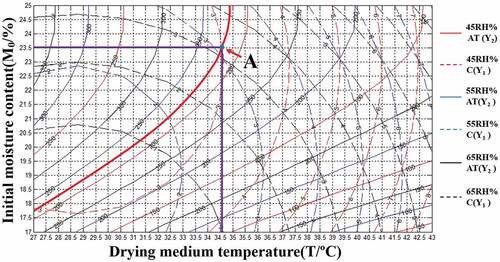
The lower-left corner shows sparse characteristics, and the upper-right corner shows dense characters. Both are shown in the contour’s map of the crack additional percentage. The crack additional percentage is lower in the lower-left corner, which indicates that the crack additional percentage of paddy is lower when the drying medium temperature, and the initial moisture content of paddy are lower. Because the initial moisture content of paddy is usually about 24% during the drying process, the area of the lower-left corner is generally not used. In the upper-right corner, the initial moisture content of paddy is higher, and the contours of the crack additional percentage are relatively dense, indicating that the effect of temperature on the crack additional percentage is significant when the initial moisture content of paddy is higher. According to the analysis of the three curves of the crack additional percentage, it can be known that, in the upper half of the map, the three curves intersect at the same point when the crack additional percentage is equal. The crack additional percentage above that point increases with the increase in the relative humidity of the drying medium. However, the tendency is opposite below that point. Additionally, above the point at which the crack additional percentage is the same, as the drying medium’s relative humidity decreases, the paddy temperature increases. This tendency is reversed below this point. The contours of the accumulated temperature show the characteristics of “upper-sparse and lower-dense” and “upper-steep and lower-gradual.” “Upper-sparse and lower-dense” indicates that the change in temperature has little effect on the accumulated temperature when the initial moisture of paddy is higher. “Upper-steep and lower-gradual” indicates that the temperature is constant. Thus, the effect of initial moisture content of paddy on the accumulated temperature becomes clearer with the decrease in initial moisture content. Thus, when integrating the three curves, the crack additional percentage exhibits a decreasing trend with the increase in accumulated temperature. Under normal circumstances, a higher initial moisture content of paddy corresponds to a longer drying time. Therefore, the crack additional percentage increases. When the temperature is constant, the crack additional percentage increases slightly with the increase in accumulated temperature. When the accumulated temperature reaches 300°C·h, the crack additional percentage will be less than 3%, even if the initial moisture content of paddy reaches a minimum of 24%.
The use of this map is illustrated by the following example. Assuming that we have a batch of paddy with moisture content 23.5% and dryer internal relative humidity measurement 45%. If we want to make the crack additional percentage at 3%, by looking at the map, it can be found that the dryer should be drying at under 34.6°C (point A). At the same time, the accumulated temperature should be at 207.5°C·h.
The results of this test are obtained by the continuous drying test. However, in the actual drying process, to balance the thermal stress and wet stress in grains, tempering time will be added. The effect of tempering time and temperature on the crack additional percentage is significant. Therefore, in the application of the contour map obtained in this test (), the crack additional percentage should be multiplied by the corresponding coefficient, k, obtained by the actual experiment, based on the actual tempering ratio. The calculation method is as follows:
In the formula, is a constant,
are various coefficients, and
is the tempering ratio. Taking the formula into a continuous drying crack additional percentage regression formula of EquationEquationEquation(5)
(5)
(5)
(5)
(5) can get the current tempering ratio regression equation.
Conclusion
In this study, models for the crack additional percentage and drying accumulated temperature of paddy were established. These models are reliable and practical. When the temperature of the drying medium is 31°C, relative humidity of the drying medium is 60%, paddy initial moisture content is 19%, and wind speed is 0.5 ms−1, the crack additional percentage can reach 0.508%, and the average precipitation rate is 0.719%·h. The degree of influence of each factor on the crack additional percentage, in decreasing order is as follows: Drying medium temperature>initial moisture content>relative humidity of drying medium>flow velocity of the drying medium. The interaction between the relative humidity of the drying medium and the initial moisture content of paddy positively correlates with the crack additional percentage. A contour map of accumulated temperature and drying quality under different process parameters was developed, providing a parameter searching basis for the quality control of paddy and the process adjustment of paddy drying. After practical verification, the model and the tool chart in this paper can be used in practice, providing theoretical basis for the digital design and real-world control of the dryer.
Acknowledgments
This paper was completed under the guidance of my mentor and the joint efforts of the members of the research team. I would like to express my sincere gratitude to my mentor and fellow members. Additionally, I would like to acknowledge the funding support received under the project “The key technology and equipment research and development of the paddy temperature changing intelligent drying and drying,” item number 2016YFD0401001. I would also like to thank the reviewers for their valuable suggestions that helped improve the quality of the manuscript.
Additional information
Funding
References
- Tohidi, M.; Sadeghi, M.; Torki-Harchegani, M. Energy and Quality Aspects for Fixed Deep Bed Drying of Paddy. Renewable Sustainable Energy Rev. 2017, 70, 519–528. DOI: 10.1016/j.rser.2016.11.196.
- Barzegar, M.; Zare, D.; Stroshine, R. L. An Integrated Energy and Quality Approach to Optimization of Green Peas Drying in a Hot Air Infrared-Assisted Vibratory Bed Dryer. J. Food Eng. 2015, 166, 302–315. DOI: 10.1016/j.jfoodeng.2015.06.026.
- Martynenko, A.; Zheng, W. Electrohydrodynamic Drying of Apple Slices: Energy and Quality Aspects. J. Food Eng. 2016, 168, 215–222. DOI: 10.1016/j.jfoodeng.2015.07.043.
- Bantle, M.; Eikevik, T. M. A Study of the Energy Efficiency of Convective Drying Systems Assisted by Ultrasound in the Production of Clipfish. J. Cleaner Prod. 2014, 65, 217–223. DOI: 10.1016/j.jclepro.2013.07.016.
- Firouzi, S.; Alizadeh, M. R.; Haghtalab, D. Energy Consumption and Rice Milling Quality upon Drying Paddy with a Newly-Designed Horizontal Rotary Dryer. Energy. 2017, 119, 629–636. DOI: 10.1016/j.energy.2016.11.026.
- Sarker, M. S. H.; Ibrahim, M. N.; Abdul Aziz, N.; Punan, M. S. Energy and Exergy Analysis of Industrial Fluidized Bed Drying of Paddy. Energy. 2015, 84, 131–138. DOI: 10.1016/j.energy.2015.02.064.
- Sarker, M. S. H.; Ibrahim, M. N.; Aziz, N. A.; Salleh, P. M. Energy and Rice Quality Aspects during Drying of Freshly Harvested Paddy with Industrial Inclined Bed Dryer. Energy Conversion Manage. 2014, 77, 389–395. DOI: 10.1016/j.enconman.2013.09.038.
- Meeso, N.; Nathakaranakule, A.; Madhiyanon, T.; Soponronnarit, S. Modelling of Far-Infrared Irradiation in Paddy Drying Process. J. Food Eng. 2007, 78, 1248–1258. DOI: 10.1016/j.jfoodeng.2006.01.003.
- Rordprapat, W.; Nathakaranakule, A.; Tia, W.; Soponronnarit, S. Comparative Study of Fluidized Bed Paddy Drying Using Hot Air and Superheated Steam. J. Food Eng. 2005, 71, 28–36. DOI: 10.1016/j.jfoodeng.2004.10.014.
- Shei, H. J.; Chen, Y. L. Computer Simulation on Intermittent Drying of Rough Rice. Drying Technol. 2007, 20, 615–636. DOI: 10.1081/drt-120002820.
- Basunia, M. A.; Abe, T. Thin-Layer Solar Drying Characteristics of Rough Rice under Natural Convection. J. Food Eng. 2001, 47, 295–301. DOI: 10.1016/S0260-8774(00)00133-3.
- Basunia, M. A.; Abe, T. Thin-Layer Drying Characteristics of Rough Rice at Low and High Temperatures. Drying Technol. 1998, 16, 579–595. DOI: 10.1080/07373939808917425.
- Tanaka, F.; Tanaka, F.; Tanaka, A.; Uchino, T. Mathematical Modelling of Thin-Layer Drying according to Particle Size Distribution in Crushed Feed Rice. Biosyst. Eng. 2015, 136, 87–91. DOI: 10.1016/j.biosystemseng.2015.05.007.
- Page, G. E.; Factors Influencing The Maximum Rates of Air Drying Shelled Corn in Thin Layers. PhD Thesis, Purdue University, Ann Arbor United States, 1949.
- Kucuk, H.; Midilli, A.; Kilic, A.; Dincer, I. A Review on Thin-Layer Drying-Curve Equations. Drying Technol. 2014, 32, 757–773. DOI: 10.1080/07373937.2013.873047.
- Foroughi-Dahr, M.; Golmohammadi, M.; Pourjamshidian, R.; Rajabi-Hamaneh, M.; Hashemi, S. J. On the Characteristics of Thin-Layer Drying Models for Intermittent Drying of Rough Rice. Chem. Eng. Commun. 2014, 202, 1024–1035. DOI: 10.1080/00986445.2014.900049.
- Midilli, A.; Kucuk, H.; Yapar, Z. A New Model for Single-Layer Drying. Drying Technol. 2002, 20, 1503–1513. DOI: 10.1081/DRT-120005864.
- Ng, P. P.; Law, C. L.; Tasirin, S. M.; Daud, W. R. W. Drying Characteristics of Malaysian Paddy: Kinetics & Grain Cracking Quality. Drying Technol. 2005, 23, 2477–2489. DOI: 10.1080/07373930500341724.
- Ondier, G. O.; Siebenmorgen, T. J.; Mauromoustakos, A. Low-Temperature, Low-Relative Humidity Drying of Rough Rice. J. Food Eng. 2010, 100, 545–550. DOI: 10.1016/j.jfoodeng.2010.05.004.
- Chen, T.; Huang, Q.; Gao, D.; Huang, Z.; Zheng, Y.; Li, Y. Accumulated Temperature as an Indicator to Predict the Stabilizing Process in Sewage Sludge Composting. Acta Ecol. Sin. 2002, 22, 911–915.
- Dong, J.; Liu, J.; Tao, F.; Xu, X.; Wang, J. Spatio-Temporal Changes in Annual Accumulated Temperature in China and the Effects on Cropping Systems, 1980s to 2000. Clim. Res. 2009, 40, 37–48. DOI: 10.3354/cr00823.
- Cutforth, H. W.; Shaykewich, C. F. Relationship of Development Rates of Corn from Planting to Silking to Air and Soil Temperature and to Accumulated Thermal Units in a Prairie Environment. Can. J. Plant Sci. 1989, 69, 121–132. DOI: 10.4141/cjps89-014.
- Qin, X.; Li, Y.; Han, Y.; Hu, Y.; Li, Y.; Wen, X.; Liao, Y.; Siddique, K. H. M. Ridge-Furrow Mulching with Black Plastic Film Improves Maize Yield More than White Plastic Film in Dry Areas with Adequate Accumulated Temperature. Agric. For. Meteorol. 2018, 262, 206–214. DOI: 10.1016/j.agrformet.2018.07.018.
- Wu, Y.; Wu, W.; Feng, H.; Zhang, Y.; Yan, X. In Intelligent Monitoring and Control of Grain Continuous Drying Process Based on Multi-parameter Corn Accumulated Temperature Model, International Conference on Smart Grid & Electrical Automation, 2017.
- Prasad, P. V. V.; Craufurd, P. Q.; Summerfield, R. J. Fruit Number in Relation to Pollen Production and Viability in Groundnut Exposed to Short Episodes of Heat Stress. Ann. Bot. 1999, 84, 381–386. DOI: 10.1006/anbo.1999.0926.
- Hu, X. W.; Fan, Y.; Baskin, C. C.; Baskin, J. M.; Wang, Y. R. Comparison of the Effects of Temperature and Water Potential on Seed Germination of Fabaceae Species from Desert and Subalpine Grassland. Am. J. Bot. 2015, 102, 649–660. DOI: 10.3732/ajb.1400507.
- Liu, D.; Xin, L. I.; Zheng, H.; Wang, Z. H.University, N. A. Analysis on Changes Of Earth Temperature and Spring Maize Sowing Time in Second Accumulated Temperature Of Heilongjiang Province. Journal Of Maize Sciences 2016, 24, 103-106. DOI: 10.13597/j.cnki.maize.science.20160617
- Sun, L. L.; Li-Li, X. U.; Yuan-Peng, D. U.; Zhai, H. The Relationship of Effective Accumulated Temperature and Bud Burst in Grapevine. Plant Physiol. J. 2016. DOI: 10.13592/j.cnki.ppj.2016.0232.
- Zhao, D.; Wu, S. Spatial and Temporal Variability of Key Bio-Temperature Indicators on the Qinghai-Tibetan Plateau for the Period 1961–2013. Int. J. Climatol. 2016, 36, 2083–2092. DOI: 10.1002/joc.4482.
- Liu, Y.; Hou, P.; Xie, R.; Hao, W.; Li, S.; Mei, X. Spatial Variation and Improving Measures of the Utilization Efficiency of Accumulated Temperature. Crop Sci. 2015, 55, 1806–1807. doi: 10.2135/cropsci2014.10.0735.
- Chen, Y.; Xue, Q.; Zhenfa, L. I.; Liu, S.; Chun, L. I.; Gong, Z.; Center, T. C.Comparison of Effective Accumulated Temperature of Different Granularities in Simulating Development Stage of Cucumber in Greenhouse. Northern Horticulture 2016, 11, 41-45. DOI: 10.11937/bfyy.201611011.
- Ni, X.; Gunawan, G.; Brown, S. L.; Sumner, P. E.; Ruberson, J. R.; Buntin, G. D.; Holbrook, C. C.; Lee, R. D.; Streett, D. A.; Throne, J. E. Insect-Attracting and Antimicrobial Properties of Antifreeze for Monitoring Insect Pests and Natural Enemies in Stored Corn. J. Econ. Entomol. 2008, 101, 631. DOI: 10.1603/0022-0493(2008)101[631:iaapoa]2.0.co;2.
- Li, D. X.; Kang, Z. K.; Wang, J. Y.; Wang, H. W.; Dong, J. F.; Liang, S. L. Threshold Temperature and Effective Accumulated Temperature of Peach Fruit Borer, Carposina Sasakii. Chin. Bull. Entomol. 2010, 47, 923–926. DOI: 10.3724/SP.J.1238.2010.00550.
- Zheng, X. Z.; Zhao, X. D.Calculation of taste value and study on drying quality of rice. Transactions of the Chinese Society of Agricultural Machinery 2000, 31, 54-60.
- Wu, W. F.; Jin, Y. A Vertical Hot and Humid Rate Controlled Thin-Layer Drying Test Bed and Drying Method. 2016, 201610184049.6.
- ElGamal, R. A.; Kishk, S. S.; ElMasry, G. M. Validation of CFD Models for the Deep-Bed Drying of Rice Using Thermal Imaging. Biosyst. Eng. 2017, 161, 135–144. DOI: 10.1016/j.biosystemseng.2017.06.018.
- Özdemir, M. B.; Aktaş, M.; Şevik, S.; Khanlari, A. Modeling of a Convective-Infrared Kiwifruit Drying Process. Int. J. Hydrogen Energy. 2017, 42, 18005–18013. DOI: 10.1016/j.ijhydene.2017.01.012.
- Corrêa, P. C.; de Oliveira, G. H. H.; de Oliveira, A. P. L. R.; Botelho, F. M.; Goneli, A. L. D. Thermodynamic Properties of Drying Process and Water Absorption of Rice Grains. CyTA J. Food. 2016, 15, 204–210. DOI: 10.1080/19476337.2016.1238012.
- Wang, R.; Zhang, M.; Mujumdar, A. S.; Sun, J.-C. Microwave Freeze–Drying Characteristics and Sensory Quality of Instant Vegetable Soup. Drying Technol. 2009, 27, 962–968. DOI: 10.1080/07373930902902040.
- Mohan, V. P. C.; Talukdar, P. Experimental Studies for Convective Drying of Potato. Heat Transfer. Eng. 2014, 35, 1288–1297. DOI: 10.1080/01457632.2013.876844.
- Abud-Archila, M.; Courtois, F.; Bonazzi, C.; Bimbenet, J. J. A Compartmental Model Of Thin-Layer Drying Kinetics Of Rough Rice. Drying Technol. 2007, 18, 1389–1414. DOI: 10.1080/07373930008917784.
- Wang, D. Y.; Cheng-Hua, L. I.; Gong, Y. J.; Wang, Q. Influence of Drying Parameters on Additional Crack Percentage of Rice in a Deep Fixed-bed. Journal of Shenyang Agricultural University 2005, 36, 482-484.
- Fu, Z. Y.; Hua, Y. L. Analysis of peak stress in rice kernel during moisture absorption. Transactions of the Chinese Society of Agricultural Machinery 2000, 31, 59-62.