
 ?Mathematical formulae have been encoded as MathML and are displayed in this HTML version using MathJax in order to improve their display. Uncheck the box to turn MathJax off. This feature requires Javascript. Click on a formula to zoom.
ABSTRACT
Before cracking, subjecting water chestnuts to pre-conditioning is a common practice. However, the existing practice of pre-conditioning has no scientific rationale and therefore leads to low flour recovery and poor quality. Thus, the aim of the present research work was to optimize the pre-conditioning process for water chestnuts and to analyze the efficacy of optimized process as a means to increase the resistant starch content and reduce the glycemic index in water chestnut flour. Central composite rotatable design was used to determine the effect of water chestnut:water ratio, water temperature and pre-conditioning time on yield and brightness (L* value) of flour. Optimization of pre-conditioning process was done by response surface of desirability function. Regression models for both the product responses were highly significant (p < 0.0001) with high coefficient of determination (R2 > 0.95). Scanning electron microscopy (SEM) showed compact, smooth and oval shaped starch granules with crystalline network in preconditioned water chestnut flour. FTIR studies also indicated higher absorbance ratio of 1047/1022 cm−1 for preconditioned water chestnut flour which further authenticated the SEM findings. Subjecting water chestnuts to optimized conditions of pre-conditioning (i.e., water chestnut:water ratio 1:1.5; water temperature 87.85̊C and pre-condition time 45 min), also increased the resistant starch content and lowered the glycemic index and glycemic load of the water chestnut flour.
Introduction
Water chestnut (Trapanatans), also known as “Singhara”, belongs to monogeneric family of Trapaceae. It is an aquatic angiospermic plant, which grows naturally in fresh water wet lands, ponds, lakes, swamps, sluggish reaches of rivers and fresh or brackish reaches of estuaries.[Citation1] It is an invasive plant found in almost all the major water bodies of Jammu and Kashmir, particularly in Wular lake, which is Asia’s largest fresh water lake. Average production of water chestnuts from this lake is about 4000–5000 MT and about 80,000 people residing in 28 villages on the periphery of this lake are directly involved in its trade.[Citation2] The edible portion of water chestnut is highly valued for its gluten free starch, digestible proteins, fiber, polyphenols and many essential minerals. It is being relished as a snack and is also ground to flour and used in various food preparations. Freshly harvested water chestnuts contain 80–82% moisture content and 18–20% dry matter.[Citation3] In order to harden the endosperm and to make it translucent, water chestnuts are subjected to preconditioning. The existing pre-conditioning practice in Jammu and Kashmir, India, is to heat the water chestnuts for 5–6 min in water:water chestnut ratio of 0.25:1 at a temperature of about 80–85°C. Such practice leads to less kernel recovery and flour yield. Although the concept of pre-conditioning water chestnuts before decortication is basically sound, it gelatinizes the starch present inside the endosperm and makes the kernels hard which reduces the kernel breakage during decortication and improves the kernel recovery as well as flour yield. In addition to this, gelatinization of starch followed by retrogradation increases the resistant starch content due to redistribution of water molecules and reassociation of starch structure.[Citation4] Retrogradation of gelatinized starch changes starch chemistry and digestibility. Retrograded starch is considered as RS3 which escapes digestion in the small intestines and is known to confer benefits on gut health, glucose metabolism, lipid profile, cardiovascular diseases, obesity, etc.[Citation5] Foods high in RS have hypoglycemic effect due to lower glycemic index score. Glycemic index is associated with the potential of carbohydrate-based foods to either raise or lower the glucose levels in the blood. High glycemic index (GI) foods (having a GI score above 70) raise the blood sugar levels at a faster rate in comparison to low GI foods. In contrast, foods having low GI (i.e., less than 55) hold less potential to raise the blood sugar levels. Glycemic load is another important factor which helps to predict the blood glucose response with respect to amount of CHO being consumed.[Citation6] However, pre-conditioning process of water chestnuts is somewhat complicated and has not been studied in detail in exploring the relationship between process variables and flour characteristics. The important process variables that influence the extent of gelatinization and retrogradation during preconditioning of water chestnuts are water ratio, water temperature and pre-conditioning time.
Thus, in order to improve the kernel recovery, flour yield and quality of water chestnut flour, it is essential to understand the structure of the starch that composes it. Therefore, an opportunity exists to conduct a detailed study on preconditioning of water chestnuts. Keeping in view the fact that water chestnut has so far remained an underutilized crop, the present study was carried out to optimize the pre-conditioning process for water chestnuts so as to improve the recovery and quality of flour. Furthermore, the water chestnut flour was evaluated for glycemic index, glycemic load and resistant starch to anticipate its use for commercial purposes. Providing low GI gluten free flour to the masses is a challenge, if one intends to meet the specific markets and end uses. In this regard, water chestnut flour is an ideal candidate which can be explored for development of baked products for celiac disease and diabetic patients. At the same time, it will help to provide remunerative returns to the people who are directly or indirectly involved in water chestnut trade.
Materials and methods
Analysis of fresh sample
Fully mature water chestnuts (having jet black outer coat color with protruding spines and swollen fruit) () were harvested from Wular Lake of Kashmir. After harvesting, the water chestnuts were decorticated manually to extract the kernels. Kernels after converting into paste were evaluated for moisture (925.10), total sugars, reducing sugars, non-reducing sugars (939.03) and total titratable acidity (as citric acid %) according to the methods of AOAC.[Citation7] Water activity was determined using a water activity meter (AquaLab Pre, PRE000197, Washington). Resistant starch was determined using the Megazyme Assay Kit (Megazyme International, Wicklow, Ireland), according to the approved AACC method 32–40.[Citation8] Hand refractometer (Erma, Japan) was used to record the soluble solid concentration (SSC) and results were expressed as percentage.
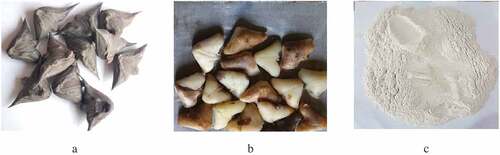
Figure 1. Images of (a) water chestnuts, (b) water chestnut kernels, and (c) water chestnut flour
Experimental design
After harvesting, water chestnuts were subjected to pre-conditioning. Central Composite Rotatable Design[Citation9] was used to analyze the effect of three selected independent variables on dependent variables. The independent variables selected were- water chestnut: water ratio, water temperature (°C) and pre-conditioning time (min) while as dependent variables were yield (%) and L* value. The design produced 20 runs with eight (23) factorial points, (three levels for each variable), six-star corner points (two for each variable) and six center points. The experimental ranges and coded levels of the preconditioning process variables are depicted in .
Table 1. Effect of processing condition on flour yield and L*-value
Table 2. Effect of pre-conditioning on resistant starch, glycemic index and glycemic load of water chestnut flour
Product responses
After subjecting water chestnuts to pre-conditioning as per the experimental design, the kernels were extracted manually from water chestnuts () The kernels were dried in a tray drier (NSW-154, S-Narang, Scientific works New Delhi) at 45 ± 5°C till the moisture content of 9.5 ± 0.5% was achieved. The dried kernels were ground in a lab mill (3303, Perten, Hagersten, Sweden) to a fineness that passed through 200 µm sieve. The flour () was analyzed for L* value using Hunter Lab Colorimeter (SN 3001476, Accuracy Micro Sensors, New York) and the flour yield was calculated as
Process optimization
To determine the optimum conditions of preconditioning, response surface of desirability function was used for numerical optimization. Desirability function is one of the useful approaches to optimize the multiple responses. The general approach is first to convert each response yi into an individual desirability function di that varies over the range 0 ≤ di ≤ 1, where if response yi is at its target value, then di = 1 and if it is outside the acceptable range, di = 0.[Citation10,Citation11] The design variables were then chosen to maximize the overall desirability as
where m is the number of responses and D0 is the overall desirability. Design-Expert uses direct search method to maximize the desirability function, D0. Because the individual desirability functions are not differentiable, overall desirability was thus computed by Design-Expert for optimization of preconditioning process for water chestnuts.[Citation12] The optimum condition criteria applied for numerical optimization was to maximize both dependent variables (L* value and flour yield).
Quality evaluation of flour
Physico-chemical analysis: In order to best characterize the effect of optimized conditions of pre-conditioning on flour quality, the flour obtained from water chestnuts subjected to optimized conditions of pre- conditioning as well as traditional method of pre-conditioning were evaluated for below mentioned parameters:
Glycemic index: Glycemic index (GI) of the samples was determined by following the procedures of Goni et al.[Citation13] The rate of starch digestion was expressed as the percentage of total starch hydrolyzed at a time difference of 30 min. The areas under curves (AUC) for hydrolysis of all the samples were calculated for the release of glucose concentration against time. The hydrolysis index (HI) was calculated as the relation between the AUC for a sample and the AUC for a reference material- white bread, expressed as percentage. The kinetics of starch hydrolysis, the area under the hydrolysis curve (AUC), hydrolysis index (HI) and glycemic index (GI) are calculated as follows:
where C is the percentage of starch hydrolyzed at time t, C∞ is the percentage of starch hydrolyzed after 180 min, k is the kinetic constant (min−1), t is the time (min), tf is the final time (180 min), and t0 is the initial time (0 min).
Glycemic load: Glycemic load (GL) was estimated indirectly by multiplying the amount of available carbohydrate contained in a nominal serving (50 g) of water chest flour with glycemic index (GI) value of flour divided by 100[Citation14]
The available carbohydrate per serving was calculated by subtracting dietary fiber from the total carbohydrates of flour sample.[Citation15]
Scanning electron microscopic (SEM) imaging
SEM was used to study the morphology of water chestnut flour samples. The samples were glued onto a sample holder using double-sided cellophane tape and then coated with gold. The coated samples were photographed using a scanning electron microscope (Hitachi S-300H-Tokyo, Japan),at an accelerator potential of 5.kV to visualize the structure of water chestnut flour samples.
Attenuated total reflection-Fourier transform infrared spectroscopy (ATR-FTIR)
AT-FTIR spectra of the flour samples were recorded in the range of 4000–400 cm−1 by a FTIR spectrometer system (Cary 630 FTIR, Agilent Technologies, USA), coupled with an ATR accessory. Analysis was carried out at room temperature, at a resolution of 4 cm−1, using Resolution Pro software version 2.5.5 (Agilent Technologies, USA).
Statistical analysis
For resistant starch, glycemic index and glycemic load, five replications were made and data was statistically analyzed by employing Students t-test to signify the effect of pre-conditioning on resistant starch, glycemic index and glycemic load of water chestnut flour.
Results and discussions
Physico-chemical analysis of freshly harvested water chestnuts
Kernels extracted from freshly harvested water chestnuts had moisture content (81.20%), soluble solid concentration (7.8%), acidity (0.162%), total sugars (5.68%), reducing sugars (1.32%), non-reducing sugars (4.36%), water activity (0.98) and resistant starch content (14.50%). The results were found in concomitance with the results reported previously by Mir et al.[Citation16], Shafi et al.[Citation17], and Shafi et al.[Citation3] for water chestnuts.
Analysis of variance for the dependent variables
Analysis of variance (ANOVA) revealed that models developed for both the product responses (flour yield and L*value) were significantly (P < 0.0001) affected by independent variables viz water chestnut: water ratio, water temperature and pre-conditioning time. The coefficient of determination computed for both the selected parameters were highly desirable (R2 = 0.970 for flour yield and R2 = 0.952 for L* value) which indicates the reasonable fit of empirical models with actual data. The predicted and adjusted R2 values for both the product responses were in sound agreement with each other. Also, the lower coefficient of variation (CV) obtained for both the models confirms the accuracy, reliability and reproducibility of results. Models for both the parameters (flour yield and L* value) showed non-significant lack of fit which indicates that second order polynomial models correlated well with the measured data. For comparing the range of predicted values at design points to average the prediction error, the adequate precision (signal to noise ratio) for each model parameter was computed. For adequate model discrimination, the adequate precision value should be greater than 4.[Citation18] Highly desirable adequate precision values (i.e., 16.61 for flour yield and 19.08 for L* value) were recorded which validates the developed models.
Effect of preconditioning on flour yield
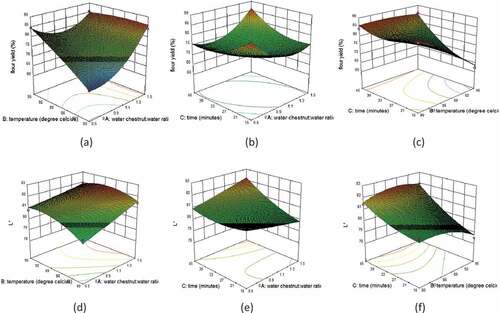
The flour yield is a parameter of economic importance from processing point of view. The flour yield percentages for different experimental runs of preconditioning were found in the range of 62.33 to 87.46% (). The fitted regression equation for flour yield is as follows:
where A is water chestnut:water ratio, B is water temperature and C is preconditioning time. The regression Equationequation (8)(8)
(8) for flour yield indicates the significant interactive effects (p ≤ 0.01) of all the three independent variables on flour yield. Significant quadratic effects (p ≤ 0.01) of water chestnut: water ratio (A) and preconditioning time (C) are also evident from EquationEquation (8)
(8)
(8) . Response surface plots depicted in –), shows the positive interactive effects of AC and BC and negative interactive effect of AB with the flour yield. These interactive effects of independent variables and quadratic effects of A and C with flour yield can be explained by complex phenomenon of starch gelatinization which involves change in macromolecular structure depending on moisture content, water temperature and pre-conditioning time. Kernel integrity is promoted by heat-moisture treatment of starch due to more ordered and closely packed crystallite formation as compared to native starch.[Citation19] High kernel integrity enhances the flour recovery. Previously, Yousaf et al.[Citation20] optimized the parboiling process for rice using RSM and described the effects of independent variables (soaking temperature, soaking time and steaming time) on percentage of head rice yield, hardness, cooking time, lightness, and color through response surface plots. The authors reported that hardness of parboiled rice was increased with the increase in steaming time and head rice recovery was increased on increasing soaking temperature and soaking time.
Figure 2. Response surface plots depicting effects of independent processing variables on dependent variables: (a) Effect of water temperature and water chestnut: water ratio on flour yield. (b) Effect of water chestnut: water ratio and pre-conditioning time on flour yield. (c) Effect of water temperature and pre-conditioning time on flour yield. (d) Effect of water chestnut: water ratio and temperature on L* value of flour. (e) Effect of water chestnut: water ratio and pre-conditioning time on L* value of flour. (f) Effect of water temperature and pre-conditioning time on L* value of flour
However, linear terms for all the three independent variables and quadratic term of preconditioning temperature had no significant effects on flour yield. This is because gelatinization time and temperature vary as per the composition and botanically source of starch and is mostly favored at temperatures above 65̊C at sufficient time and moisture content. The quadratic term A (water chestnut: water ratio) had a dominating effect on flour yield (Equationequation 8(8)
(8) ), which is evident by a maximum flour yield value of 87.46% at highest water chestnut: water ratio of 1:1.75 (). Significant quadratic effects (p ≤ 0.01) of water chestnut: water ratio(A) and preconditioning time (C) implies that during preconditioning, availability of excess water for sufficient time hydrates the starch granules more, which enhances the process of gelatinization. Further, temperature above gelatinization enhances the water uptake rate by breaking the intermolecular hydrogen bonds between amylose and amylopectin fractions. The gelatinization of starch is followed by retrogradation which leads to hardening of the kernels. Retrogradation of cooled starch continues throughout drying and storage which leads to firmness and rigidity of crystallite lattices within the starch granules.[Citation21] Preconditioning process fills the void spaces and seals the internal cracks of the endosperm with gelatinized starch. This could have possibly enhanced the recovery of flour by minimizing surface fissures and kernel breakage. Similar findings have been reported for parboiling of rice by Mir & Bosco[Citation22] and Islam et al.[Citation23] The authors have reported that grain hardness was increased after parboiling which leads to higher milling recovery. Likewise, Young et al.[Citation24] and Messia et al.[Citation25], have also reported that parboiling promoted compactness in kernels and increased the decortication yield in case of sorghum and milling yield in emmer wheat, respectively.
Effect of pre-conditioning on L* value
Color is an important attribute directly related to the acceptability of any food item. Out of different color coordinates, L* value which demonstrates the brightness was selected in the present study. Higher lightness values are desirable for the flours obtained from various starch sources.[Citation26] The L*-values of pre-conditioned water chestnut flour samples were found in the range of 78.48 to 82.45 (). The fitted regression model for L*-value is shown as follows:
Response surface plots (–)) demonstrate the significant (p ≤ 0.05) negative interaction effect of AB, and significant (p ≤ 0.01) positive interaction effects of AC and BC on the L* value of flour. The positive interactive effects of BC and AC with the L* value might be due to more moisture gain as starches with high moisture content tend to appear brighter in color.[Citation27] The regression Equationequation (9)(9)
(9) shows that out of three selected independent variables, only pre-conditioning time (C) had a significant linear (p < 0.01) effect on L* value. The positive coefficient of linear term of preconditioning time (C) indicate that with the increase in preconditioning time, the L* value of flour was increased which is evident by highest L* value of 82.45 at highest preconditioning time of 55 min (). With the increase in soaking time, the moisture content of kernel increases which might have increased the brightness due to increased crystallinity and reflection effects of light. Quadratic term of pre-conditioning time (C) showed significant positive (p < 0.01) effect on L* value of flour. The longer period of soaking might have facilitated the softening and removal of dark pigments or blemishes from kernels and thus improved the brightness of flour, whereas negative quadratic effect of temperature (B2) and negative interactive effects of AB on L* value can be justified by the reason that high water temperature leads to kernel discoloration by promoting maillard type of browning reaction and lipid oxidation by activating hydrolytic enzymes. However, the response surface plots depicting the effects of parboiling conditions (soaking time, soaking temperature and steaming time) on L* value in the study conducted by Yousaf et al[Citation20] indicated that L* value decreased with the severity of parboiling. They reported that the reduced brightness of parboiled rice was due to leaching of bran pigments during parboiling.
Process optimization
Using the desirability function method, the optimum processing conditions for pre-conditioning of water chestnuts were determined. The desirability value obtained was 0.952 (). Water chestnut:water ratio (1:1.5), water temperature 87.85̊C and pre-conditioning time (45 min) were predicted as optimum conditions by RSM for pre-conditioning of water chestnuts. The predicted responses for flour yield and L*-value were 86.33% and 82.25, respectively, which were almost similar to actual responses of 85.29% and 81.02 obtained for flour yield and L* value, respectively. The variation of actual response values was within 1.5% of the predicted values.
Figure 3. Desirability function response surface plot for preconditioning of water chestnuts
Evaluation of water chestnut flour
Flour obtained from water chestnuts subjected to optimized conditions of pre-conditioning (water chestnut: water ratio- 1:1.5, water temperature 87.85̊C and pre-conditioning time 45 min) was compared with the flour obtained from water chestnuts subjected to traditional method of pre-conditioning (water chestnut: water ratio- 1:0.25, water temperature 80-85̊C and pre-conditioning time 5–6 min) for below-mentioned parameters:
Scanning electron microscopy
Scanning electron micrograph of flour obtained from water chestnuts subjected to optimized conditions of pre-conditioning is depicted in and that of flour obtained from water chestnuts subjected to traditional method of pre-conditioning is depicted in . It is evident in micrograph () that starch granules are somewhat irregular and assymetric in shape with rough surface which indicates that water chestnut flour obtained after traditional pre-conditioning was not properly gelatinized. In contrast starch granules of flour obtained from water chestnuts after subjecting to optimized conditions of pre-conditioning were round and oval in shape with smooth surface (). Smoothness and integrity of starch granules reveals the complete gelatinization of starch during optimized pre-conditioning process. Further, gelatinization is followed by retrogradation which facilitates the reassociation of starch molecules and leads to formation of compact structures with smooth surfaces. Therefore, changes in the morphology of starch granules are attributed to extent of gelatinization and retrogradation. Lee et al.[Citation28] reported that changes in starch morphology may be due to proper swelling of the starch granules during sufficient moisture content. Also, smooth and dense starch granules shown in might be resistant to enzymatic hydrolysis due to formation of high crystalline network. Thus, heating starch based material above gelatinization temperature at sufficient time and moisture is pre-requisite for gelatinization viz a viz retrogradation.[Citation29]
Figure 4. SEM images of (a) flour obtained from water chestnuts subjected to optimized conditions of pre-conditioning and (b) flour obtained from water chestnuts pre-conditioned traditionally
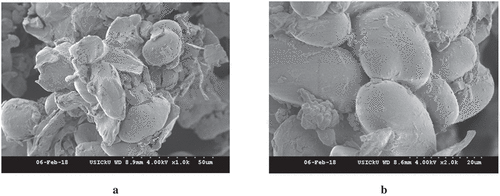
Rough and cracky granular structures seen in indicate the partial gelatinization of starch in the flour obtained from water chestnuts subjected to traditional method of pre-conditioning. The partially gelatinized starch granules are more susceptible to disintegration. Similar results were reported by Jagannadham et al.[Citation30] for retrograded chickpea flour. They reported that gelatinization followed by retrogradation changes the starch morphology and forms densely packed helical structures. At the same time, retrogradation of amylose leads to formation of large granules with filamentous network which are resistant to enzymatic hydrolysis.
ATR-FTIR analysis
AT-FTIR analysis of the samples was done in order to characterize the chemical groups/bonds associated with specific structural organization of starch granules. In addition to this, spectral vibrations of various functional groups were used to access the changes in starch morphology caused as a result of preconditioning process. FTIR spectrum of flour obtained from water chestnuts subjected to optimized conditions of pre-conditioning is depicted in and that of flour obtained from water chestnuts subjected to traditional method of pre-conditioning is depicted in .
Figure 5. AT-FTIR spectrum of (a) flour obtained from water chestnuts subjected to optimized conditions of pre-conditioning and (b) flour obtained from water chestnuts pre-conditioned traditionally
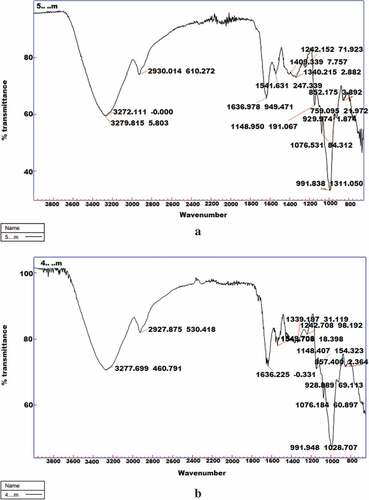
Both the samples depicted absorption peaks in the range of 3277 to 800 cm−1 which are characteristic to starch structures. The peaks at 3277, 2930 and 1636 cm−1 in both the samples correspond to scissoring vibrations of poly −OH, C−H and bending vibrations of water bonds, respectively. Maximum bands were recorded between 1636 to 800 cm−1 ( and ). The absorbance peaks at 1500 corresponds to H−CH,1409 and 1340 to C−H and 1242 to O−H bending vibrations. Absorption peaks displayed at 1148 and 1076 correspond to stretching of C−O−H functional groups while as bands at 928 and 857 cm−1 correspond to vibrations of α1,4 glycosidic bands in glucopyranosyl rings. The peaks displayed at 991.83 cm−1 and 991.94 cm−1 in and depict the C−OH bending and CH2 related modes. The peaks at 1047 and 1022 cm−1 which are associated with bending of C−O−H bonds have been used to indicate the crystalline and amorphous regions in starch, respectively.[Citation31] Ratio of crystalline to amorphous regions were calculated to be 0.89 for the flour obtained after optimized preconditioning of water chestnuts and 0.84 for water chestnut flour obtained after traditional preconditioning which suggested that flour obtained after optimized conditions of pre-conditioning was more crystalline than the flour obtained after traditional method of pre-conditioning.]. Short-range molecular structure of potato starch was studied by Soest et al.[Citation32] to elucidate the effect of water content on spectral changes within amorphous and crystalline regions of starch confirming that addition of water leads to formation of more ordered structure. Chung et al.[Citation33] reported increased absorbance ratio of 1047 cm−1/1022 cm−1 for hydrothermally treated corn, pea and lentil starches which showed higher RS content than their native counter parts.
Starch digestibility profile with regard to resistant starch content, glycemic index and glycemic load
Resistant starch content, a carbohydrate fraction that escapes digestion in our gut has a phenomenal role in health promotion especially in controlling blood glucose response of people suffering from diabetes.[Citation34] Resistant starch content of flour obtained from water chestnuts subjected to optimized conditions of pre-conditioning was almost twice than traditionally preconditioned sample () due to phenomenon of retrogradation. Higher water ratio and prolonged pre-conditioning time during optimized pre-conditioning than traditional pre-conditioning leads to enhanced gelatinization of starch in case of optimized water chestnut flour. During retrogradation, gelatinized starch tends to reorganize its molecular structure leading to formation of more complex starch structure which is resistant to enzymatic hydrolysis.[Citation33] Therefore, significant increase in resistant starch content of flour obtained after optimized conditions of pre-conditioning may be attributed to formation of tightly packed crystalline aggregates within starch granules due to gelatinization followed by retrogradation. Also, the formation of amylose-lipid complexes might be the reason for higher resistant starch in flour obtained from water chestnuts after optimized preconditioning. The lower glycemic index and glycemic load of flour () obtained from water chestnuts subjected to optimized conditions of preconditioning compared to traditionally preconditioned one can be attributed to its higher fractions of resistant starch which is resistant to hydrolysis and digestion.[Citation35] Similar results were reported by Chung et al.[Citation33] in corn starch samples.
Water chestnuts despite having good nutritional profile have not been explored commercially yet. The underlying reason lies in the fact that water chestnut is highly perishable crop with a short shelf life of 3–4 days. Preparation of flour from water chestnuts is currently done in a traditional manner which leads to very less flour recovery. The products made from such flour are also of poor quality. The optimized preconditioning process not only increases the flour yield, but also alters the starch structure through gelatinization and retrogradation which increases the resistant starch content of the flour. Large-scale production of water chestnut flour obtained after pre-conditioning can be explored for development of different bakery products, snacks, etc., for diabetic patients, celiac disease patients and health conscious people due to its low GI and gluten free nature.
Conclusion
The findings of this research work revealed that optimized preconditioning process can be a relevant approach to increase the resistant starch content and lower the glycemic index and glycemic load in water chestnuts. The Response Surface Methodology undertaken confirmed the significance of all the three preconditioning process variables on dependent variables (flour yield and L* value). The flour recovery of 85.29% with L* value of 81.02 was obtained when water chestnuts were subjected to the optimized conditions of preconditioning i.e., water chestnut:water ratio 1:1.5, water temperature 87.85°C and pre-condition time 45 min. While comparing the optimized pre-conditioning process with traditional method of pre-conditioning (i.e. water chestnut:water ratio 1:0.25, water temperature 80–85°C and pre-condition time 5–6 min), it can be deduced that water chestnut kernels obtained after optimized preconditioning exhibits higher resistant starch content, lower glycemic index and glycemic load which act as important predictors of many chronic health conditions, particularly diabetes. The improved granular homogeneity and ordered crystalline packing in scientifically preconditioned water chestnut flour was confirmed from SEM and AT-FTIR results. Keeping in view the socio-economic impact of water chestnuts, the adoption of optimized preconditioning process for water chestnuts would lead to high flour recovery together with additional health benefits associated with higher resistant starch content and low glycemic index. The results of this study can be taken ahead by conducting in-depth studies on changes in starch morphology and chemistry after preconditioning. Also, the improvement in characteristics of resistant starch through preconditioning need to be validated through in vivo starch digestibility tests in future. The developed water chestnut flour can be explored for development of low GI, gluten free products.
Acknowledgments
The authors acknowledge the guidance Project Coordinator of All India Coordinated Research Project on Post Harvest Engineering and Technology, Indian Council of Agricultural Research (ICAR) New Delhi, India and are thankful to Dr. S. N. Jha, Additional Director General, Process Engineering, ICAR, New Delhi, India for supporting this investigation.
References
- Hummel, M.; Kiviat, E. Review of World Literature on Water Chestnut with Implications for Management in North America. J. Aquatic Plant Manag. 2004, 42, 17–28.
- Anonymous. Water Chestnut Production; Department of fisheries, Jammu and Kashmir Government, Srinagar, J&K, India. 2015.
- Shafi, M.; Baba, W. N.; Masoodi, F. A. Composite Flour Blends: Influence of Particle Size of Water Chestnut Flour on Nutraceutical Potential and Quality of Indian Flat Breads. J. Food Meas. Charact. 2017, 11(3), 1094–1105. DOI: 10.1007/s11694-017-9486-5.
- Wang, S.; Li, C.; Copeland, L.; Niu, Q.; Wang, S. Starch Retrogradation: A Comprehensive Review. Comp. Rev. Food Sci. Food Saf. 2015, 14(5), 568–585. DOI: 10.1111/1541-4337.12143.
- Lockyer, S.; Nugent, A. P. Health Effects of Resistant Starch. Nutr. Bull. 2017, 42(1), 10–41. DOI: 10.1111/nbu.12244.
- Eleazu, C. O.;. The Concept of Low Glycemic Index and Glycemic Load Foods as Panacea for Type 2 Diabetes Mellitus; Prospects, Challenges and Solutions. Afr. Health Sci. 2016, 16(2), 468–479. DOI: 10.4314/ahs.v16i2.15.
- AOAC. Official Methods of Analysis, Association of Official Analytical Chemists, Methods 925.10, 939.03, 18th ed.; USA: Arlington, VA, 2005.
- AACC. Approved Methods of the AACC International. American Association of Cereal Chemists, Methods 08–01, 30–10, 32–07, 46–11A, 44–40, 10th ed.; St Paul, MN: AACC International. 2000.
- Draper, N. R.;. Center Points in Second-Order Response Surface Designs. Technomet. 1982, 24(2), 127–133.
- Şimşek, B.; Đç, Y. T.; Şimşek, E. H. A RSM-Based Multi-Response Optimization Application for Determining Optimal Mix Proportions of Standard Ready-Mixed Concrete. Arabian J. Sci. Eng. 2016, 41, 1435–1450. DOI: 10.1007/s13369-015-1987-0.
- de Paiva, M. J. N.; Menezes, H. C.; Christo, P. P.; Resende, R. R.; Cardeal, Z. An Alternative Derivatization Method for the Analysis of Amino Acids in Cerebrospinal Fluid by Gas Chromatography–Mass Spectrometry. J. Chromatogr. B. 2013, 931, 97–102. DOI: 10.1016/j.jchromb.2013.05.014.
- Myers, R.; Montgomery, D. C. Response Surface Methodology: Process Optimization Using Designed Experiments, 2nd; Wiley: New York, 2002; pp 1–302.
- Goni, I.; Garcia, A. A.; Saura, C. F. A Starch Hydrolysis Procedure to Estimate Glycemic Index. Nutr. Res. 1997, 17, 427–437. DOI: 10.1016/S0271-5317(97)00010-9.
- Salmeron, J.; Manson, J. E.; Stampfer, M. J.; Colditz, G. A.; Wing, A. L.; Willett, W. C. Dietary Fiber, Glycemic Load, and Risk of Non-Insulin Dependent Diabetes Mellitus in Women. Jama. 1997, 277(6), 472–477.
- Deepa, G.; Singh, V.; Naidu, K. A. A Comparative Study on Starch Digestibility, Glycemic Index and Resistant Starch of Pigmented (‘Njavara’and ‘Jyothi’) and A Non-Pigmented (‘IR 64ʹ) Rice Varieties. J. Food Sci. Techn. 2010, 47(6), 644–649. DOI: 10.1007/s13197-010-0106-1.
- Mir, N. A.; Gul, K.; Riar, C. S. Physicochemical, Pasting and Thermal Properties of Water Chestnut Flours: A Comparative Analysis of Two Geographic Sources. J. Food Process. Pres. 2015, 39(6), 1407–1413. DOI: 10.1111/jfpp.12359.
- Shafi, M.; Baba, W. N.; Masoodi, F. A.; Bazaz, R. Wheat-Water Chestnut Flour Blends: Effect of Baking on Antioxidant Properties of Cookies. J. Food Sci. Techn. 2016, 53(12), 4278–4288. DOI: 10.1007/s13197-016-2423-5.
- Singh, B.; Hussain, S. Z.; Sharma, S. Response Surface Analysis and Process Optimization of Twin Screw Extrusion Cooking of Potato‐Based Snacks. J. Food Process. Pres. 2015, 39(3), 270–281. DOI: 10.1111/jfpp.12230.
- Adebowalea, K. O.; Olu-Owolabi, B. I.; Olayinka, O. O.; Lawal, O. S. Effect of Heat Moisture Treatment and Annealing on Physicochemical Properties of Red Sorghum Starch. Afr. J. Biotechn. 2005, 4(9), 928–933.
- Yousaf, K.; Kunjie, C.; Cairong, C.; Abbas, A.; Huang, Y.; Arslan, C.; Xuejin, Z. The Optimization and Mathematical Modeling of Quality Attributes of Parboiled Rice Using a Response Surface Method. J. Food Qual. 2017, 1–13. doi:10.1155/2017/5960743.
- Chung, H. J.; Lim, H. S.; Lim, S. T. Effect of Partial Gelatinization and Retrogradation on the Enzymatic Digestion of Waxy Rice Starch. J. Cer. Sci. 2006, 43(3), 353–359. DOI: 10.1016/j.jcs.2005.12.001.
- Mir, S.; Bosco, S. Effect of Soaking Temperature on Physical and Functional Properties of Parboiled Rice Cultivars Grown in Temperate Region of India. Food Nutr. Sci. 2013, 4(3), 282–288.
- Islam, M. R.; Shimizu, N.; Kimura, T. Quality Evaluation of Parboiled Rice with Physical Properties. Food Sci. Techn. Res. 2001, 7, 57–63. DOI: 10.3136/fstr.7.57.
- Young, R.; Gomez, M. H.; McDonough, C. M.; Waniska, R. D.; Rooney, L. W. Changes in Sorghum Starch during Parboiling. Cer. Chem. 1993, 70, 179–183.
- Messia, M. C.; Iafelice, G.; Marconi, E. Effect of Parboiling on Physical and Chemical Characteristics and Non-Enzymatic Browning of Emmer (Triticum Dicoccon Schrank). J. Cer. Sci. 2012, 56(2), 147–152. DOI: 10.1016/j.jcs.2012.05.006.
- Gani, A.; Haq, S. S.; Masoodi, F. A.; Broadway, A. A.; Gani, A. Physico-Chemical, Morphological and Pasting Properties of Starches Extracted from Water Chestnuts (Trapanatans) from Three Lakes of Kashmir, India. Braz. Arch. Biol. Techn. 2010, 53(3), 731–740. DOI: 10.1590/S1516-89132010000300030.
- Torres, M. D.; Fradinho, P.; Raymundo, A.; Sousa, I. Thermorheological and Textural Behaviour of Gluten-Free Gels Obtained from Chestnut and Rice Flours. Food Bioproc. Techn. 2014, 7(4), 1171–1182. DOI: 10.1007/s11947-013-1132-6.
- Lee, I.; We, G. J.; Kim, D. E.; Cho, Y. S.; Yoon, M. R.; Shin, M.; Ko, S. Classification of Rice Cultivars Based on Cluster Analysis of Hydration and Pasting Properties of Their Starches. LWT-Food Sci. Techn. 2012, 48(2), 164–168. DOI: 10.1016/j.lwt.2012.03.002.
- Ashwar, B. A.; Gani, A.; Wani, I. A.; Shah, A.; Masoodi, F. A.; Saxena, D. C. Production of Resistant Starch from Rice by Dual Autoclaving-Retrogradation Treatment: In Vitro Digestibility, Thermal and Structural Characterization. Food Hydrocoll. 2016, 56, 108–117. DOI: 10.1016/j.foodhyd.2015.12.004.
- Jagannadham, K.; Parimalavalli, R.; Babu, A. S. Effect of Triple Retrogradation Treatment on Chickpea Resistant Starch Formation and Its Characterization. J. Food Sci. Techn. 2017, 54(4), 901–908. DOI: 10.1007/s13197-016-2308-7.
- Zeng, J.; Li, G.; Gao, H.; Ru, Z. Comparison of A and B Starch Granules from Three Wheat Varieties. Mol. 2011, 16(12), 10570–10591. DOI: 10.3390/molecules161210570.
- Soest, V. J. J.; Tournois, H.; de Wit, D.; Vliegenthart, J. F. Short-Range Structure in (Partially) Crystalline Potato Starch Determined with Attenuated Total Reflectance Fourier-Transform IR Spectroscopy. Carbohy. Res. 1995, 279, 201–214. DOI: 10.1016/0008-6215(95)00270-7.
- Chung, H. J.; Liu, Q.; Hoover, R. Impact of Annealing and Heat-Moisture Treatment on Rapidly Digestible, Slowly Digestible and Resistant Starch Levels in Native and Gelatinized Corn, Pea and Lentil Starches. Carbohy. Polym. 2009, 75(3), 436–447. DOI: 10.1016/j.carbpol.2008.08.006.
- Bindels, L. B.; Walter, J.; Ramer-Tait, A. E. Resistant Starches for the Management of Metabolic Diseases. Curr. Opin. Clin. Nutr. Metab. Care. 2015, 18(6), 559. DOI: 10.1097/MCO.0000000000000223.
- Sajilata, M. G.; Singhal, R. S.; Kulkarni, P. R. Resistant Starch–A Review. Compr. Rev. Food Sci. Food Saf. 2006, 5(1), 1–7. DOI: 10.1111/j.1541-4337.2006.tb00076.x.