ABSTRACT
Twenty-four safe dishes for cerebral palsy dysphagic patients and four commercial dysphagia-oriented food products for dysphagia were studied in order to determine their textural characteristics. Apparent viscosity measured at 25, 50, and 100 s−1 and extrusion force analyzed at 1, 2, 5, and 10 mm/s were evaluated. Using clustering techniques, samples were divided into three categories. Apparent viscosity at 50 s−1 and extrusion force at 5 and 10 mm/s could be enough to characterize the safe dishes for dysphagic patients.
Introduction
Dysphagia is the difficulty in swallowing in initial phases (oropharyngeal dysphagia) or the obstruction sensation when the solids and liquids are moving from the mouth to the stomach (esophageal dysphagia). The groups of people most affected are the elderly people, more than 50% of institutionalized elderly population,[Citation1] as well as 60–75% of the patients who undergo radiotherapy for head and neck cancer,[Citation2] and up to 80% of people with neurodegenerative diseases.[Citation3] In some hospitals or geriatrics, 75% of elderly people have nutritionals problems because the oropharyngeal dysphagia is not correctly diagnosed or the diet is not fit for their requirements.[Citation4,Citation5]
The feeding in patients with cerebral palsy (CP) is disturbed by altered swallowing. The CP dysphagia causes several consequences like weight loss, gastroesophageal reflux, choke, and asphyxiate or dehydration risk.[Citation6] Moreover, an inadequate diet causes that the patients with CP have several nutrition problems, with lack of energy, macro and micronutrients.[Citation7–Citation10] Some problems of these diets are the nonfulfillment of the nutritional requirements for the dysphagic patients, the swallowing problems of the foodstuffs, unappealing dishes, and water addition into foodstuffs in order to adapt the texture and, consequently, wastage of part of energy content.[Citation11]
In the clinical field, different guidelines have been developed to determine the safe texture for dysphagic patients. These guidelines establish the texture levels adapted to specific swallowing requirements of individuals with dysphagia. Some guidelines are recognized worldwide but there is no consensus among them. Countries such as UK, Japan, Australia, or USA have their own associations and national guidelines. For that reason, the International Dysphagia Diet Standardization Initiative (IDDSI)[Citation12] has developed globally standardized terminology for texture-modified foods and liquids applicable to dysphagic patients. The IDDSI includes a continuum of eight levels (0–7) identified by numbers and measurement methods. There are five levels (0–4) for drinks classified by the IDDSI flow test (using a syringe), and five levels (3–7) for foods characterized by the IDDSI fork pressure test and by particle size. However, in spite of this categorization and the qualitative description of the levels, it is still difficult and subjective to classify dysphagia-oriented food products (DOFPs) for patients and care givers. Securing safe swallowing is an indispensable part of dysphagia management, so knowing the rheological properties of foodstuffs is fundamental. The National Dysphagia Diet (NDD) developed in the USA,[Citation13] the only national standard to categorize foodstuffs into four levels according to quantified viscosity ranges: nonthickened (0.001–0.050 Pa s), nectar-thick (0.051–0.350 Pa s), honey-thick (0.351–1.750 Pa s), and spoon-thick (>1.750 Pa s). However, it is not known whether viscosity is the only parameter related to bolus flow.
There are few studies referred to puree or semisolid foodstuffs for dysphagic patients. Foegeding et al.[Citation14] reviewed the correlation of the rheological behavior of semisolid or soft foodstuffs with their sensorial perceptions and oral processing. For their part, Moritaka et al.[Citation15] reported that apparent viscosity and yield stress increased when the carrot puree proportion increased in vegetable juice above 17.5%. They observed that the bolus passes through the oropharyngeal cavity at different speeds. Most of the studies on rheological characteristics of fruits and vegetables-based infant purees[Citation16–Citation18] and vegetables purees for general consumption[Citation19,Citation20] were elaborated at different proportions, shear rates, and temperatures. According to these studies, the vegetable purees are non-Newtonian fluids (thixotropic) and the shear rate and temperature have a direct relationship with viscosity. Only three studies evaluated commercial purees with vegetables and other ingredients like meat or fish.[Citation16,Citation21,Citation22] The behavior of these commercial products and vegetables purees was similar. They behaved like thixotropic fluids, which means that the higher the shear rate or temperature of product, the lower the viscosity.[Citation16] The viscosity in commercial purees was influenced by the degree of grinding, the water content, the protein source (meat or fish), the temperature, and the shear rate.
Much of the literature has focused on the physical parameters of the specific DOFPs. However, it should be taken into account that patients eat dishes, which implies a mix culinary of different products. So, the rheology and texture characterization of safe dishes for CP dysphagic patients remain unknown. Therefore, the aim of the present work was to determine the textural characteristics of safe dishes for the CP dysphagic patients and to propose a new classification approach based on clustering techniques.
Materials and methods
Dishes formulations
The dishes analyzed in the present study were selected by ASPACE Navarra (Spanish Cerebral Palsy Foundation, Cizur Menor, Navarra, Spain) as part of an integrated clinical approach for the treatment of patients suffering from CP dysphagia. The texture of these dishes is considered safe by the speech therapists.
A database was established consisting of 12 therapeutic dishes (Appendix A). Some dishes contain seasonal products. For that reason, samples of each therapeutic dish (replicated twice) were elaborated at two seasons (autumn and spring) which represent the range of seasonal products which can be found in the market. It is important to test at these two seasons in order to ensure that the dishes remain safe from a textural point of view for a CP dysphagic patient. Therefore, a total of 24 different therapeutic dishes were analyzed.
The selected dishes were elaborated in ASPACE foundation, and then they were transported to laboratory in isothermal containers. Measurements were made upon when they arrived at laboratory at serving temperature of 23 ± 2ºC (temperature at which these dishes will be consumed by the patients). Moreover, four dysphagia-oriented food commercial products for dysphagia (Nestlé España S.A., Barcelona, Spain) were purchased from a local drugstore. Beef puree, fruit dessert, fruit puree, and gelified water (Appendix A) were selected as representative products.
Apparent viscosity
The rheological measurements were performed using a rotational viscometer (ViscoTester 7R, Haake, Karlsruhe, Germany). The apparent viscosity was analyzed using three different parallel stainless steel plates (type R spindles, with a diameter of 21.1, 14.6 or 3.2 mm and 1.6 mm of width) depending on the rheological properties of the dishes. The samples were poured in a cylindrical glass (5 cm diameter and 7 cm height). Cylindrical specimens were obtained by a cylindrical cutter (5 cm diameter) from each sample.
Steady shear sweep tests were performed to measure the apparent viscosity of the dishes. Firstly, the chosen shear rates for the commercial products were 25, 50, and 100 s−1, as they correspond to the commonly accepted values rates during swallowing.[Citation23,Citation24] According to obtained results for commercial products, two shear rates (50 and 100 s−1) were selected for the therapeutic dishes. All measures were performed over 120 s.
The viscometer was linked to a computer for control and continuous data collection. The Haake Rheowin software (Version Achema 2000, Haake, Karlsruhe, Germany) was used to determine the best mathematical model for the evaluation of the samples. The data, from the 15th second to the final of the test, were treated according to procedures described by Abu-Jdayil[Citation25] and the inverse model was applied to fit the time-dependent curves (η = A+ (B/t)), where η is apparent viscosity (Pa s), A and B are experimental parameters, and t is time (s). The results were expressed in Pa s. The measurements were performed in triplicate at 22 ± 2ºC with different samples used.
Back extrusion test
The back extrusion test was performed in a texturometer TA.XT Plus Texture Analyzer fitted with a 5 kg loadcell (Stable Micro System Ltd., Surrey, England). The 2 kg weight was used to calibration. The samples were transferred into a methacrylate cell (50 mm diameter, 60 mm height; model A/BE), which was filled 50 mm from its height. The sample was back extruded with a 35 mm diameter aluminum cylindrical probe (model P/35) for a distance of 30 mm. Test speeds of probe were set at 1, 2, 5, and 10 mm/s for commercial products, and for the therapeutic dishes two test speeds (5 and 10 mm/s) were selected. Pre-test speed and post-test speed of probe were set at 1.0 and 10 mm/s, respectively. The parameter of the back extrusion test was calculated from the resulting force versus displacement curve: maximum force to extrude at 30 mm (N). Three measurements were carried out for each sample at 22 ± 2ºC and data were collected with Exponent Lite v.6.1. (Stable MicroSystems Ltd, Surrey, UK).
Statistical analysis
The data obtained from measures (n = 6) were analyzed by descriptive and inferential statistic according to procedures described by Devore.[Citation26] Data were analyzed by analysis of variance (ANOVA). Differences between two means were identified using an unpaired t-Student test (p ≤ 0.05). Differences among multiple means were detected by Fisher’s LSD test (p ≤ 0.05). Data from therapeutic dishes and commercial products were assessed by agglomerative hierarchical clustering (AHC) analysis based on the Euclidean squared distance method. The AHC was done establishing arbitrarily three clusters in order to group the dishes with most similar high values in the same parameter (apparent viscosities at 50 and 100 s−1; and extrusion forces at 5 and 10 mm/s). Discriminant analysis was also performed on conjoint parameters (apparent viscosities at 50 and 100 s−1; and extrusion forces at 5 and 10 mm/s) to ascertain which of these variables were most useful in differentiating among the samples. Statistical analysis was carried out by the package SPSS Statistics version 23 (IBM Corp., New York, USA).
Results and discussion
Apparent viscosity
The American Dietetic Association established a standard for dysphagia-oriented products (DOPs). The problem with this guideline is that is based on a steady-state rheological parameter, like apparent viscosity at the shear rate of 50 s−1. So, in the present study three shear rates were studied (20, 50, and 100 s−1), in order to find the best shear rate for this parameter. The apparent shear viscosity for commercial products is summarized in . All commercial products exceeded 1.750 Pa s at any shear rate, therefore they could be classified as spoon-thick according to National Dysphagia Diet Task Force.[Citation13] The fruit puree had the lowest viscosity at the three shear rates (p > 0.05). Beef puree, fruit dessert, and gelified water had higher viscosity values at all shear rates studied and there were significant differences among them (p < 0.05). These results indicate that for commercial products exist different levels of texture within the spoon-thick level. The knowledge of the range above 1.8 Pa s is important to find the textural requirements of foodstuffs for the different levels of dysphagia.
Table 1. Mean values (n = 6) and standard deviations for apparent viscosity values (Pa s) and maximum extrusion force (N) for commercial products for dysphagic patients
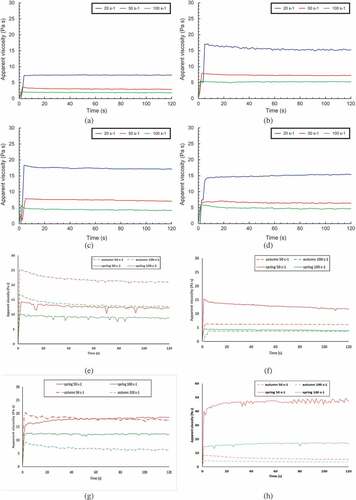
The data plotted in the Appendix B (Figures a–d) show the rheological behavior for the commercial products at the three shear rates of measurement. Every product showed a different profile. However, the apparent viscosity was dependent of the shear rate, so the higher shear rate, the lower viscosity. Likewise, the variability of data was the lowest one when the 100 s−1 shear rate was used. Moreover, an unstable behavior was observed at the shear rate of 20 s−1. For this reason, the shear rates of 50 and 100 s−1 for rheological measurements were only used to analyze the therapeutic dishes.
summarizes the apparent viscosity values of the therapeutic dishes measured at 50 and 100 s−1. All 24 dishes showed a non-Newtonian behavior, that is, as the shear rate increased, apparent viscosity of all the dishes decreased. Previous studies related to DOPs reported the same behavior for the apparent viscosity.[Citation27–Citation30] All therapeutic dishes had apparent viscosity values higher than 1.75 Pa s at 50 and 100 s−1 shear rate, so they could be classified as spoon-thick according to the NDD guideline.[Citation13] As previously reported for the commercial products and according to the obtained results for therapeutic dishes, different levels of texture within the spoon-thick level could be determined. So, the NDD categories become inaccurate to define all classes, as Zargaraan et al.[Citation30] reported in their study. In this sense, Casanovas et al.[Citation21] added a fifth class (pâté class) to conventional NDD classes by flow, thixotropy and oscillatory parameters as criterion for classification of DOPs.
Table 2. Mean values (n = 6) and standard deviations for apparent viscosity (Pa s) and maximum extrusion force (N) for the therapeutic dishes, for cerebral palsy dysphagic patients, elaborated with seasonal products from autumn and spring
The ingredients of the different dishes affected the apparent viscosity parameter at any shear rate, regardless the season (p < 0.05). The lowest apparent viscosity values at 50 s−1 were for cauliflower, pear and peach in syrup, whose appearance were puree and soft firm gel. The highest apparent viscosity values at 50 s−1 corresponded to consommé, vegetable pudding and gazpacho, with appearance of puree, pudding and hard firm gel, respectively. As expected, when the measurements were carried out at 100 s−1, the apparent viscosity values in the same therapeutic dishes were decreased and a similar trend of classification of therapeutic dishes at 50 s−1 was shown. The lowest viscosity value at 100 s−1 was for the pear dish elaborated in autumn (2.2 Pa s) and the highest viscosity value was for the gazpacho dish elaborated in spring (16.8 Pa s).This behavior confirms the conclusions found in different works,[Citation16–Citation18] which stated that the increment in the shear rate decreases the apparent viscosity.
There were significant differences (p < 0.05) due to the seasonal fruits used in the elaboration of the therapeutic dishes. These differences were higher in the dishes whose viscosities were measured at 50 s−1. For instance, the seasonal ingredients increased up eightfold the apparent viscosity values in some dishes as the gazpacho measured at 50 s−1 (autumn: 5.9 Pa s, spring: 47.0 Pa s) as can be seen in the Appendix B (Figure e-h). Moritaka et al.[Citation15] reported that the increase of carrot content, and consequently the carbohydrate content, was associated with an increment of apparent viscosity, which could explain the different apparent viscosity values of therapeutic dishes between seasons that were found in the present study Debussche et al.[Citation31] reported variations in pulp composition in relation to ripeness timing, distribution and fruit type and observed that from summer to winter water and carbohydrate contents decrease. Besides of these textural differences, whereas the therapeutic dishes elaborated in autumn showed a thixotropic behavior, the dishes elaborated in spring showed a rheopectic behavior. In a thixotropic fluid, the structure breaks as it acts the measurement process and apparent viscosity decreases with time. In a rheopectic fluid the structure gets harder as it acts the measurement process and apparent viscosity increase with time.
Representative therapeutic dishes are depicted in the Appendix B (Figures e–h) Except for green bean (Figure f), the products exhibited a non-Newtonian behavior. The samples elaborated in both seasons (autumn and spring) were thixotropic fluids. Conversely, products like gazpacho, lettuce, and salad tomato had a rheopectic behavior at 50 s−1 and 100 s−1. This characteristic appears when the structure of hard gel is broken and become more compact. For this reason, the apparent viscosity increases with the time. It is correct to state that at constant shear rate, the apparent viscosity tends to be constant. This happens when the measurement is longer than 5 min. The behavior becomes constant when the network structure of dishes breaks.[Citation25] The figures in the Appendix B show this trend; the apparent viscosity reached a stable regime from 15 seconds.
There is no study about the range of textures appropriate for CP patients with dysphagia. The only semisolid products that have had textural and rheological characterizations are the purees for infants and some commercial fruit juice, which showed a broad range of apparent viscosity from 0.001 Pa s to values above 75 Pa s.[Citation16–Citation20]
In the present study, the commercial products and therapeutic dishes ranged similar values at both shear rates (50 and 100 s−1). Nevertheless, the apparent viscosity of commercial products was similar to that of therapeutic dishes such as cauliflower, pear, or baked apple.
According to the literature, the level for the shear rate during swallowing varies from 1 to 1000 s−1[Citation15,Citation32,Citation33] and indicates a rate of 10 s−1 to more than 65 s−1 as a normal speed of swallowing.[Citation15] However, pharyngeal shear rate during swallowing likely occurs above 50 s−1, and another shear rate standard is found to measure the food viscosities.[Citation34] For this reason, the revision of the best shear rates for measurement of apparent viscosity for dysphagia products would be necessary. The dishes were better discriminated at 50 s−1 than at 100 s−1 under the experimental conditions of the present study. So, it would be convenient to perform comparative tests at 50 s−1 and at 65 s−1 or even more rates, in order to establish the best shear rate in order to characterize the apparent viscosity of foodstuffs by correctly[Citation15] mimicking the speed of human swallowing.
For individuals who suffer from dysphagia is safer to consume thickened fluids as the bolus transport is slowed down, protecting more time the airway.[Citation35] However, high viscosity fluids could lead to high cohesiveness, which could also cause difficulty to swallow due to high resistance to stretching deformation. Likewise, the cohesiveness of the fluid is related to its maximum extensional viscosity.[Citation36] Therefore, and according to the results obtained in the present study, the apparent viscosity could be used as a standard measure for the DOPs.
Back extrusion test
Back extrusion test provides precise research results and it can be useful for food companies to determine the thickness of their products. The maximum force to extrude at 30 mm (N) for commercial products is reported in the . Test speeds of probe at 1, 2, 5, and 10 mm/s were studied. The fruit puree had the lowest extrusion force at the four test speeds, which means a soft consistency of the product. Moreover, beef puree, fruit dessert, and gelified water had higher extrusion force values at the four test speeds studied. The extrusion force at 1 mm/s for the gelified water and the fruit dessert were was higher than the obtained one for beef puree. The gelified water, beef puree and fruit dessert had similar extrusion force (p > 0.05) at 2 and 5 mm/s, whereas they had different values (p < 0.05) at 10 mm/s. The extrusion force was affected by the test speed, as at higher speed was, the higher extrusion force was recorded for commercial products. This behavior with gelified water can be observed in the . shows different profiles for the extrusion force of the four commercial products, therefore the back extrusion test can be used to classify the products, interpret their structure, their consistency and their behavior. Ettinger et al.[Citation22] proved this theory and established that the extrusion test is necessary for classification the products for dysphagic people.
Figure 1. Comparison of force (N)-time curves of back extrusion test of commercial and therapeutic products for dysphagic patients: (a) gelified water measured at 1, 2, 5 and 10 mm/s; (b) commercial products measured at 10 mm/s (c) therapeutic gazpacho measured at 5 and 10 mm/s; (d) selected therapeutic dishes (elaborated in autumn) measured at 10 mm/s
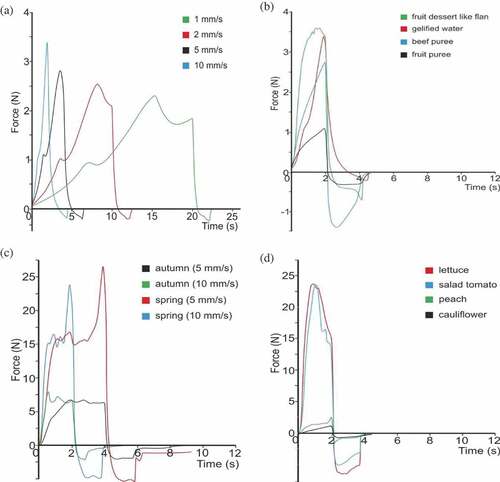
Two test speeds (5 and 10 mm/s) were selected for the back extrusion tests for the therapeutic dishes because these speeds provided enough information to fulfill the aim of this study. The maximum extrusion force values at 30 mm (N) for therapeutic dishes are shown in the . The maximum extrusion force ranged from 1.2 N to 23.5 N at 5 mm/s, and from 1.4 N to 26.6 N at 10 mm/s, whose values corresponded to cauliflower (dish elaborated in autumn) and gazpacho (dish elaborated in spring), respectively for both speeds (5 and 10 mm/s). Likewise Ettinger et al.[Citation22] characterized the texture of three commercial purees of carrot, turkey, and bread, whose values ranged from 0.5 N to 36.5 N at 1.5 mm/s, which are similar results to those obtained for the products of the present study. Moreover, the shows the seasonal differences of extrusion force of gazpacho measured at 5 mm/s and 10 mm/s. The dish elaborated in spring showed higher extrusion force results than those obtained for dish elaborated in autumn, which can be explained due to the variation of composition of fruits according to season. In the d four therapeutic dishes elaborated in autumn, were compared. Salad tomato and lettuce showed higher extrusion force values than those obtained for peach in syrup and cauliflower (p < 0.05).
The tongue of healthy people exerts a force in the range from 5 to 30 N.[Citation37–Citation39] This force is decreased with aging[Citation40–Citation42] and oropharyngeal dysphagia.[Citation43] The range of extrusion force of therapeutic dishes studied in this work was below 30 N, therefore, the safe texture of the dishes used in the present study for patients with CP dysphagia could be validated. However, further research would be necessary to measure the extrusion force of the tongue of CP patients in order to establish the range of extrusion force which these patients are able to exert. Thus, the present study confirms the necessity of a textural standardization and determination of the safe range in order to secure the suitable swallowing of products for dysphagic patients.
Multivariate analysis
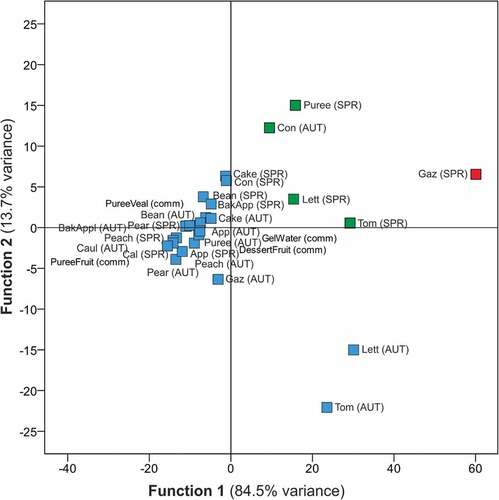
Cluster methodologies are used to classify a large number of samples into clusters or categories according to the similarities and differences among the samples. For the cluster classification of samples, at least two parameters are necessary. So, in the present study, apparent viscosity and back extrusion test were used to classify 28 samples (24 therapeutic dishes and 4 commercial dysphagia-oriented food products) for dysphagic patients in order to minimize the volume of high number of samples. Considering the AHC procedure, the samples were classified into 3 clusters (). The first cluster shows the lowest values in all the parameters. The apparent viscosity ranged from 4.3 Pa s (100 s−1) to 7.6 Pa s (50 s−1) and extrusion force ranged from 4.1 N (5 mm/s) to 4.7 N (10 mm/s). The second cluster was characterized by an apparent viscosity which ranged from 12.9 Pa s (100 s−1) to 24.0 Pa s (50 s−1), and by an extrusion force which ranged from 7.8 N (5 mm/s) to 11.0 N (10 mm/s). Moreover, the third cluster led to the highest values in the parameters analyzed. The apparent viscosity fluctuated between 26.8 Pa s (100 s−1) and 47.0 Pa s (50 s−1), and extrusion force between 23.5 N (5 mm/s) and 26.6 N (10 mm/s). Discriminant analysis was employed in an attempt to classify among the three types of samples established by AHC and based on variables analyzed. Three functions were generated by the analysis. Discriminant function F1 explained 84.5% of the variance and was most closely associated with the apparent viscosity measured at 50 s−1 and the extrusion force analyzed at 5 mm/s. Discriminant function F2 explained 13.7% of the variance and was related to extrusion force measured at 10 mm/s, and function F3 only explained 1.5% of the variance and apparent viscosity analyzed at 100 s−1 was involved. Applying the first two functions to the variables analyzed in the therapeutic dishes and commercial products, the scatterplot in was depicted. The first cluster (blue color dot in the ) was a heterogeneous group composed by safe dishes with different appearances like pudding or soft firm gel. All these components were grouped in the middle of principal components graphic, which means that these values are the lowest one. Three dishes elaborated in spring (puree, lettuce, and tomato) and another dish elaborated in autumn (consommé) were grouped under second cluster (green color dot in the ). This group was grouped between the first and the third cluster. Gazpacho elaborated in spring was separated on a single cluster. shows the square corresponding to the third group (red color dot in the ) at the far right of the discriminant analysis graphic (the highest).
Table 3. Group centroids obtained by agglomerative hierarchical clustering analysis
Figure 2. Plot of the canonical discriminant functions for the apparent viscosity (at 50 and 100 s−1) and extrusion force (at 5 and 10 mm/s) in the commercial products (comm) and the therapeutic dishes for cerebral palsy dysphagic patients elaborated with seasonal products from autumn (AUT) and spring (SPR)
It should be noted that it does not exist a standardized texture for commercial products for dysphagic patients. Casanovas et al.[Citation21] studied 34 commercial products by instrumental and sensorial methods and proposed 5 levels: nectar, honey, pudding, puree, and pâté. In their classification, nectar showed the lowest apparent viscosity, but it was equivalent to honey-thick level according to the NDD.[Citation13] The other four levels proposed by Casanovas et al.[Citation21] showed an apparent viscosity above 1.8 Pa s, which corresponded to spoon-thick level according to the NDD.[Citation13] Moreover, the instrumental methods used in the present study were not the same to those reported by Casanovas et al.,[Citation21] but also three levels have been proposed with apparent viscosity values higher than those for the spoon-thick level correspond to the NDD[Citation13] (1.8 Pa s). Therefore, this work confirms the necessity of a new classification of dishes for dysphagic patients whose viscosities are higher than 1.8 Pa s. In this range there are different textures that must be differentiated and classified to avoid problems in CP patients with dysphagia. Ettinger et al.[Citation22] characterized commercially pureed prepared products using sensory, nutritional and textural analysis and reported that standards are required to homogenize the products, especially regarding the textural components of the products. So, according to the obtained results and the necessity of the definition of secure levels of dishes for cerebral palsy patients, in the a new classification is proposed. Three groups were obtained from instrumental measurements of apparent viscosity and back extrusion test: soft, middle and hard consistency. The consistency is defined by Szczesniak[Citation44] as the “mouthfeel or body characteristics of semi-solid or liquids”. Therefore, according to the results obtained in this study, the higher apparent viscosity and extrusion force values, the thicker the consistency of the product. The textural methods proposed in this the present study would allow to classify products easily with a cost efficient. Furthermore, this classification method, fast and simple, could be used as a complement of sensorial evaluation. Once a dish is set as safe by a sensorial method, it could be classified more quickly at its corresponding level with the textural methods proposed.
The statistical analysis establishes that apparent viscosity analyzed at 50 s−1 furnishes more information than if the shear rate of 100 s−1 is used. Furthermore, less variability and more stable measures are achieved when shear rate of 50 s−1 is used in the viscosity analysis. Besides, it has been established that speeds of probe of 5 mm/s and 10 mm/s are valid speeds for back extrusion test and both are necessary for obtained the appropriate information for classification the dishes. For the classification of dishes for dysphagic patients would be necessary the measurements by the two instrumental methods: apparent viscosity at 50 s−1 and extrusion force at 5 mm/s and 10 mm/s.
Conclusion
This study highlights the importance of including textural parameters in the DPO’s classification. To date, there was no standardized instrumental methodology that allowed a proper characterization of products with safe texture for CP dysphagic patients. The instrumental methods used in the present study have allowed the proper classification of dishes for CP dysphagic patients. Therefore, the results of this study have direct application because this characterization is relevant for healthcare professionals, food technologist, and dysphagic patients.
This study could be the precursor to establish a new secure range and levels of secure dishes for people with dysphagia caused by cerebral palsy. It would be necessary to perform further studies in order to provide complementary information about swallowing process and verify the definitive classification of these safe levels of texture for CP dysphagic patients.
Additional information
Funding
References
- Smukalla, S. M.; Dimitrova, I.; Feintuch, J. M.; Khan, A. Dysphagia in the Elderly. Curr. Treat. Options Gastroenterol. 2017, 15(3), 382–396. DOI: 10.1007/s12603-014-0506-4.
- Kenny, C.; Gilheaney, Ó.; Walsh, D.; Regan, J. Oropharyngeal Dysphagia Evaluation Tools in Adults with Solid Malignancies outside the Head and Neck and Upper GIi Tract: A Systematic Review. Dysphagia. 2018, 33(3), 303–320. DOI: 10.1007/s00455-018-9892-9.
- Takizawa, C.; Gemmell, E.; Kenworthy, J.; Speyer, R. A Systematic Review of the Prevalence of Oropharyngeal Dysphagia in Stroke, Parkinson’s Disease, Alzheimer’s Disease, Head Injury, and Pneumonia. Dysphagia. 2016, 31(3), 434–441. DOI: 10.1007/s00455-016-9695-9.
- Galán Sánchez-Heredero, M. J.; Santander Vaquero, C.; Cortázar Sáez, M.; de la Morena López, F.; Susi García, R.; Martínez Rincón, M. D. C. Malnutrición Asociada a Disfagia Orofaríngea En Pacientes Mayores de 65 Años Ingresados En Una Unidad Médico-Quirúrgica. Enfermería Clínica. 2014, 24(3), 183–190. DOI: 10.1016/j.enfcli.2013.12.009.
- Lindroos, E.; Saarela, R. K. T.; Soini, H.; Muurinen, S.; Suominen, M. H.; Pitkala, K. H. Caregiver-Reported Swallowing Difficulties, Malnutrition, and Mortality among Older People in Assisted Living Facilities. J. Nutr. Health Aging. 2014, 18(7), 718–722. DOI: 10.1007/s12603-014-0506-4.
- Scarpato, E.; Staiano, A.; Molteni, M.; Terrone, G.; Mazzocchi, A.; Agostoni, C. Nutritional Assessment and Intervention in Children with Cerebral Palsy: A Practical Approach. Int. J. Food Sci. Nutr. 2017, 68(6), 763–770. DOI: 10.1080/09637486.2017.1289502.
- Penagini, F.; Mameli, C.; Fabiano, V.; Brunetti, D.; Dilillo, D.; Zuccotti, G. Dietary Intakes and Nutritional Issues in Neurologically Impaired Children. Nutrients. 2015, 7(12), 9400–9415. DOI: 10.3390/nu7115469.
- Romano, C.; van Wynckel, M.; Hulst, J.; Broekaert, I.; Bronsky, J.; Dall’Oglio, L.; Mis, N. F.; Hojsak, I.; Orel, R.; Papadopoulou, A.;, et al. European Society for Paediatric Gastroenterology, Hepatology and Nutrition Guidelines for the Evaluation and Treatment of Gastrointestinal and Nutritional Complications in Children with Neurological Impairment. J. Pediatr. Gastroenterol. Nutr. 2017, 65(2), 242–264. DOI: 10.1097/MPG.0000000000001646.
- Benigni, I.; Devos, P.; Rofidal, T.; Seguy, D. The CP-MST, a Malnutrition Screening Tool for Institutionalized Adult Cerebral Palsy Patients. Clin. Nutr. 2011, 30(6), 769–773. DOI: 10.1016/j.clnu.2011.06.008.
- Peterson, M. D.; Zhang, P.; Haapala, H. J.; Wang, S. C.; Hurvitz, E. A. Greater Adipose Tissue Distribution and Diminished Spinal Musculoskeletal Density in Adults with Cerebral Palsy. Arch. Phys. Med. Rehabil. 2015, 96(10), 1828–1833. DOI: 10.1016/j.apmr.2015.06.007.
- Wright, L.; Cotter, D.; Hickson, M.; Frost, G. Comparison of Energy and Protein Intakes of Older People Consuming a Texture Modified Diet with a Normal Hospital Diet. J. Human Nutr. Diet. 2005, 18(3), 213–219. DOI: 10.1111/j.1365-277X.2005.00605.x.
- Lam, P.; Stanschus, S.; Zaman, R.; Cichero, J. A. The International Dysphagia Diet Standardisation Initiative (IDDSI) Framework: The Kempen Pilot. Br. J. Neurosci. Nurs. 2017, 13(Sup2), S18–S26. DOI: 10.12968/bjnn.2017.13.Sup2.S18.
- National Dysphagia Diet Task Force. National Dysphagia Diet: Standardization for Optimal Care; American Dietetic Association, Ed.: Chicago IL, 2002.
- Foegeding, E. A.; Daubert, C. R.; Drake, M. A.; Essick, G.; Trulsson, M.; Vinyard, C. J.; Velde, F. V. D. A Comprehensive Approach to Understanding Textural Properties of Semi- and Soft-Solid Foods. J. Texture Stud. 2011, 42(2), 103–129. DOI: 10.1111/j.1745-4603.2011.00286.x.
- Moritaka, H.; Sawamura, S.; Kobayashi, M.; Kitade, M.; Nagata, K. Relation between the Rheological Properties and the Swallowing Characteristics of Vegetable Juices Fortified with Carrot Puree. Biosci., Biotechnol., Biochem. 2012, 76(3), 429–435. DOI: 10.1271/bbb.110576.
- Álvarez, E.; Cancela, M. A.; Delgado-Bastidas, N.; Maceiras, R. Rheological Characterization of Commercial Baby Fruit Purees. Int. J. Food Prop. 2008, 11(2), 321–329. DOI: 10.1080/10942910701359424.
- Alvarez, M. D.; Canet, W. Time-Independent and Time-Dependent Rheological Characterization of Vegetable-Based Infant Purees. J. Food Eng. 2013, 114(4), 449–464. DOI: 10.1016/j.jfoodeng.2012.08.034.
- Inarejos-García, A. M.; Mancebo-Campos, V.; Cañizares, P.; Llanos, J. Physical–Chemical Characterization of Fruit Purees and Relationship with Sensory Analysis Carried Out by Infants (12 to 24 Mo). J. Food Sci. 2015, 80(5), E1005–E1011. DOI: 10.1111/1750-3841.12860.
- Balestra, F.; Cocci, E.; Marsilio, G.; Rosa, M. D. Physico-Chemical and Rheological Changes of Fruit Purees during Storage. Procedia Food Sci. 2011, 1, 576–582. DOI: 10.1016/j.profoo.2011.09.087.
- Diamante, L.; Umemoto, M. Rheological Properties of Fruits and Vegetables: A Review. Int. J. Food Prop. 2015, 18(6), 1191–1210. DOI: 10.1080/10942912.2014.898653.
- Casanovas, A.; Hernández, M. J.; Martí-Bonmatí, E.; Dolz, M. Cluster Classification of Dysphagia-Oriented Products considering Flow, Thixotropy and Oscillatory Testing. Food Hydrocolloids. 2011, 25(5), 851–859. DOI: 10.1016/j.foodhyd.2010.07.029.
- Ettinger, L.; Keller, H. H.; Duizer, L. M. Characterizing Commercial Pureed Foods: Sensory, Nutritional, and Textural Analysis. J. Nutr. Gerontol. Geriatrics. 2014, 33(3), 179–197. DOI: 10.1080/21551197.2014.927304.
- Christensen, C. M.;. Food Texture Perception. In Advances in Food Research, Chichester, C. O., Mrak, E. M., Schweigert, B. S., Eds.; Academic Press, 1984; 29, 159–199. DOI: 10.1016/S0065-2628(08)60057-9.
- Sworn, G.;. Xanthan Gum. In Handbook of Hydrocolloids, Second ed.; Phillips, G. O., Williams, P. A., Eds.; 390 Woodhead Publishing Series in Food Science, Technology and Nutrition, Woodhead Publishing, 2009; pp 186–203. DOI: 10.1533/9781845695873.186.
- Abu-Jdayil, B.;. Modelling the Time-Dependent Rheological Behavior of Semisolid Foodstuffs. J. Food Eng. 2003, 57(1), 97–102. DOI: 10.1016/S0260-8774(02)00277-7.
- Devore, J. L.;. Probability and Statistics for Engineering and the Sciences (International Metric Edition), Cengage Learning (EMEA) Ltd: Hampshire (UK), 2016.
- Germain, I.; Dufresne, T.; Gray-Donald, K. A Novel Dysphagia Diet Improves the Nutrient Intake of Institutionalized Elders. J. Am. Diet. Assoc. 2006, 106(10), 1614–1623. DOI: 10.1016/j.jada.2006.07.008.
- Sopade, P. A.; Halley, P. J.; Cichero, J. A. Y.; Ward, L. C. Rheological Characterisation of Food Thickeners Marketed in Australia in Various Media for the Management of Dysphagia. I: Water and Cordial. J. Food Eng. 2007, 79(1), 69–82. DOI: 10.1016/j.jfoodeng.2006.01.045.
- Quinchia, L. A.; Valencia, C.; Partal, P.; Franco, J. M.; Brito-de la Fuente, E.; Gallegos, C. Linear and Non-Linear Viscoelasticity of Puddings for Nutritional Management of Dysphagia. Food Hydrocolloids. 2011, 25(4), 586–593. DOI: 10.1016/j.foodhyd.2010.07.006.
- Zargaraan, A.; Omaraee, Y.; Rastamanesh, R.; Taheri, N.; Fadavi, G.; Fadaei, M.; Mohammadifar, M. A. Rheological Characterization and Cluster Classification of Iranian Commercial Foods, Drinks and Desserts to Recommend for Esophageal Dysphagia Diets. Iran. J. Public Health. 2013, 42(12), 1446–1456.
- Debussche, M.; Cortez, J.; Rimbault, I. Variation in Fleshy Fruit Composition in the Mediterranean Region: The Importance of Ripening Season, Life-Form, Fruit Type and Geographical Distribution. Oikos. 1987, 49(3), 244–252. DOI: 10.2307/3565758.
- Cichero, J. A. Y.; Jackson, O.; Halley, P. J.; Murdoch, B. E. How Thick Is Thick? Multicenter Study of the Rheological and Material Property Characteristics of Mealtime Fluids and Videofluoroscopy Fluids. Dysphagia. 2000, 15(4), 188–200. DOI: 10.1007/s004550000027.
- Steele, C.; Van Lieshout, P. H. M.; Goff, D. The Rheology of Liquids: A Comparison of Clinicians’ Subjective Impressions and Objective Measurement. Dysphagia. 2003, 18(3), 182–195. DOI: 10.1007/s00455-002-0104-1.
- Ong, J. J.-X.; Steele, C. M.; Duizer, L. M. Sensory Characteristics of Liquids Thickened with Commercial Thickeners to Levels Specified in the International Dysphagia Diet Standardization Initiative (IDDSI) Framework. Food Hydrocolloids. 2018, 79, 208–217. DOI: 10.1016/j.foodhyd.2017.12.035.
- Su, M.; Zheng, G.; Chen, Y.; Xie, H.; Han, W.; Yang, Q.; Sun, J.; Lv, Z.; Chen, J. Clinical Applications of IDDSI Framework for Texture Recommendation for Dysphagia Patients. J. Texture Stud. 2018, 49(1), 2–10. DOI: 10.1111/jtxs.12306.
- Hadde, E. K.; Chen, J. Shear and Extensional Rheological Characterization of Thickened Fluid for Dysphagia Management. J. Food Eng. 2019, 245, 18–23. DOI: 10.1016/j.jfoodeng.2018.10.007.
- Miller, J. L.; Watkin, K. L. The Influence of Bolus Volume and Viscosity on Anterior Lingual Force during the Oral Stage of Swallowing. Dysphagia. 1996, 11(2), 117–124. DOI: 10.1007/BF00417901.
- Posen, A. L.;. The Influence of Maximum Perioral and Tongue Force on the Incisor Teeth. Angle Orthodontist. 1972, 42(4), 285–309. DOI: 10.1043/0003-3219(1972)042<0285:TIOMPA>2.0.CO;2.
- Sha, B. F. B.; England, S. J.; Parisi, R. A.; Strobel, R. J. Force Production of the Genioglossus as a Function of Muscle Length in Normal Humans. J. Appl. Physiol. 2000, 88(5), 1678–1684. DOI: 10.1152/jappl.2000.88.5.1678.
- Crow, H. C.; Ship, J. A. Tongue Strength and Endurance in Different Aged Individuals. J. Gerontol. Ser. A. 1996, 51A(5), M247–M250. DOI: 10.1093/gerona/51A.5.M247.
- Mortimore, I. L.; Fiddes, P.; Stephens, S.; Douglas, N. J. Tongue Protrusion Force and Fatiguability in Male and Female Subjects. Eur. Respir. J. 1999, 14(1), 191–195.
- Youmans, S. R.; Stierwalt, J. A. G. Measures of Tongue Function Related to Normal Swallowing. Dysphagia. 2006, 21(2), 102–111. DOI: 10.1007/s00455-006-9013-z.
- Robinovitch, S. N.; Hershler, C.; Romilly, D. P. A Tongue Force Measurement System for the Assessment of Oral-Phase Swallowing Disorders. Arch. Phys. Med. Rehabil. 1991, 72(1), 38–42. DOI: 10.5555/uri:pii:000399939190077V.
- Szczesniak, A. S.;. Classification of Textural Characteristics. J. Food Sci. 1963, 28(4), 385–389. DOI: 10.1111/j.1365-2621.1963.tb00215.x.
APPENDICES
Appendix A. Ingredients and appearance of the commercial products (C) and therapeutic dishes (T), for cerebral palsy dysphagic patients, sorted according to their consistencies.
Appendix B.
Changes in apparent viscosity (Pa s) of selected commercial and therapeutic products (elaborated in spring and autumn) for dysphagic patients as function of shear time: (a) fruit puree; (b) beef puree; (c) gelified water; (d) fruit dessert like flan; (e) consommé; (f) green bean; (g) lettuce; and (h) gazpacho