
ABSTRACT
The freshness of greenback grey mullet (Chelon subviridis) stored at 4ºC for 16 days was assessed using quality index method (QIM), physicochemical, color and microbiological parameters. Results showed that the developed QIM scheme for greenback grey mullet consisted of nine parameters which gave total of 34 demerit points. QI showed a linear relationship to storage time (QIM = 8.167× storage time-7.767, R2 = 0.982), and the remaining storage time could be estimated with an accuracy of± 5 days. The physicochemical, microbiological and sensory data were integrated and used to determine the rejection point. The shelf life of gutted greenback grey mullet stored at 4ºC remains stable for consumption until 12 days of storage.
Introduction
The greenback grey mullet (Chelon subviridis), a marine fish species belonging to the Mullidae family, is one of the valuable fisheries resources in the Persian Gulf. Greenback grey mullet are mainly demanded by consumers as a whole (ungutted) and gutted fish in Iran. Because these species is consumed domestically, it is very important to extend its shelf life. Fish is highly perishable because of high levels of free amino acids and other soluble non-nitrogenous substances in seafood serve as easily digestible nutrients for microbial growth.[Citation1]
From the time of capture, fish is highly susceptible to microbial, chemical and enzymatic deteriorations that lead to changes in sensory characteristics over time, causing ultimate rejection by the consumer and making fish unfit for consumption.[Citation2] In food industry, descriptive Analysis (DA) (Pivot profile, Projective Mapping, Check-all-that-apply (CATA), ….) is a sensorial method which employs trained evaluators selected for the description and quantification of descriptive sensorial attributes of flavor, odor, texture, appearance and it is statistically supported, representing an important tool in quality control of food processing industries.[Citation3,Citation4] The application of descriptive analysis has been reported in some studies on meat.[Citation5] In fishery industry, the quality index method (QIM), developed by the Tasmanian Food Research Unit[Citation6], is a sensory evaluation method based on characteristic changes that occur in raw fish on significant, well-defined characteristic changes of outer appearance attributes (eyes, skin, gills, smell) for raw fish for freshness estimation of fishery products.[Citation7–Citation9] However, it is necessary to have some specific knowledge of sensory panels. A scoring system from 0 to 3 demerit points is given for each quality parameters according to the specific parameter descriptions, which gives scores closer to zero for very fresh fish[Citation10] and consequential increase in the score occurs as the freshness declines. The quality index (QI) is obtained by summing sensory scores for all characteristics.
Specific spoilage organisms, a few members of the microbial community of freshly caught or processed seafood, produce various volatile compounds such as trimethylamine (TMA) and total volatile nitrogen bases (TVB-N), which could function as indicators of spoilage.[Citation11] Physicochemical indexes (pH, trimethylamine (TMA), total volatile nitrogen bases (TVB-N) and thiobarbituric acid reactive substances (TBARS) are used to evaluate the freshness of fishery products. Ludorff and Meyer[Citation12] showed that the acceptable upper limit for the pH of seafood is 6.8–7. The TVB-N limit is 25 mg N/100 g muscle of seafood as the highest acceptable level and above 30–35 mg N/100 g muscle indicate that muscle is decomposed and inedible. Acceptability limit of TMA for various fishery products is 5–15 mg N/100g as a general limit for seafood. The TBARS value of 5 mg malonaldehyde/kg muscle is an acceptable limit, while the seafood may be consumed up to the level of 8 mg malonaldehyde/kg.[Citation13]
Information of the quality index method (QIM) sensory scheme and shelf life of greenback grey mullet stored at refrigerator are not in literature. The results of this study are relevant to describe the QIM of Chelon subviridis. Andrade et al.[Citation14] and Özyurt et al.[Citation15] researched the quality assessment applicable to Mullet (Mugil platanus) and red mullet (Mullus barbatus) through the use of QI, respectively. Implementation of QIM at fish industry provides information on fish quality, therefore, it is important for effective quality and process management in production of high quality of fish products. Aware of the commercial importance of marine fish in Iran, the demands on the quality and the higher perishability, the objective of this study was to develop a quality index method (QIM) scheme for assessing the sensory quality of refrigerated gutted greenback grey mullet Chelon subviridis, correlating the results with physicochemical, microbiological and color changes that occurred during the storage period and estimate the shelf life.
Material and methods
Sample preparation and storage time
Freshly caught greenback grey mullet Chelon subviridis were collected from the Persian Gulf in Khozestan (south Iran). The average weight of fish was 45.8 ± 0.02 g per fish. Immediately after collection, samples were cooled with ice and transported to the Department of Marine Natural Resources, Khorramshahr University of Marine Science and Technology within 1 h. Upon arrival, fish were washed in cold water. After draining, fish weighing approximately 400 g were packed in a zip bag. All samples were placed in polyethylene bags, stored at 4 ± 1°C for 16 days. All samples were taken for microbiological, chemical, and sensory analyses every 4 days for up to 16 days.
Sensory analysis
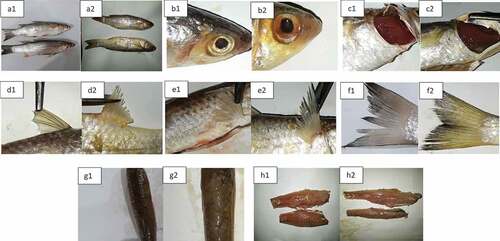
The sensory analysis for the development of QIM for raw fish was based on methods previously described.[Citation16] The QIM scheme for greenback grey mullet lists quality attributes for overall appearance, eyes, gills, fins, caudal fins, dorsal area, abdomen (internally), 2 points are related to the abdomen (externally) and (internally) the muscle. Scores were given for each quality attributes according to descriptions, ranging from 0 to 3. The scores given for all the quality attributes are summarized by the Quality Index, which increases linearly with the storage time in the refrigerator. The preliminary QIM scheme for the sensory evaluation of fish was designed according to pre-observation of fish encompassing: overall appearance; cornea, pupil, shape and eyeball of eye; color and odor of gill, fins; moisture and color of caudal fin; elasticity and color of dorsal; color and odor of abdomen (internal); overall aspect of abdomen (outside); color, odor and firmness of flesh. Seven panelists, which had previously been trained according to ISO 8586[Citation17], experienced in fish freshness evaluation carried out the sensory analysis. Photographs of each stage were taken at the same time and should be used to illustrate quality attributes when introducing the QIM concept for assessing fish quality to the fishery industry (). All analysis was done at baseline (day 0) and at a regular interval of 4 days in triplicate.
Figure 1. Each quality attributes evaluated with QIM scheme for greenback grey mullet (Chelon subviridis) stored on refrigerator over each day analyzed against storage days (1st and 16th day, respectively); A1-A2: overall appearance in 1st and 16th day, respectively; B1-B2: eye in 1st and 16th day, respectively; C1-C2: gill in 1st and 16th day, respectively; D1-D2: fins in 1st and 16th day, respectively; E1-E2: fins in 1st and 16th day, respectively; F1-F2: caudal fin in 1st and 16th day, respectively; G1-G2: dorsal in 1st and 16th day, respectively; H1-H2: flesh in 1st and 16th day, respectively
Microbiological analysis
Fish muscles were collected through the incision on the same side and section of the fish body aseptically by hand, with glows washed with 70% ethanol and put in sterilized containers. All the dissecting apparatuses, such as scalpel, forceps, scissors, knives, mortar, pestle, and glassware, were sterilized with 100% ethanol and kept in a hot air oven at 180°C for 8 h prior to dissection. The muscle samples (25 g) were placed in a stomacher bag containing 225 mL of 0.85% saline water. After mixing for 1 min in a stomacher blender, further serial dilution was done using the same diluent. Thereafter, 0.1 mL of appropriate dilution was used for microbiological analysis by spread plate method. The media and condition used were: a) total mesophilic count (TMC) on pour plates of plat count agar (PCA, Biolife Italian Mascia Brunelli, Italy) incubated for 24 to 48 h at 37°C; b) total psychrotrophic bacteria (TPC) on pour plates of plate count agar (PCA, Biolife Italian Mascia Brunelli, Italy) incubated for 10 days at 4°C.
Physicochemical analysis
Total volatile basic nitrogen (TVBN), trimethylamine (TMA), pH, thiobarbituric acid reactive substances (TBARS) and free fatty acid (FFA) were determined. TVBN (mg/100 g shrimp) was measured using the distillation method.[Citation18] This method was determined by distillation after the addition of MgO to homogenized shrimp samples. The distillate was collected in a flask containing an aqueous solution of boric acid and methyl red as an indicator. Afterward, the boric acid solution was titrated with sulphuric acid solution. The TVB-N value was determined according to the consumption of sulphuric acid. To determine the TMA, 20 mL of 35% formaldehyde was added to 25 mL perchloric acid fish extract prior to the following steps. Thus, TMA was the only volatile and measurable amine.[Citation19] To determine the pH, 10 mL of distilled water was added to 2 g of groundfish. The mixture was homogenized, and the pH was measured in triplicate using a pH meter.[Citation20] To determine the TBARS, 10 g of homogenized sample was added with 97.5 ml of distilled water and 2.5 mL of 4 N HCl. The mixture was heated with steam distillation. Five ml of distillate was added to 5 ml of thiobarbituric reactive reagent containing 0.02 M TBARS in 90% glacial acetic acid and incubated in boiling water for 35 min. After cooling, the absorbance of the pink solution was measured at 538 nm using a spectrophotometer. The constant 7.8 was used to calculate the TBARS number.[Citation21] The TBA value is expressed as mg malonaldehyde/kg sample. To determine the FFA, the Free Fatty Acid content was determined in the lipid extract by Woyewoda’s method. Results were expressed in % of oleic acid.[Citation22]
Color measurements
A Minolta Chroma Meter CR400 (Minolta, Osaka, Japan) was used for color measurements. Colors were expressed as CIELab coordinates. In this system, Lightness (L*) represents the color lightness on a 0–100 point scale from black to white; a* is the position between red (+) and green (-); and b* is the position between yellow (+) and blue (-). The color intensity is expressed by a chroma value (C*ab), while hue (H°ab) corresponds to the name of the color as found in its pure state on the spectrum. These values were calculated according to the formulae:
C*ab = (a*2 + b*2)1/2 and H°ab = arctan (b*/a*), Whiteness = 100- [(100-L)2 + a*2 + b*2]1/2
Statistical analysis
Average were compared through an Analysis of Variance (ANOVA) and effects were considered significant (by Duncan´s test) when p-value ≤0.05. Pearson correlation analysis with 95% of confidence interval was used to determine the relationship between time of refrigerated storage and QI. Results obtained for QIM were then submitted to partial least-squares (PLS) regression. Observed and predicted values by linear regression were used to estimate the uncertainty (standard error of estimate) of the prediction of the QI. Biplot PLS identify the variation storage time (Matrix Y) and demerit points fish (Matrix X). All regressions were calculated using XLSTAT software in 2018. Correlation between mean parameter values over time (in days) was then estimated for each parameter in each developing QIM scheme and used to improve and establish the final QIM scheme. From attitude scales, data were extracted (means and the standard deviation) from consumer’s answers and statistically analyzed through Factor Analysis (FA). Multiple Factor Analysis (MFA), by principal component analysis (PCA)[Citation23], was carried out to determine the importance of each parameter of the QIM scheme and to eventually reject those which were unfitted to describe freshness during storage time. The factors with eigenvalues close to 1 were considered relevant. Furthermore, the attributes with communalities higher than 0.60 were considered significant. The factors with communalities below 0.60 were removed, and the analysis was proceeded again using Varimax rotation.
Results and discussion
Quality index method (QIM)
The resulting QI protocol has 9 quality attributes and 19 parameters for the quality assessment of refrigerator-stored gutted greenback grey mullet Chelon subviridis (). The parameters were scored from 0 to 1, 0 to 2 or 0 to 3, depending on the characteristics observed. The sum of the scores 34 points, from those, 3 points are related to overall appearance, 7 points are related to the eyes, 5 points are related to the gills, 2 points are related to the fins, 3 points are related to the caudal fines, 3 points are related to the dorsal area, 4 points are related to the abdomen (internally), 2 points are related to the abdomen (externally) and 5 abdomen (internally) the muscle. The developed greenback grey mullet Chelon subviridis protocol has a maximum of 34 demerit points, which is close to the protocols for Mullet (Mugil platanus) as cited by Andrade et al.[Citation14] (total demerit points were 33 points). Whereas, the protocols for Mullet differed from those used for Red mullet (Mullus barbatus)[Citation24], in which the QIM had a maximum of 18 demerit points. The use of a higher number of parameters causes a linear evolution of greenback grey mullet Chelon subviridis spoilage during refrigerated storage.
Table 1. QIM scheme for assessing gutted refrigerated storage greenback grey mullet (Chelon subviridis)
The QIM scheme is useful essentially to give a good description of changes in gutted raw greenback grey mullet Chelon subviridis during refrigerated storage. According to Botta[Citation25] linear correlation between quality index (QI) and storage time in chilling may be used to readily predict the remaining shelf life. The sum of the scores given to each of its sensory characteristics on each storage day indicates the QI of greenback grey mullet during refrigerated storage. The QI for greenback grey mullet increased with storage time (). On the first and last days of storage (day 0 and day 16), greenback grey mullet received a QI = 0 and QI = 32.33. The scores given by the trained panelists show that gutted greenback grey mullet has a high freshness status (at 0 to 4 days of refrigerated storage) obtaining a QIM of 0 to 10; the mean QIM is 15.66 at 4 to 8 days; and after 8 days the QIM exceeds 26. The mean scores of day 16 are similar the results appear that the demerit points reached the limit on the 12th day, when members of the panel rejected the samples, making it unfit sensory greenback grey mullet from the 12th day due to the presence of unpleasant odor in gill, abdomen (internal) and flesh. Therefore, the panelists considered the samples of days 12 and 16 were similar. The shelf life of gutted raw greenback grey mullet Chelon subviridis stored at refrigerator was deemed to have been 12 days (QI = 26.33), according to the external attributes of sensory evaluation used (). This result was also confirmed by subsequent microbiological analysis. By the day 12 and 16 of storage, mesophilic count and psychrotrophic count in gutted greenback grey mullet became more than 7 log10 CFU/g[Citation26], which is higher than the maximally recommended limit in raw fish. The time of rejection in this study corroborates to Özyurt et al.[Citation15] who studied using raw red mullet (Mullus barbatus) (11 days of storage on ice), and differs with Bahmani et al.[Citation27] who studied with golden gray mullet (Liza aurata) (14 days of storage at refrigerator).
Figure 2. a.Linear correlation between QIM and storage time of greenback grey mullet (Chelon subviridis) during the refrigerated storage (A); Figure 2b. Partial Least Squares (PLS) regression for Quality Index Method (QIM) of greenback grey mullet (Chelon subviridis) during the refrigerated storage and the predicted values (B)
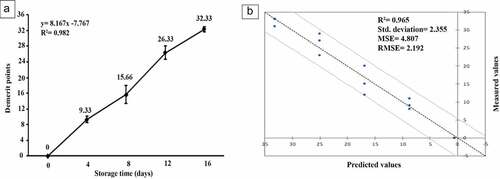
In the final developed QIM scheme, all the parameters showed an increasing linear trend and were highly correlated (R > 0.661) with a time of refrigerated storage (). For each storage day of sampling, QI was calculated and there was a linear relationship with storage time and there were highly correlated (R2 = 0.982) between the total QI for each storage day and days in the refrigerator (). The evaluation of QIM could be expressed by the linear equation QIM = 8.167× storage time-7.767, indicating a good adjustment of the experimental data. PLS model applied to data indicated that the regression model proposed had a standard error of estimate of approximately 5 days (4.807) between measured and predicted values under 95% confidence limit (). The standard error of the QI scheme developed by Andrade et al. (2015) for refrigerated-storage and ice storage of mullet (Mugil platanus) was 1 (0.94) and 2 (2.15) days, respectively.[Citation8]
Table 2. Average scores for each quality parameters assessed with the QIM scheme for greenback grey mullet (Chelon subviridis) stored in the refrigerator and the correlation to days in the refrigerator
shows the progress of all parameters considered during storage. Generally, scores increased during the time of refrigerated storage, and this overall increase was always consistent and with low standard error. Generally, all quality attributes behave similarly during the storage period, without great changes. However, when data are interpreted carefully, it can be observed that the attributes related to the texture, pupil, and eyeball of eye, color of the caudal fin, color and odor of abdomen (internal) and overall aspect of the abdomen (outside) remained stable during the 8 days of storage. There was a high disagreement among panelists on the 12th day of refrigerated storage, and this fact is shown in . In the last day, maximum scores were reached in the all of sensory characteristics except pupil of eye and odor of gill.
Microbial analysis
shows that the total mesophilic (TMC) and psychrotrophic counts (PTC) increased exponentially over storage time. The TMC and PTC count for the greenback grey mullet during the refrigerated storage period correlated with time, yielding very high coefficients (0.971–0.985). The initial (day 0) mesophilic count (3.94 log10 CFU/g) indicates that the greenback grey mullet was of lower quality due to the human handling of fish and storage conditions. By the day 12 of storage, TVC and PTC in greenback grey mullet became more than 7 log10 CFU/g, which is higher than the maximal recommended limit in marine species.[Citation26] The specific bacteria that cause the spoilage of gutted greenback grey mullet have been identified (Bacilli-Gram Negative (Serratia liquefaciens, Aeromonas spp., Pseudomonas spp., Vibrio spp., Klebsiella pneumonia); Bacilli-Gram Positive (Bacillus spp., Corynebacterium spp.) and Cocci-Gram Positive (Staphylococcus aureus, Micrococcus spp., Staphylococcus spp.). The initial PTC in the greenback grey mullet was 3.97 log10 CFU/g. Gram and Huss (1996) reported that the Gram-negative psychrotrophic bacteria are the major group of microorganism responsible for spoilage of chilled stored fish and shellfish.[Citation28]
Table 3. Microbiological evaluation of greenback grey mullet (Chelon subviridis) during refrigerated storage (log CFU/g)
Physicochemical analysis
The changes in the TVBN, TMA, pH, TBARS and FFA values of greenback grey mullet flesh during storage are shown in . TVBN showed a significant correlation with storage time, gradually increasing with each sampling day. According to Castro et al.[Citation29] TVBN index is often used as a method in assessing the shelf life of seafood products. The initial TVBN value was 2.60 mg N/100g flesh and reached to 39.66 mg N/100g flesh after 16 days. The TVBN values increased during the storage time, which took it above the upper limit of consumption on day 12 (30.40 mg N/100g) and is agreed with results found by Mokrani et al.[Citation30] after the 13 days of storage values tended to increase. A rapid increase of TVBN may be related to the degradation of proteins and non-protein nitrogenous compounds. The increase of TVBN through time was in agreement with the microorganism activity during storage. The TVBN exceeded the value of 30 mg N/100g on day 12, which is considered the upper acceptability limit (30 mg N/100g) for fish.[Citation31] In this study, a linear increase (R = 0.976) was observed (TVBN content = 6.930× storage time) with time. Changes in pH of fresh-greenback grey mullet fillets are shown in . The pH of greenback grey mullet on day 0 was 6.87, which was closed to the results by Cai et al.[Citation32], but higher than that of golden-gray mullet (Liza aurata) reported by Bahmani et al.[Citation27] The pH values in greenback grey mullet gradually increased until they reached about 7.12 after 12 days. pH correlates significantly with storage time (r = 0.814). The formation of amines and ammonia derived from microbial activity and degradation of proteins and non-protein nitrogenous compounds lead to an increase in pH value.[Citation33] TBARS values increased with the increase of storage time (P < 0.05), and the highest values (2.19 mg MDA/kg) were obtained on day 16. The increase in TBA during storage may be attributed to the partial dehydration of fish and to the increased oxidation of unsaturated fatty acids.[Citation34] The TBARS value showed significant correlation during storage time. The maximum level of TBARS value indicating the good quality of the fish (frozen, chilled or stored with ice and refrigerator) is 1–2 mg MDA/kg.[Citation35] In this study, lower TBARS values were obtained (<2 mg MDA/kg) up to 12 days of refrigerated storage, which indicated low oxidative rancidity. The initial FFA value was 1.05% of the oleic acid and reached to maximum amount (10.79% of the oleic acid) at the 16th day of storage. The average FFA values remained relatively constant throughout the storage period, in spite of showing significant differences between certain days of the experiment. FFA showed a significant correlation with storage time. The increase of FFA may be attributed to the action of the psychrotrophic bacteria especially Pseudomonas spp can produce lipase and phospholipase causing an increase in FFA.[Citation36] There was a positive correlation between FFA and PTC (R = 0.962). TMA values of fish stored in the refrigerator are presented in . The initial TMA value of greenback grey mullet was 2.53 mg N/100 g sample which increased up to 15.81 mg N/100 g sample at the end of the storage period. Acceptability limit of TMA for various fish species are different: sea bass (5 mg N/100g)[Citation36]; sardines (5–10 mg N/100g)[Citation37]; hake (12 mg N/100g) and 10–15 mg N/100g as a general limit for fish.[Citation20] Such variations in the limit values of fish may be related to the fish species, season, initial bacterial count and storage conditions.[Citation20] TMA showed a significant correlation with storage time.
Table 4. Greenback grey mullet (Chelon subviridis) physicochemical parameter changes during refrigerated storage
Color analysis
Surface color parameters for the greenback grey mullet are shown in . All parameters defining greenback grey mullet color showed no significant correlation with storage time. After 16 days of refrigerated storage, no significant changes were observed in hue (H°ab) values and chroma value (C*ab), indicating no reduction in color intensity and purity. TBA and FFA values were no significant correlated with color parameters. The a* (redness or greenness) and b* (yellowness or blueness) values of greenback grey mullet were positive (yellow color) and had no significant difference at 16 days of refrigerated storage. The W and L* values of fish showed no significant difference during refrigerated storage. W and L* were significantly correlated with TVBN (r = −0.596 and r = −0.563, respectively). Correlation analysis of QIM parameters and color data showed that the clear change in flesh color and redness color of the fish observed by the sensory analysis was not easily detected by a colorimeter.
Table 5. Greenback grey mullet (Chelon subviridis) color parameters (a*, b*, L*, C*ab, Hºab, W) changes during refrigerated storage
Correlation between sensory, bacteriological, physicochemical and color analyses
The correlation between quality parameters of greenback grey mullet stored at refrigerator was further examined by principal component analysis (PCA) to provide a small number of linear combinations (principal components of factors) of a set of variables that retain as much information of the original variables as possible (). The parameters included the attributes used in the QIM protocol, in addition to TMC, PTC, TVBN, pH, TMA, TBARS, FFA and color parameters. In the component analysis, only two vectors were used to explain 79.17%, and the first principal component (PC1) explained 55.90%, while the second principal component (PC2) explained 23.27% of the variations in the quality parameters as a function of storage time. In the principal component analysis, the vectors length corresponds to the relative importance of each quality parameter for the differentiation of samples, that is, the fundamental parameters for determining greenback grey mullet storage time. Thus, the parameters in the order of importance of the vectors are TMC (0.961), PTC (0.978), TVBN (0.963), TMA (0.934), pH (0.924), TBARS (0.925), FFA (0.955), a* (0.631), b* (0.961), L (0.935), C*ab (0.950), Hºab (0.945), W (0.909), sensory (0.983), with their respective factorial loads in parentheses.
Figure 3. Principal Component Analysis (PCA) of the study quality parameters of Greenback grey mullet (Chelon subviridis) stored at refrigerator: (A) the parameters of the quality index as follows: sensory, TMC, PTC, TVBN, TMA, pH, TBA, FFA (B) 1 = day 1, 4 = day 4, 8 = day 8, 12 = day 12 and 16 = day 16
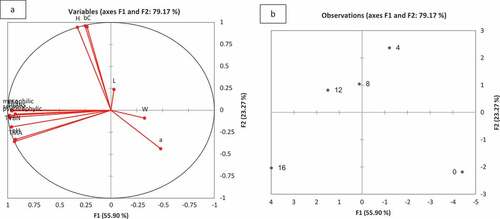
shows the formation of four groups of samples. Samples stored for 0 day are located in the negative PC1 and PC2 quadrants; therefore, it is similar with respect to its freshness. The sample stored for 4 days is located in the negative PC1 quadrant and positive PC2 quadrant, demonstrating that it is different from the previous ones, with lower freshness. Samples stored for 8 and 12 days were located in the positive PC1 and PC2 quadrants, indicating that they were similar to each other and different from the others. Finally, samples stored for 16 days are in the positive PC1 quadrant and negative PC2 quadrant, indicating they are different from the other shrimp samples.
Conclusion
The QIM scheme developed for greenback grey mullet stored at refrigerator consisted of nine parameters giving a potential total of 34 demerit points. The calculated QI showed a linear relationship to storage time (QIM = 8.167× storage time-7.767, R2 = 0.982), which could be used to assess the remaining storage time to an accuracy of± 5 days. There is a significant increase in the results of sensory, physicochemical, and microbiological analyses during storage time. The shelf life of a gutted, refrigerating-stored greenback grey mullet according to bacteriological, physicochemical and results of QIM is 12 days, period in which it is fit for consumption.
References
- Zeng, Q. Z.; Thorarinsdottir, K. A.; Olafsdottir, G. Quality Changes of Shrimp (Pandalus Borealis) Stored under Different Cooling Conditions. J. Food Sci. 2005, 70, 459–466. DOI: 10.1111/j.1365-2621.2005.tb11493.x.
- Huidobro, A.; Pastor, A.; Tejada, M. Quality Index Method Developed for Raw Gilthead Seabream (Sparus Aurata). J. Food Sci. 2000, 65, 1202–1205. DOI: 10.1111/j.1365-2621.2000.tb10265.x.
- Esmerino, E. A.; Tavares Filho, E. R.; Thomas Carr, B.; Ferraz, J. P.; Silva, H. L. A.; Pinto, L. P. E.; Freitas, M. Q.; Cruz, A. G.; Bonili, H. M. A. Consumer-Based Product Characterization Using Pivoit Profile, Projective Mapping and Check-All-That-Apply (CATA): A Comparative Case with Greek Yogurt Samples. Food Res. Int. 2017, 99, 375–384. DOI: 10.1016/j.foodres.2017.06.001.
- Horita, C. M.; Esmerino, E. A.; Vidal, V. A. S.; Farah, J. S.; Amaral, G. V.; Bolini, H. M. A.; Cruz, A. G.; Pollonio, M. A. R. Sensory Profiling of Low Sodium Frankfurter Containing Garlic Products: Adequacy of Polarized Projective Mapping Compared with Trained Panel. Meat Sci. 2017, 131, 90–98. DOI: 10.1016/j.meatsci.2017.05.002.
- Dos Santos, B. A.; Bastianello Compagnol, P. C.; Da Cruz, A. G.; Galvão, M. T. E. L.; Moneteiro, R. A.; Wagner, R.; Pollonio, M. A. R. Check All that Apply and Free Listing to Describe the Sensory Characteristics of Low Sodium Dry Fermentated Sausages: Comparison with Trained Panel. Food Res. Int. 2015, 76, 725–734. DOI: 10.1016/j.foodres.2015.06.035.
- Bremner, H. A.;. A Convenient, Easy to Use System for Estimating the Quality to Chilled Seafood. Fish Process. Bull. 1985, 7, 59–70.
- Ritter, D. O.; Lanzarin, M.; Novaes, S. F.; Monteiro, M. L. G.; Almeida Filho, E. S.; Mársico, K.; Osako, P.; Benjakul, K.; Rawdkuen, S. S. Effect of Protein Concentrations on the Properties of Fish Myofibrillar Protein Based Film Compared with PVC Film. J. Food Sci. Technol. 2016, 53, 2083–2091. DOI: 10.1007/s13197-016-2170-7.
- Li, X.; Chen, Y.; Cai, L.; Xu, Y.; Yi, S.; Zhu, W.; Mi, H.; Li, J.; Lin, H. Freshness Assessment of Turbot (Scophthalmus Maximus) by Quality Index Method (QIM), Biochemical, and Proteomic Methods. LWT- Food Sci. Technol. 2017, 78, 172–180. DOI: 10.1016/j.lwt.2016.12.037.
- Lanzarin, M.; Ritter, D. O.; Novaes, S. F.; Monteiro, M. L. G.; Almeida Filho, E. S.; Mársico, E. T.; Franco, R. M.; Conte, C. A., Jr; Freitas, M. Q. Quality Index Method (QIM) for Ice Stored Gutted Amazonian Pintado (Pseudoplatystoma Fasciatum× Leiarius Marmoratus) and Estimation of Shelf Life. LWT- Food Sci. Technol. 2016, 65, 363–370. DOI: 10.1016/j.lwt.2015.08.019.
- Huss, H. H.; Garantia da qualidade dos productos da pesca. Roma: Organização das Nações para Alimentação e Agricultura Unidase -FAO- Documento técnico sobre as pescas 334, 176pp. 1997.
- Gram, L.; Dalgaard, P. Fish Spoilage Bacteria-Problems and Solutions. Curr. Opin. Biotechnol. 2002, 13, 262–266.
- Ludorff, W.; Meyer, V. Fische und fischerzeugnisse; Paul parey verlag: Berlin, 1973; Vols. 95–111. pp 176–269
- Wetterskog, D.; Undeland, I. Loss of Redness (A*) as a Tool to Follow Hemoglobin-Mediated Lipid Oxidation in Washed Cod Mince. J. Agric. Food Chem. 2004, 52, 7214–7221. DOI: 10.1021/jf0307907.
- Andrade, S. C. S.; Mársico, E. T.; Franco, R. M.; Mano, S. B. Conte Jr, C.A.; Freitas, M.Q.; Cruz, A.G. Effect of Storage Temperature at the Quality Index Methods Scheme and Shelf Life Study of Mullet (Mugil Platanus). J. Food Qual. 2015, 38, 60–70. DOI: 10.1111/jfq.12123.
- Özyurt, G.; Kuley, E.; Özkütük, S.; Özogul, F. Sensory, Microbiological and Chemical Assessment of the Freshness of Red Mullet (Mullus Barbatus) and Goldband Goatfish (Upeneus Moluccensis) during Storage in Ice. Food Chem. 2009, 114, 505–510. DOI: 10.1016/j.foodchem.2008.09.078.
- Sant’Ana, L. S.; Soares, S.; Vaz-Pires, P. Development of a Quality Index Method (QIM) Sensory Scheme and Study of Shelf-Life of Ice-Stored Blackspot Seabream (Pagellus Bogaraveo). LWT-Food Sci. Technol. 2011, 44, 2253–2259. DOI: 10.1016/j.lwt.2011.07.004.
- ISO. Sensory analysis—general guidance for the selection, training and monitoring of assessors. Part 1: Selected assessors, 8586-1. Genf, Switzerland: The International Organization for Standardization. P 1–10. 1993.
- Goulas, A. E.; Kontominas, M. G. Effect of Salting and Smoking-Method on the Keeping Quality of Chub Mackerel (Scomber Japonicus): Biochemical and Sensory Attributes. Food Chem. 2005, 93, 511–520. DOI: 10.1016/j.foodchem.2004.09.040.
- AOAC. Association of Official Analytiacal Chemists 15th. Vol. 35. Washington DC: Chapter 7–9. 1995.
- Masniyom, P.; Soottawat, B.; Visessanguan, W. Combination Effect of Phosphate and Modified Atmosphere on Quality and Shelf-Life Extension of Refrigerated Seabass Slices. J. Food Sci. Technol. 2005, 38, 745–756.
- Siripatrawan, U.; Noipha, S. Active Film from Chitosan Incorporating Green Tea Extract for Shelf Life Extension of Pork Sausages. Food Hydrocoll. 2012, 27, 102–108. DOI: 10.1016/j.foodhyd.2011.08.011.
- Woyewoda, A. D.; Shaw, S. J.; Ke, P. J.; Burns, B. G. Recommended Laboratory Methods for Assessment of Fish Quality. Canadian Technical Report of Fish and Aquatic Science. 1448p. 1986.
- Zar, J. H.; McElroy, W.; Swanson, P. Eds. Biostatistical Analysis; Prentice-Hall Inc: Englewood Cliffs, N.J., 1999. pp 619.
- Bernardi, D. C.; Mársico, E. T.; De Freitas, M. Q. Quality Index Method (QIM) to Assess the Freshness and Shelf Life of Fish. Braz. Arch. Biol. Technol. 2013, 56, 587–598. DOI: 10.1590/S1516-89132013000400009.
- Botta, J. R.;. Sensory Evaluation: Freshness Quality Grading. In Evaluation of Seafood Freshness Quality; Botta, J. R., Ed.; VCH: New York, 1995; pp 65–97.
- Bahmani, Z. A.; Rezaei, M.; Hosseini, S. V.; Regrnstein, J. M.; Böhme, K.; Alishahi, A.; Yadollahi, F. Chilled Storage of Golden Gray Mullet (Liza Aurata). LWT- Food Sci. Technol. 2011, 44, 1894–1900. DOI: 10.1016/j.lwt.2011.01.009.
- ICMSF. Microorganisms in Foods. The International Commission on Microbiological Specifications for Foods of the International Union of Biological Societies; Blachwell Scientific Publications: Oxford, 1986.
- Gram, L.; Huss, H. Microbiological Spoilage of Fish and Fish Products. Food Microbiol. 1996, 33, 121–137. DOI: 10.1016/0168-1605(96)01134-8.
- Castro, P.; Millán, R., .; Penedo, J. C.; Sanjuán, E.; Santana, A.; Caballero, M. J. Effect of Storage Conditions on Total Volatile Bases Nitrogen Determinations in Fish Muscle Extracts. J. Aquat. Food Prod. Technol. 2012, 21, 519–523. DOI: 10.1080/10498850.2011.610917.
- Mokrani, D.; Oumouna, M.; Cuesta, A. Fish Farming Conditions Affect to European Sea Bass (Dicentrarchus Labrax L.) Quality and Shelf Life during Storage in Ice. Aquacult. 2018, 490, 120–124. DOI: 10.1016/j.aquaculture.2018.02.032.
- Connell, J. J.;. Control of Fish Quality;4th; Fishing News Books Limited: London, 1995; pp 245.
- Cai, L.; Wu, X.; Dong, Z.; Li, X.; Yi, S.; Li, J. Physicochemical Responses and Quality Changes of Red Sea Bream (Pagrosomus Major) to Gum Arabic Coating Enriched with Ergothioneine Treatment during Refrigerated Storage. Food Chem. 2014, 160, 82–89. DOI: 10.1016/j.foodchem.2014.03.093.
- Tuckey, N. P. L.; Forster, M., . E.; Gieseg, S. P. Effects of Rested Harvesting on Muscle Metabolite Concentrations and K-Values in Chinook Salmon (Oncorhynchus Tshawytscha) Fillets during Storage at 15 Degrees C. J. Food Sci. 2010, 75, C459–C464. DOI: 10.1111/j.1750-3841.2010.01648.x.
- Kilincceker, O.; Doganl, S.; Kucukoner, E. Effect of Edible Coatings on the Quality of Frozen Fish Fillets. Food Sci. Technol. 2009, 42, 868–873.
- Moini, S.; Tahergorabi, R.; Hosseini, S. V.; Rabbani, M.; Tahergorabi, Z.; Feas, X.; Aflaki, F. Effect of Gamma Radiation on the Quality and Shelf Life of Refrigerated Rainbow Trout (Oncorhynchus Mykiss) Fillets. J. Food Prot. 2009, 72, 1419–1426.
- Nirmal, N. P.; Benjakul, S. Retardation of Quality Changes of Pacific White Shrimp by Green Tea Extract Treatment and Modified Atmosphere Packaging during Refrigerated Storage. Int. J. Food Microbiol. 2011, 149, 247–253. DOI: 10.1016/j.ijfoodmicro.2011.07.002.
- Shahidi, F.; Arachchi, J. K. V.; Jeon, Y. J. Food Applications of Chitin and Chitosans. Trends Food Sci. Technol. 1999, 10, 37–51. DOI: 10.1016/S0924-2244(99)00017-5.