
 ?Mathematical formulae have been encoded as MathML and are displayed in this HTML version using MathJax in order to improve their display. Uncheck the box to turn MathJax off. This feature requires Javascript. Click on a formula to zoom.
ABSTRACT
In this paper, ridgetail white prawn (Exopalaemon carinicauda) quality evaluation was performed by electronic nose (e-nose). Physical/chemical, such as human sensory evaluation (HSE), weight loss, colour, total viable counts (TVC), GC-MS, K value, microbial, and e-nose were persistently tested. Principal component analysis (PCA) and stochastic resonance (SR) were used for measurement data processing. Results suggested that prawn quality persistently decreased due to microbial propagation. GC-MS results demonstrated that the volatile gases emitted by the samples increased during measurement. PCA could not discriminate all prawn samples, and SR eigen values discriminated all samples. Sensitivity evaluation on colour, TVC, weight loss, HSE, GC/MS, K value, and e-nose was made, and results indicated that e-nose presents some advantages including low cost, rapid examination, and good repeatability. E-nose Prawn quality evaluation model was also built for e-nose.
Introduction
Ridgetail white prawn (Exopalaemon carinicauda) has been popular for its multiple nutrition and good taste.[Citation1–Citation3] It has abundant unsaturated fatty acids (such as EPA and DHA).[Citation4–Citation6] However, nutrients within prawn tissues easily decompose and degrade when functioned by autolysis enzymes and microorganisms, leading to quality decrease and economic losses.[Citation7,Citation8]
Physiochemical examination methods could effectively characterize food quality according to corresponding official standards (such as GB in China, and AOAC in USA). However, these methods have fuzzy operations, time-consuming procedure, and complex sample preparation.[Citation9,Citation10] Instrument analysis method presents accurate measurement results.[Citation11] However, it needs expensive instruments and experienced operators. Also, it needs complex sample pre-treatment, limiting its application in food quality rapid examinations.[Citation12]
Much progress has been made on e-nose since it was proposed. It has wide applications in food characterization, medicine exploration, and chemical industry.[Citation13–Citation19] It has better stability and repeatability than human nose. Also, e-nose has advantages including rapid detection, easy operation, and low cost.[Citation14,Citation20,Citation21]
E-nose popular data treatment methods include principal component analysis (PCA), artificial neural networks (ANN), partial least square (PLS), etc.[Citation21] These methods usually suffer from some disadvantages, such as inaccuracy, low training efficiency, etc. Stochastic resonance (SR) belongs to counter-intuitive non-linear dynamic model. This method develops fast in the past decades.[Citation22] SR has been widely applied in abundant fields, such as chemical reaction simulation, signal processing, and artificial intelligence.[Citation23–Citation25]
Sensitivity evaluation study on ridgetail white prawn (Exopalaemon carinicauda) quality examination was investigated in this paper. Physiochemical indexes, such as human sensory evaluation, weight loss, colour, GC-MS, K value, and microbial, were examined for 9 days. E-nose responses to samples were measured. The quality evaluation method was developed.
Materials and methods
Materials
Ice-fresh prawns nearly in the same weight (25.0 ± 5.0 g) were obtained in Hangzhou, China. They were carried to laboratory with ice box, and processed at low temperature (<10°C). Prawn meat was made for experimental samples. The weight of the samples was 10.0 ± 2.0 g. Then samples were packaged with PE membrane and stored at 4°C. Each day, 15 samples were randomly selected for physiochemical tests and e-nose tests. The experiments time was 9d. In validation tests, another 30 samples were selected.
TVC
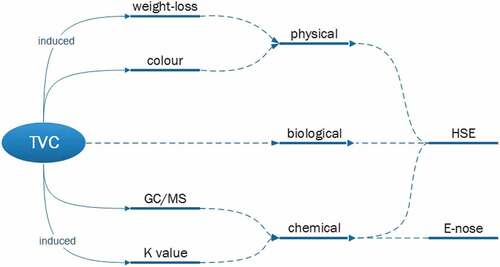
TVC was examined according to AOAC standard protocol.[Citation26] TVC-based prawn quality change characterization pathway is displayed in . The index was presented by logCFU (colony forming units)/g.
Figure 1. TVC-based prawn quality change characterization
Physical
Weight loss was defined by weighing samples before and after storage. The results were exhibited as loss percentage respect to the initial weight. Colour index examination was measured by chromatic meter (TES-135, Taishi Electronics). The colour measurement method could be referred to previous reports.[Citation25]
GC-MS
Agilent 7694E (Agilent Technologies Inc., Santa Clara, USA) was linked to gas chromatography 7890A (Agilent Technologies Inc., Santa Clara, USA) with mass spectrum 5975C (Agilent Technologies Inc., Santa Clara, USA) in the examination. Data was treated by MSD ChemStation. The measurement details could be referred to previous literature.[Citation14,Citation25]
ATP-related compounds and k value
K value is related to ATP and its breakdown products were analysed according to the modified method. The examination method could be referred to previous reports.[Citation25,Citation27]
Human sensory evaluation
HSE was conducted by 6 experienced panelists. The detailed information could be referred to previous report by Li et al.[Citation25]
E-nose system and measurement
) displays the e-nose structure. It contains data measurement unit, sensor combination unit, and supply unit. Sensor combination consists of eight gas sensors with different selectivity towards different gas specie: S1 (TGS-825, sulfide), S2 (TGS-821, flammable), S3 (TGS-826, NH3), S4 (TGS-822, aromatic hydrocarbons), S5 (TGS-842, Cox), S6 (TGS-813, methane), S7 (TGS-2610, propane), S8 (TGS-2201, NOx). ) shows working principal of the sensors. A rounded separated sensor chamber is designed (see )). The distance between the chamber entrance and the circle centre is the same.
Figure 2. E-nose system (a) diagram (U1: controlling unit; U2: sensor array; U3: data collection unit). (b) sensor working principle; (c) gas sensor chamber; (d) SR data treatment diagram
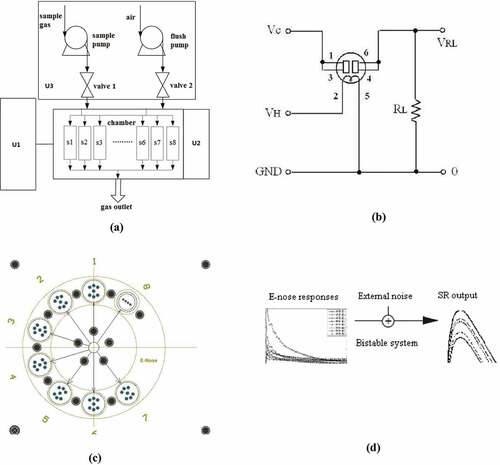
Before measurement, the sample is fixed in a 50 mL air-insulated vial. The vials are equilibrated for 30 min. E-nose was turned on, and the sensor combination are recovered by the gas filtered by active carbon to make the responses of the sensors back to the baseline. Then the measurement is started. The gases emitted by the samples are inhaled in to e-nose at a flux speed of 400 mL/min for 45s. The sampling frequency is 10 Hz.
SR usually contains a bistable system, a coherent input, and a noise source. The definition and system details of SR could be referred to previous literature.[Citation23,Citation24] During the measurement of sensor system, there are aimed sensor signal and intrinsic noise. These two factors are recorded in the e-nose data. In SR analysis, the input signal is e-nose data. External stimulation noise is a virtual parameter, which is coupled into SR model in MATLAB software platform to facilitate an ideal resonance state of SR system. At this resonance state, SR system outputs the optimal SNR parameters. The weak signal can be amplified by adding additional white noise to the SR system. It is demonstrated in numerous research works that the strength of weak signal will increase and that of intrinsic noise will decrease by the cooperation of proper additional external stimulating noise, input signal, and the non-linear threshold system. ) displays the SR analysis pathway.
Results and discussion
TVC
TVC examination results are displayed in ). TVC value is 2.7 log10 CFU/g in day 0, and it grows rapidly with the increase of storage time. TVC value of 6 log10 CFU/g is set as the upper limit of acceptable threshold for prawn freshness. After 6 days storage, TVC value reaches 6.4 log10 CFU/g in day5, which is higher than the upper limit of acceptable threshold. So the sample is non-fresh. The main spoilage microorganisms in postmortem prawns include Shewanella putrefacens, Photobacterium phosphoreum, Pseudomonas, Enterobacteriaceae, and lactic acid bacteria. After postmortem, the microorganisms continuously grow and multiply by utilizing nutrients within fish body, and lead to rapid growth in TVC. Results also demonstrate that microbial spoilage is an important factor in white prawn quality changes.
Figure 3. Physical/chemical indexes (a) TVC; (b) weight loss; (c) GC-MS; (d) K value; (e) HSE
Physical parameters
Weight loss percentage of all groups increases with the increase of storage time, as displayed in ). The weight loss percentage is less than 5% within the first two days. In the following three days, it presents a rapid increase trend and reaches about 18% in day 4, indicating that moisture loss plays an important role in the loss of prawn quality. During the rest four days, weight loss presents a relax trend. It finally reaches about 25% in day8.
Changes in colour parameters including L*, a*, and b* and whiteness are shown in . L* and whiteness of all prawns decrease and a* and b* increase during storage. At the end of storage, whiteness value is 39.46 (nearly lose 25% with respect to the initial value), suggesting that lightness changes obviously during storage. Animal muscle structure, pigment accumulation, and moisture loss are main reasons for meat colour changes. Colour examination results demonstrate that prawn quality decreases with the increase of storage time.
Table 1. Colour results
GC-MS
GC-MS results are displayed in ). Several principal spoilage compounds including trimethylamine (C3H9N), disulfide ethane (C2H6S2), and amyl alcohol (C5H12O) are found in prawn samples. The abundances of these products are relatively low in day 0, suggesting that samples have high freshness. After 2 days of storage, the abundances present rapid growth, and trimethylamine is regarded as the main product. Results demonstrate that the prawn quality decreases with the increase of storage time.
K value
K value results are displayed in ). K value is 6.7% in day 0. Then it rapidly increases and reaches 65.6% in day 8. K value of 60% is defined as the upper limit of acceptable threshold for marine food. Therefore white prawns stored over 6 days are non-fresh, and lost their edible value. When prawns are dead, ATP-related compounds within prawn body degrade when functioned by relevant enzymes. IMP decomposition is regarded as a critical factor inducing rapid increase of K value, as a consequence of 5-nucleotidase catalysis.
K value is defined in Eq. (1). AMP and IMP within in prawn body are generated by ATP degradation and accumulate without being degraded for some time functioned by microbial propagations and related enzymes.[Citation25,Citation27] HxR and Hx are increased. Therefore, prawn quality degradation can be determined by K value. K value increases with the increase of TVC value, indicating good correlation between the K value and TVC value.
HSE
HSE score plan is decided in . The samples are scored according to their appearance, touch, colour, odour and viscidity, and a score of 3.5 is set as the freshness acceptable threshold. The score of all samples is 5 in day 0 (see )). In day 5, preference score decreases to 2.89, which is lower than 3.5 and considered as non-fresh. Due to microbial growth and lipid oxidation, the samples showed spoilage, appearing as off-odour after several days of storage.
Table 2. HSE score attribution
EN experiments results
EN results
EN responses to samples are displayed in ). The sensors present different responses to one sample. Sensor S4 presents the largest responses, and sensor S1 follows. Sensor S2 owns the lowest responses. Sensors in response ascending order are S2, S3, S8, S7, S5, S6, S1, and S4. Diverse responses by different sensor make it possible that EN can imitate human olfactory to realize prawn quality overall evaluation.
Figure 4. E-nose results (a) original responses; (b) PCA; (c) SNR; (d) area calculating method; (e) prawn quality evaluation model
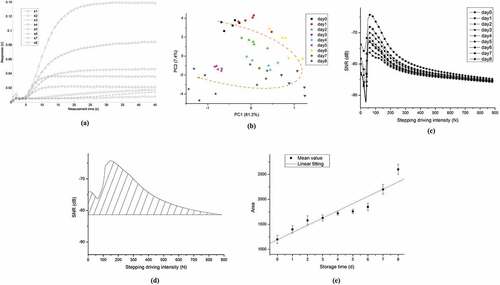
PCA is a kind of popular method in pattern recognition research field. The newly generated variables are used to delegate the original ones after PCA processing. Then the data set can be classified based on the variance in principal component scores. ) displays PCA results. The first 2 principal components (PC 1 and PC 2) explain 88.6% of data variance, covering most of original variables. PC 1 increases, and PC 2 decrease during the first 4 days. After that, these two components inversely change. Some samples overlap with other samples, so PCA can not quantitative discriminate all samples.
SR results
SR SNR as function of white noise intensity is shown in ). Noise intensity ranges between 0 and 900. SNR first increases, and then decreases with the increase of noise intensity. The eigen peaks form at noise intensity of 87. Prawn values under different storage time vary from each other.
values successfully characterize the samples in different quality.
Sensitivity evaluation
To validate the sensitivity of the quality measurement methods, additional experiments are performed. Another 32 samples are prepared and used for validating tests. The results are displayed in . Results demonstrated that the mean error of colour was the largest, and the mean error of e-nose presented the least. The order of the average error from large to small is colour, TVC, weight loss, HSE, GC/MS, K value, and e-nose. A possible explanation lies in the examination style difference of these methods. Colour method heavily depends on the chromatic meter and operations of the testers. The relative position between chromatic meter and the measured samples is hard to be kept during the whole measurement. A slight movement could affect the transmission route of the emitted light, which could bring relatively larger fluctuation to the measurement results. The examination methodology of TVC relies on growth of the microbial on the culture plate. However, the growth and the metabolism of the aimed microbial present heavy randomness, which makes the accuracy and repeatability of TVC measurement difficult. The weight loss index measurement also has such problems, such as size, weight, shape has more or less influence on the results. HSE results depend on the sensory evaluation of the panelists. The situations of these panelists, such as healthy status, age, gender, experiences, etc. have much influence on the decisions made by the panelists. In general, methods of GC/MS, K value, and e-nose all need certain instruments. The instruments are operated as certain rules, so the results of these three methods suffer less mean error than other four methods. Especially, e-nose presents the lowest mean error, indicating it owns more advantages than other methods. Moreover, this method has more advantages such as low cost, rapid examination, and good repeatability (see the SD in ). As a result, e-nose is more suitable for white prawn quality measurement than other methods.
Table 3. Sensitivity evaluation results
Construction of quality evaluation method
We constructed prawn quality evaluation method by utilizing the area parameter enveloped by baselines and SNR curve (see )). With the increase of storage days, the enveloped area increased. ) presented the linear regression results between enveloped area and storage time. The linear relationship between enveloped area and storage time is:
After mathematical derivation, the prawn storage time calculating model can be obtained:
Based on the above experiments and analysis, e-nose presented better prawn quality evaluation sensitivity than physiochemical examination methods. Also, the quality evaluation way using e-nose was developed.
Conclusion
Ridgetail white prawn (Exopalaemon carinicauda) quality examination sensitivity evaluation way was studied in this work. TVC-induced prawn changes in physical, biological, and chemical aspect is proposed. The microbial takes the nutrition and releases the metabolism products, leading to complex changes in prawn meat quality. TVC, weight loss, colour, GC-MS, K value, HSE, and e-nose were continuously examined for 9 days. PCA and SR were used for e-nose data treatment. PCA results did not discriminate all prawn samples, and SR signal-to-noise ratio successfully discriminated all samples quantitatively. Sensitivity evaluation on colour, TVC, weight loss, HSE, GC/MS, K value, and e-nose was made and results indicated that e-nose has more advantages such as low cost, rapid examination, and good repeatability. E-nose is more suitable for white prawn quality measurement than other methods. Prawn quality rapid evaluation way was built based on SR parameters. E-nose is promising in aquatic product quality analysis.
Acknowledgments
This work is financially supported by Scientific Research Project of National Natural Science Foundation of China (Grant No. U1709212), Scientific Research Project of Zhejiang Province (Grant Nos. 2019C02075, LGG18F030006, LGG19F010012, LY19F030023), China College Student Research Programme (Grant No. 105-2013200055), College Student Research Programme of Zhejiang Province.
Additional information
Funding
References
- Shen, X.; Sun, M.; Wu, Z.; Tian, M.; Cheng, H.; Zhao, F.; Meng, X. The Complete Mitochondrial Genome Of The Ridgetail White Prawn Exopalaemon Carinicauda Holthuis, 1950 (Crustacean: Decapoda: Palaemonidae) Revealed A Novel Rearrangement of tRNA Genes. Gene. 2009, 437(1–2), 1–8. DOI: 10.1016/j.gene.2009.02.014.
- Xu, W.; Xie, J.; Shi, H.; Li, C. Hematodinium Infections in Cultured Ridgetail White Prawns, Exopalaemon Carinicauda, in Eastern China [J]. Aquaculture. 2010, 300(1–4), 25–31. DOI: 10.1016/j.aquaculture.2009.12.024.
- Duan, Y.; Liu, P.; Li, J.; Li, J.; Chen, P. Immune Gene Discovery by Expressed Sequence Tag (EST) Analysis of Hemocytes in the Ridgetail White Prawn Exopalaemon Carinicauda. Fish Shellfish Immunol. 2013, 34(1), 173–182. DOI: 10.1016/j.fsi.2012.10.026.
- Li, J.; Han, J.; Chen, P.; Chang, Z.; He, Y.; Liu, P.; Wang, Q.; Li, J. Cloning of a Heat Shock Protein 90 (HSP90) Gene and Expression Analysis in the Ridgetail White Prawn Exopalaemon Carinicauda. Fish Shellfish Immunol. 2012, 32(6), 1191–1197. DOI: 10.1016/j.fsi.2012.03.008.
- Li, J.; Ma, P.; Liu, P.; Chen, P.; Li, J. The roles of Na+/K+-ATPase α-subunit gene from the ridgetail white prawn Exopalaemon carinicauda in response to salinity stresses. Fish Shellfish Immunol. 2015, 42(2), 264–271. DOI: 10.1016/j.fsi.2014.10.043.
- Zhang, J.; Gui, T.; Wang, J.; Xiang, J. The Ferritin Gene in Ridgetail White Prawn Exopalaemon Carinicauda: Cloning, Expression and Function. Int. J. Biol. Macromol. 2015, 72, 320–325. DOI: 10.1016/j.ijbiomac.2014.08.036.
- Duan, Y.; Liu, P.; Li, J.; Wang, Y.; Li, J.; Chen, P. Molecular Responses of Calreticulin Gene to Vibrio Anguillarum and WSSV Challenge in the Ridgetail White Prawn Exopalaemon Carinicauda. Fish Shellfish Immunol. 2014, 36(1), 164–171. DOI: 10.1016/j.fsi.2013.10.024.
- Zhang, C.; Yu, K.; Li, F.; Xiang, J. Acute Toxic Effects of Zinc and Mercury on Survival, Standard Metabolism, and Metal Accumulation in Juvenile Ridgetail White Prawn, Exopalaemon Carinicauda. Ecotoxicol. Environ. Saf. 2017, 145, 549–556. DOI: 10.1016/j.ecoenv.2017.07.075.
- Cheng, J.-H.; Sun, D.-W.; Pu, H.; Zhu, Z. Development of Hyperspectral Imaging Coupled with Chemometric Analysis to Monitor K Value for Evaluation of Chemical Spoilage in Fish Fillets. Food Chem. 2015, 185, 245–253. DOI: 10.1016/j.foodchem.2015.03.111.
- Chun, J.-Y.; Min, S.-G.; Hong, G.-P. Effects of High-Pressure Treatments on the Redox State of Porcine Myoglobin and Color Stability of Pork during Cold Storage. Food Bioprocess. Technol. 2013, 7(2), 588–597. DOI: 10.1007/s11947-013-1118-4.
- Kazemi, S.; Ngadi, M. O.; Gariépy, C. Protein Denaturation in Pork Longissimus Muscle of Different Quality Groups. Food Bioprocess. Technol. 2009, 4(1), 102–106. DOI: 10.1007/s11947-009-0201-3.
- Cheng, W.; Sun, D.-W.; Pu, H.; Liu, Y. Integration of Spectral and Textural Data for Enhancing Hyperspectral Prediction of K Value in Pork Meat. LWT Food Sci. Technol. 2016, 72, 322–329. DOI: 10.1016/j.lwt.2016.05.003.
- Di Natale, C.; Macagnano, A.; Martinelli, E.; Proietti, E.; Paolesse, R.; Castellari, L.; Campani, S.; D’Amico, A. Electronic Nose Based Investigation of the Sensorial Properties of Peaches and Nectarines. Sens. Actuators B Chem. 2011, 77, 561–566. DOI: 10.1016/S0925-4005(01)00705-5.
- Hui, G.; Wang, L.; Mo, Y.; Zhang, L. Study Of Grass carp(Ctenopharyngodon Idellus) Quality Predictive Model Based On Electronic Nose. Sens. Actuators B Chem. 2012, 35, 301–308.
- Hui, G. H.; Wu, Y. L.; Ye, D. D.; Ding, W. W. Fuji Apple Storage Time Predictive Method Using Electronic Nose. Food Anal. Methods. 2013, 6, 82–88. DOI: 10.1007/s12161-012-9414-6.
- Cagnasso, S.; Falasconi, M.; Previdi, M. P.; Franceschini, B.; Cavalieri, C.; Sberveglieri, V.; Rovere, P. Rapid Screening of Alicyclobacillus Acidoterrestris Spoilage of Fruit Juices by Electronic Nose: A Confirmation Study. J. Sens. 2010, 143173, 1–9. DOI: 10.1155/2010/143173.
- Gobbi, E.; Falasconi, M.; Concina, I.; Mantero, G.; Bianchi, F.; Mattarozzi, M.; Musci, M.; Sberveglieri, G. Electronic Nose and Alicyclobacillus Spp. Spoilage of Fruit Juices: An Emerging Diagnostic Tool. Food Control. 2010, 21, 1374–1382.
- Hui, G.; Wu, Y.; Ye, D.; Ding, W.; Wang, L. Study of Peach Freshness Predictive Method Based on Electronic Nose. Food Control. 2012, 28(1), 25–32.
- Gomez, A. H.; Wang, J.; Hu, G. X.; Pereira, A. G. Monitoring Storage Shelf Life of Tomato Using Electronic Nose Technique. J. Food Eng. 2008, 85, 625–631. DOI: 10.1016/j.jfoodeng.2007.06.039.
- Hammond, J.; Marquis, B.; Michaels, R.; Oickle, B.; Segee, B.; Vetelino, J.; Bushway, A.; Camire, M. E.; Dentici, K. D. A Semiconducting Metal-Oxide Array for Monitoring Fish Freshness. Sens. Actuators B Chem. 2002, 84, 113–122. DOI: 10.1016/S0925-4005(02)00011-4.
- Peris, M.; Escuder-Gilabert, L. A 21st Century Technique for Food Control: Electronic Noses. Anal. Chim. Acta. 2009, 638, 1–15. DOI: 10.1016/j.aca.2009.02.009.
- Benzi, R.; Sutera, A.; Vulpiana, A. The Mechanism of Stochastic Resonance. J. Phys. A. 1981, 14, 453–456. DOI: 10.1088/0305-4470/14/11/006.
- Dutta, R.; Das, A.; Stocks, N. G.; Morgan, D. Stochastic Resonance-Based Electronic Nose: A Novel Way to Classify Bacteria. Sens. Actuators B Chem. 2006, 115, 17–27. DOI: 10.1016/j.snb.2005.08.033.
- Gammaitoni, L.; Hanggi, P.; Jung, P.; Marchesoni, F. Stochastic Resonance. Rev. Modern Phys. 1998, 70, 223–287. DOI: 10.1103/RevModPhys.70.223.
- Li, T. T.; Hu, W. Z.; Li, J. R.; Zhang, X. G.; Zhu, J. L.; Li, X. P. Coating Effects of Tea Polyphenol and Rosemary Extract Combined with Chitosan on the Storage Quality of Large Yellow Croaker (Pseudosciaena Crocea). Food Control. 2012, 25, 101–106. DOI: 10.1016/j.foodcont.2011.10.029.
- AOAC. Official Methods of Analysis, 17th ed.; Association of official analytical chemists: Washington, 2002.
- Hernandez-Cazares, A. S.; Aristoy, M.-C.; Toldra., F. Nucleotides and Their Degradation Products during Processing of Dry-Cured Ham, Measured by HPLC and an Enzyme Sensor. Meat Sci. 2011, 87, 125–129. DOI: 10.1016/j.meatsci.2010.09.010.