
 ?Mathematical formulae have been encoded as MathML and are displayed in this HTML version using MathJax in order to improve their display. Uncheck the box to turn MathJax off. This feature requires Javascript. Click on a formula to zoom.
ABSTRACT
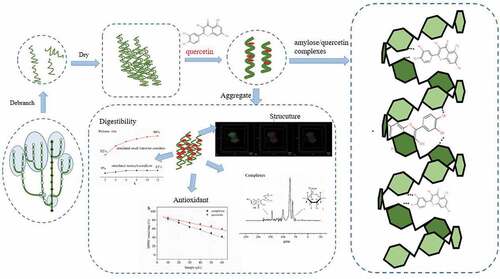
In this study, amylose, known as the food-grade biopolymers has been proved as a feasible solution for the controlled delivery of quercetin. The effect of reaction variables including reaction temperature, time, pH and quercetin addition amount on the content and conversion rate of quercetin was analyzed. Meanwhile, fourier transform infrared spectroscopy (FT-IR) and X-ray diffraction (XRD) provided evidence of quercetin complexation with amylose. Then, the molecular, cluster, and fractal structures of the complexes were investigated using 13C cross-polarization/magic angle spinning nuclear magnetic resonance (13C CP/MAS NMR) and small-angle X-ray scattering (SAXS). Furthermore, laser scanning confocal microscopy (CLSM) identified the precise encapsulation structure from direct observation and scanning electron microscope (SEM) was conducted to show that complexes displayed a larger size granule with smooth and angular appearance. From the antioxidant study, amylose/quercetin complexes presented effective scavenging capacity toward DPPH•. Besides, complexes showed high retention of quercetin in simulated stomach conditions but gradual release in simulated small intestine conditions. It was therefore confirmed that the amylose/quercetin complexes could be served as suitable carriers for the controlled release of quercetin in the digestive tract. The present research expanded the application range of starch, meanwhile proved an alternative application prospect for the ameliorative bioactive quercetin products.
Graphical Abstract
Introduction
In the modern lifestyle, it is well known that nutrition and diet make a contribution to our health. Therefore, one of the advocated approaches to improve the quality of life is to take advantage of functional foods containing natural, bioactive ingredients.[1] Quercetin belongs to a large group of naturally occurring flavonoid compounds found in many fruits and vegetables, as well as olive oil, beans, and red wine.[Citation2] Normally, trace amounts of quercetin from dietary sources exist as the glycoside form, which can be absorbed after glycosylation by intestinal microorganisms and transported to the metabolic conversion system.[Citation3] Recently, it is noted that quercetin and its derivatives have the function of antioxidant and scavenging oxygen free radicals, by which quercetin is able to protect myocardial ischemia, enhance immune function and help blood vessels to dilate.[Citation4] Meanwhile, quercetin also possesses the advantages of non-toxicity and non-carcinogenicity for human body, which has itself been the focus of the attention of many researchers in pharmaceutical and medicine chemistry.[Citation5,Citation6] In spite of this wide spectrum of nutritive properties, its direct introduction into the gastrointestinal tract has proved to be a major technological challenge since its vulnerability, poor bioavailability, and difficult solubility.[Citation7]
Lots of researches have been taken concerning the fabrication of food-grade delivery systems, which aimed to control and target bioactive compounds’ release as well as reinforce their protection against the environment in the human gastrointestinal tract.[Citation8,Citation9] Thereinto, the utilization of carbohydrate has been positively suggested as a technological solution for the controlled delivery of health-promoting ingredients. Over the past two decades, there was the increasing number of researches concerning cyclodextrins (CDs, such as α-CD, β-CD, and γ-CD) in the field of encapsulation.[Citation10,Citation11] In general, the complexation of a guest in a CD cavity consists basically of a substitution of the water molecular by the hydrophobic molecules.[Citation12]
The same as cyclodextrins, amylose offers the possibility for the encapsulation of various molecules due to its structural properties. According to the structural analysis, there are two organizations that compose the amylose chains: the disordered amorphous conformation and helical structure. The latter is made of the double helix (A or B form)[Citation13,Citation14], or a single-helix structure (V-form)[Citation15,Citation16], which is induced in the presence of hydrophobic guest molecules, such as phenols, aromatics, and fatty acids. Especially, in view of its simple and low-cost process, biodegradability and availability, it makes amylose a promising carbohydrate polymer candidate for the delivery of functional ingredients. Nevertheless, in comparison with cyclodextrins, only recently has amylose been systematically studied as a possible vehicle for bioactive compounds.[Citation17,Citation18] As far as we know, few studies have meticulously studied the effects of flavonoid compounds on the functional properties of V-amylose, let alone use their complexes to establish a controlled delivery system. Until now, only a few studies related to the amylose complexes with small aromatic molecules have been reported.[Citation19–Citation22]
In this study, the objective was to fabricate the delivery system for the sustained antioxidant activity and controlled release of quercetin through preparing the amylose/quercetin complexes. Instead of being extracted directly from native starch using precipitation, amylose with enhanced solubility and cost-saving was obtained by hydrolysis of native cassava starch with pullulanase, and the obtained amylose was used for the first time as wall material to encapsulate quercetin by its single-helical structure. The basic process parameters (reaction time, temperature, pH and quercetin addition amount) on the quercetin content and conversion rate were investigated. Furthermore, for a better understanding of the nature and functional properties, the prepared amylose/quercetin complexes were characterized by fourier transform infrared spectroscopy (FT-IR), X-ray diffraction (XRD), Citation13C cross-polarization/magic angle spinning nuclear magnetic resonance (Citation13C CP/MAS), small-angle x-ray scattering (SAXS), laser scanning confocal microscopy (LSCM), and scanning electron microscopy (SEM). Finally, investigation of the antioxidant activity and preliminary evaluation in the delivery application were studied.
Materials and methods
Materials
Cassava starch (QR-CS12) was supplied by Foshan Qirun starch Co. Ltd. (Foshan, China), which was produced according to the industrial standard NY/T 875–2012 in china. Pullulanase (OPTIMAX L300, activity 1,000 ASPU/mL) was obtained from DuPont Genencor® Science. Quercetin was purchased from Sinopharm Chemical Reagent Co. (Shanghai, China). 2,2-di(4-tert-octylphenyl)-1-picrylhydrazyl (DPPH•) free radical was purchased from DuPont Genencor® Science. All other reagents were analytic grade and used without further purification.
Preparation of amylose
Native cassava starch (36 g, dry basis) was mixed with water to form 10 wt% slurry. Then, it was adjusted to pH 4.5 and gelatinized in a thermostatic water bath at 98°C for 1 h. Afterward, cooled the mixture to 60°C and initiated debranched reaction through adding pullulanase (10 ASPU/g dry starch). For fully debranching the starch, the solution was adjusted to pH 4.5 and incubated at 60°C for 4 h. It was noted that the debranched reaction need to be confirmed by Citation1H NMR according to peaks of 4.7–5.0 ppm for α-1,6 linkages and 5.1–5.4 ppm for α-1,4 linkages.[Citation23,Citation24] In this study, when cassava starch was hydrolyzed by pullulanase according to the above procedure, the α-1,6 peak located at 4.7–5.0 ppm disappears altogether (data not shown), indicating that cassava starch has been completely debranched. The hydrolysis percent (18.23%) and blue value (0.93) of the debranched-starch were determined using the methods of Bruner[Citation25] and Gilbert and Spragg[Citation26], respectively. Finally, the temperature was adjusted to 100°C to inactivate enzyme for 20 min. The obtained amylose solution was stored at 60°C for further use.
Molecular weight distribution of prepared amylose
The molecular weight distribution of the prepared amylose was determined by high-performance gel permeation chromatography (HPGPC) equipped with a refractive index detector. The columns used were a 300 × 7.8 mm inner diameter, 10 μm, TSK-GEL G-5000 PWXL, and a 300 × 7.8 mm inner diameter, 5 μm, TSK-GEL G-3000 PWXL, with a guard column of the same material (Tosoh Co., Ltd., Tokyo, Japan). The mobile phase was KH2PO4 (0.02 M) and set at a flow rate of 0.6 mL/min. The temperatures of the column and detector were 35°C and 45°C. The injection volume was 20 μL. Dextrans of various molecular weights (708 000, 344 000, 200 000, 107 000, 47 100, 21 100, 9600, and 5900 Da) were used as standards.[Citation27] The molecular weight of the sample was determined according to the calibration of the standard curve.
Preparation of amylose/quercetin complexes
The prepared amylose was dispersed in the quercetin acetic acid solution (15wt%) at different addition amounts (1%, 2%, 3%, 4%, 5%, 6%, and 7%). Then, pH of the mixture was adjusted to 2, 4, 6, 7, 8, and 9 by addition of 0.5 mol/L NaOH or HCl solution. After the reaction was proceeded at the temperature of 30°C, 40°C, 50°C, 60°C, 70°C, and 80°C for 1, 2, 3, 4, 5, and 6 h, respectively, the mixture was slowly cooled down to room temperature and stored at 4°C for 18 h. Finally, the complexes were obtained after centrifuging, washing, drying, and crushing with 100 mesh sieve. The obtained products under the optimal conditions were used for further analysis. Physical mixtures of amylose and quercetin were also prepared for comparison by simply mixing the solid of quercetin and the solid of amylose at room temperature. Accurately weighed amounts of quercetin and amylose were mixed according to complexed quercetin content, using a blender at 25 rpm during 1 min.
Quercetin content and quercetin conversion rate
Twenty-milligram complexes were dissolved with 60% ethanol solution at 25°C for a period of 24 h. The quercetin of complexes were quantified by UV spectrophotometry at 371 nm according to the previous report.[Citation28] Finally, the content of quercetin in complexes was calculated by the following equation:
where X (mg/g) is the quercetin content of complexes sample, C (mg/mL) is the concentration of quercetin of complexes. V (mL) is the volume of sample solution, N is the dilution multiple and m (g) is the quality of complexes sample. The quercetin conversion rate in complexes was calculated by the following equation:
where Y (%) is the quercetin conversion rate of complexes sample, m1 (g) is the quality of prepared complexes, X (mg/g) is the quercetin content of complexes sample and m2 (g) is the quality of quercetin used in the reaction.
FT-IR analysis
FTIR spectra were obtained using an EQUINOX-55 FTIR spectrometer (Bruker, Germany) using KBr disk technique. The spectral regions were recorded at a resolution of 4 cm−Citation1, 32 scans, and wavelength range was between 600 and 4000 cm−Citation1.
XRD determination
Before XRD analysis, samples were sealed in a vessel at 75% relative humidity using saturated sodium chloride. X-ray diffraction was carried out by a Philips PW 3020 powder diffractometer (Rigaku, Japan). The operating conditions were Cu Ka1 radiation (0.154 nm), voltage 40 kV and current 40 mA. A quantity of 200 mg of sample powders was loaded onto an aluminum plate. Samples were scanned over the range 5–35° 2θ in steps of 0.02° 2θ per 4 s. The relative crystallinity of starch was calculated as follows:
where Aa and Ac are the crystalline area and amorphous area on the XRD.
13C CP/MAS NMR determination
Citation13C CP/MAS NMR experiments were conducted using a Bruker AVANCE 400 MHz spectrometer (Bruker, Switzerland) operating at 100 MHz by using a standard broadband MAS probe for 4 mm rotors. Samples (100 mg) were packed in a 4 mm zirconia rotor and spun at 5 kHz. The spectra were harvested at 25◦C with a pulse sequence of CP TOSS and a spectral width of 295.8 ppm, contact ion time of 17 ms and a relaxation delay time of 2 s. All chemical shifts were reported in parts per million (ppm).
SAXS analysis
SAXS measurements were performed using a SAXSess small-angle X-ray scattering system (Anton Paar, Austria), operated at an acceleration voltage of 40 kV and current of 50 mA. A Cu Kα radiation with a wavelength of 0.1542 nm was used as X-ray source. Prior to analysis, all samples used for the experiments were prepared by mixing the starch with distilled water and equilibrated at ambient temperature for 24 h; the total moisture content of each sample was 60%. Each sample then was filled into a capillary of 0.01 mm wall thickness, the sample-to-detecter distance was 261.2 mm, and the temperature was kept at 26°C during the measurement. The data were collected by the IP reader software and read out by a Perkin-Elmer storage phosphor system. The background and smeared intensity were removed by applying the data to the SAXSquant 3.0 software. The average repeat distance (i.e. thickness of semicrystalline lamellae) of the amorphous and crystalline lamellar of each sample can be calculated as
where d (nm) is the lamellar repeat distance and q (nm−Citation1) is the scattering vector[Citation29]; the relationship between q and θ can be calculated as
where λ (nm) is the wavelength of the X-ray source and 2θ is the scattering angle.
LSCM analysis
0.001 g of Nile Blue was dissolved with 10 mL deionized water. 0.001 g of Nile Red was dissolved with 10 mL 1,2-propylene glycol. 0.005 g of sample powder was added into 20 μL Nile Blue and 20 μL Nile Red.[Citation30] The sample was immediately mixed well with vortex mixer. The sample was adequately stained in the dark place. Sample slides were prepared and measured using laser scanning confocal microscopy (Carl Zeiss, Germany) at the excitation wavelength of 488 nm and 633 nm, respectively.
SEM analysis
The surface morphologies of samples were examined by a model 1530VP scanning electron microscope from dry powders sputtered with gold-layer at an acceleration voltage of 7 kV.
Antioxidant activity
The antioxidant activity was measured by DPPH• assay.[Citation31] In its radical form, DPPH• absorbs at 517 nm, but upon reduction by an antioxidant, its absorption decreases. A methanolic solution of the radical DPPH• was prepared and protected from light. The stock solution of amylose, quercetin, amylose/quercetin physical mixtures and amylose/quercetin complexes (5% w/w) were prepared in 50% dimethylsulfoxide (DMSO) and kept in the dark at 4°C. The final assay mixture kept quercetin concentration of 0.25 mM. Samples were added to 60 μM DPPH• ethanolic solution. After the reaction reached equilibrium, the absorbance at 517 nm was recorded. The blank reference cuvette contained ethanol. All measurements were performed in triplicate. In order to compare the antioxidant capacity of quercetin and complexed quercetin, the antioxidant capacity at different concentrations of quercetin was measured. The percentage of DPPH• remaining at the steady state was calculated as:
A0 and Af correspond to the absorbances at 517 nm of the radical at the beginning and at steady state, respectively.
Digestion tests
Digestion tests in simulated stomach condition and small intestine condition were performed according to previous literature[Citation32] with little modification. The release of quercetin from the complexes in simulated stomach conditions was tested by incubating the amylose/quercetin complexes (50 mg) with 2 mL of HCl (pH = 2) at 37°C for 2 h under continuous stirring. The release of quercetin from the complexes in simulated small intestine conditions was tested by incubating the amylose/quercetin complexes (50 mg) with 2 mL of pancreatin solutions (pH 6.9, pancreatin activity 50 U/mg) at 37°C for 24 h. The amount of quercetin released following the simulated stomach and simulated small intestine conditions was measured by extracting the reaction substrate (after freeze-drying) with n-hexane, and the quercetin content was measured by UV spectrophotometry at 371nm. The release rate (R) of quercetin was calculated as:
where m1 (g) is the quantity of released quercetin and m0 (g) is the quercetin content of the complexes.
Results and discussion
Optimization for the preparation of complexes
As is shown in Figure S1 and Figure S2, the molecular weight of the prepared amylose was determined to be 19995 Da. The effects of reaction variables (temperature, time, pH and the addition amount of quercetin) on the content and conversion rate of quercetin were analyzed and the results are presented in . As shown in ), the quercetin content and conversion rate displayed a gradual uptrend with the reaction time increases. As the reaction time went from 1 to 6 h, the quercetin content and conversion rate elevated from 17.61 to 38.43 mg/g and 36.79% to 82.80%, respectively. It was worth noting that the quercetin content and conversion rate sustained unchanged in the case that reaction time was longer than 4 h, which interpreted that amylose and quercetin probably reacted completely at around 4 h. For this reason, the time of 4 h was chosen as the optimal value.
Figure 1. Effect of reaction parameters on quercetin content and conversion rate. (a) Reaction time Citation1, (b) Reaction temperature Citation2, (c) Reaction pH Citation3, (d) Addition amount of quercetin Citation4. Citation1 Other reaction conditions: reaction temperature 60°C, pH 6.0, addition amount of quercetin 5% Citation2 Other reaction conditions: reaction time 4 h, pH 6.0, addition amount of quercetin 5% Citation3 Other reaction conditions: reaction time 4 h, reaction temperature 60°C, addition amount of quercetin 5% Citation4 Other reaction conditions: reaction time 4 h, reaction temperature 60°C, pH 6.0
Similarly, the reaction temperature can influence the complexation reaction. The easy retrogradation of amylose accompanying with the declined diffusion rate of reactive materials comes to appear in the case of low temperature, which has a bad effect on the reaction efficiency. This theory is in agreement with our experimental data presented in ). Increasing reaction temperature to 60°C, the quercetin content and conversion rate reached the highest value of 38.43 mg/g and 82.80%, respectively. However, it hardly changed the quercetin content and conversion rate even if the temperature was above 60°C. Similar conclusion was drawn by Tomasik et al.[Citation33] who proved that excessive high temperature might even cause the reaction inhibition. Therefore, 60°C was chosen as the optimal reaction temperature.
The changing trend of quercetin content and conversion rate with pH are presented in ), where both variables went up with the increase of pH value from 2 to 6. This phenomenon was probably related to the solubility and stability of quercetin. On the one hand, quercetin molecules are stable under weak acid condition.[Citation34] On the other hand, the water-solubility of the quercetin is obviously affected by pH which is the foundation of the encapsulation. Quercetin is nonionized and the solubility is consistently low at relatively low pH values (pH<6); the solubility increases greatly when pH value is greater than 6. However, as the pH is increased (pH>6), the hydroxyl groups become progressively ionized. As the ionized hydroxyl groups increased, the quercetin molecules became increasingly negatively charged, which may account for the poor stability under alkaline condition.[Citation34] Considering these reasons, 6 was chosen as the optimal pH value.
From ), the addition amount of 5% was the turning point for both the changing trend of quercetin content and conversion rate. Quercetin content firstly increased and tended to be constant at the addition amounts of 5%. Meanwhile, quercetin conversion rate declined sharply at the same addition amount after the initial steady trend. This result was explained by the fact that the complexation degree was limited due to saturated complexation sites when the amount of quercetin was beyond 5%. Therefore, the 5% was chosen as the optimal quercetin amount.
FT-IR spectra and XRD analysis
As a common analysis tool, FT-IR spectrum is applied to confirm the formation of complexes. ) illustrates the FT-IR spectra of quercetin, amylose, amylose/quercetin physical mixtures, and amylose/quercetin complexes (5% w/w), respectively. As shown in the FT-IR spectrum of quercetin, the O-H stretching vibration absorption peak of 3446 cm−Citation1 was wide, which was consistent with phenolic hydroxyl groups existed in the quercetin molecule.[Citation35] From the spectrum of amylose, there was the stretching vibration peak of O-H and saturated C-H and bend vibration peak of O-H at 3446 cm−Citation1, 2928 cm−1 and 1648 cm−Citation1, respectively. Additionally, three absorption peaks of 1018 cm−Citation1, 1096 cm−Citation1, 1164 cm−Citation1 observed in the fingerprint region was attributed to the primary alcohol, secondary alcohols, and tertiary alcohol, respectively. The FT-IR spectrum of the physical mixture showed approximate superimposition of the individual spectrum of quercetin and amylose. The FT-IR spectrum of the amylose/quercetin complexes was almost the same as that of the amylose, suggesting that they had the same basic skeleton. However, as compared to the physical mixture which had shoulder peaks at 1657 cm−Citation1 and 1616 cm−Citation1, the amylose/quercetin complexes only had one absorption peak at 1654 cm−Citation1. Furthermore, compared to the physical mixture, the C = O stretching vibration peak of the quercetin was apparently weakened; the reason may be the part of the C = O bonds were covered by amylose after the complexation. The hydroxyl groups stretching vibration of quercetin at 1351 cm−Citation1 was apparently weakened and a new peak of the C-O- stretching vibrations at 1264 cm−Citation1 was observed. It revealed that a tight-fitting of quercetin molecules within the amylose cavity would restrain these molecular vibrations, leading to the diminution in the intensities of their absorption bands. We can see the similar results in Cheng’s studies who investigated the complexation between debranched-starch and phosphatidylcholine.[Citation36]
Figure 2. (a) FT-IR and (b) X-ray diffraction spectra of (a) quercetin, (b) amylose, (c) amylose/quercetin physical mixtures and (d) amylose/quercetin complexes (5% w/w)
X-ray diffraction was used to further investigate the crystalline nature of samples. As shown in ), the obvious diffraction peaks at 5.7°, 10.2°, 12.1°, 17.3°, and 26.8° demonstrated that quercetin had a well-formed crystalline structure and well-organized atomic arrangement, its corresponding relative crystallinity (RC) of quercetin calculated by EquationEquation (3)(3)
(3) was 77.23%. Meanwhile, the diffraction pattern in ) showed after the gelatinization, enzymatic hydrolysis, and retrogradation process, amylose presented an A-type crystal structure because of its main diffraction peaks at 15.3°, 17.3°, 18.1°, and 23.1°.[Citation37] However, the RC of amylose was 58.01%, which indicated that the size of the overall crystals of amylose became smaller and crystal structure tended to irregularity after the debranch process. The amylose fraction occurs in double-helical A- and B-amylose and the single-helical V-amylose.[Citation38] Most studies have reported on B-amylose and V-amylose instead of A-amylose while Hsien-Chih H W has successfully reported the crystal structure of A-amylose was to be double helical. Pure amylose can crystallize in both A- and B-polymorphic forms and the crystal structure of A-amylose is based on parallel-stranded, right-handed double helices.[Citation39] As presented in ,c), the diffraction peaks of amylose/quercetin physical mixtures were at 15.3°, 17.1°, 18.1°, 22.9°, 23.1°, and 26.8°. It presented the simple superposition of amylose and quercetin, which not only retained diffraction peaks of A-type crystal structure (15.3°, 17.3°, 18.1°, and 23.1°) but also showed the characteristics of quercetin (26.8°).[Citation40] Comparatively, the significant modification of diffraction pattern appeared in amylose/quercetin complexes (Figure 2Bd), where the typical diffraction peak of quercetin (26.8°) has disappeared and the main diffraction peaks at 7.1°, 10°, 13.8°, 15.5°,17.1°, and 22.9°confirmed that complexes belonged to V6ΙΙΙ type crystal structure.[Citation19,Citation41] In addition, there also exists A type crystal structure in the complexes due to the peaks at 15.5°, 17.1°, 18.1°, 22.9° which is similar to the pure amylose. The reason may be that the complexation between amylose and inclusion complexes is a reversible process.[Citation39] So the particles contain both V and A type crystal structural. In general case, V6 amylose containing six glucose units per turn accounts for the predominant proportion of V amylose family.[Citation5,Citation19] In addition, V6 family consists of three types of known structures: V6Ι, V6ΙΙ, and V6ΙΙΙ, depending on the existing form of guest molecule between helices. For small molecules, such as salicylic acid or quinoline, they preferred to be located within the helix cavity and thus formed V6Ι structure with amylose. However, for larger molecules, such as 1,5-decanolactone and linalool[Citation36,Citation42], they induced the V6ΙΙ and V6ΙΙΙ form, where the parts of guests were trapped between amylose helices.[Citation43] Based on this, the quercetin, bulky and aromatic molecule, was inclined to be trapped within or between the amylose helices. In addition, the RC of complexes was 74.66%, which indicated that complexes were more organized compared to the amylose.
13C CP/MAS NMR analysis
It is necessary to take advantage of Citation13C CP/MAS spectra to clarify the precise location of quercetin in amylose after getting a general idea from FT-IR and XRD. Therefore, the Citation13C CP/MAS spectra of quercetin, amylose, amylose/quercetin physical mixtures and complexes (5% w/w) are conducted and presented in and Table S1. From serial number of the peaks corresponded to the carbon atoms of the molecular formula, it was easy to find that the peaks of amylose were assigned as follows: 61.46 ppm, C-6; 71.78 ppm, C-2, 3, 5; 82.65 ppm, C-4; and 102.26 ppm, C-1; the peaks located at 145.36 ppm were attributed to B aromatic ring carbon atoms C-3ʹ,4ʹ of quercetin. The amylose/quercetin physical mixtures presented an equivalent spectrum as the individual counterparts, which inferred the lack of interaction in the physical mixtures as expected. This was exactly same as what was happening in XRD and FT-IR spectra. Unlike physical mixtures, the spectrum of amylose/quercetin complexes displayed typical characteristics, of which the C-4 peak at 80.78 ppm was gentler and moved downfield, whereas the peak of C-1 became sharper. The change of C-1 and C-4 were more remarkable because amylose backbone was connected by α-1,4-glycosidic bonds, resulting in the sensitivity of C-1 and C-4 to the variation of conformation.
Figure 3. Citation13C CP/MAS spectra of (a) quercetin, (b) amylose, (c) amylose/quercetin physical mixtures, and (d) amylose/quercetin complexes (5% w/w). Inset in Fig. 3: Citation13C CP/MAS spectra of (c) and (d) in the range of 60–110 ppm (upper left), Citation13C CP/MAS spectra of (a) and (d) in the range of 120-180ppm (lower left)
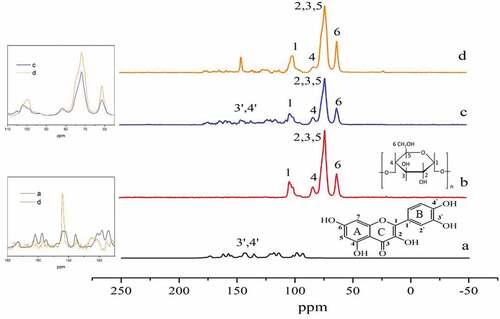
After the quercetin complexation with amylose, the peaks of the amylose showed slightly reduced splitting and increased broadening (see upper-left inset in ), which indicated the crystals had adopted more symmetric and possibly dynamic conformations according to the Koontz.[Citation35] Meanwhile, most peaks of the quercetin signals were considerably gentler compared to the spectra of quercetin (see lower-left inset in ), it suggested that quercetin molecules existed in a bit disordered and more amorphous environment after complexation, which was in line with XRD results. However, interestingly, the peak (143.82 ppm) corresponding to C-3ʹ,4ʹ in B aromatic ring of the quercetin was sharper instead. This phenomenon indicated that a change in the conformation of B aromatic ring to an ordered state through hydrophobic interaction, which further complemented the results of FT-IR analysis that it was not only carbonyl but also hydroxyls of C-3ʹ,4ʹ in B aromatic ring of quercetin that took participation in the formation of intermolecular hydrogen bonding with amylose. Similar studies were down by Yan[Citation39] using the experimental NMR and molecular dynamics simulations suggesting that the B-ring, C-ring, and part of the A-ring of quercetin display favorable interaction with the hydrophobic cavity of the cyclodextrin. So we guess that the aromatic B-ring of quercetin fully entered into the single-helix structures. It keeps constant direction and cannot rotate around as a result of two hydrogen bonds.
SAXS analysis
In order to characterize of the cluster and fractal structure, the SAXS of (a) native cassava starch, (b) amylose, and (c) amylose/quercetin complexes were performed and are presented in . Native cassava starch showed one characteristic peak at about q = 0.64 nm−Citation1 ()), which corresponded to a Bragg distance of about 9.81 nm. This peak was thought to arise from the long periodicity occurring from the semicrystalline structure of the starch granules.[Citation44] As can be seen from ), SAXS pattern of amylose was smooth with no distinct characteristic peak, which was due to the weakness of crystalline structure of amylose after the gelatinization, enzymatic hydrolysis, and retrogradation process. However, after complexation with quercetin, a new shoulder peak was observed in the complexes SAXS curve at about q = 3.96 nm−Citation1. This indicated that a semicrystalline structure with a shorter Bragg distance (1.57 nm) formed in the complexes. SAXS data is also a tool to analyze the fractal structure of starch measured by the fractal dimension D, which arises from the scattering power law equation[Citation43]:
Figure 4. SAXS curves of (a) native cassava starch, (b) amylose and (c) amylose/quercetin complexes
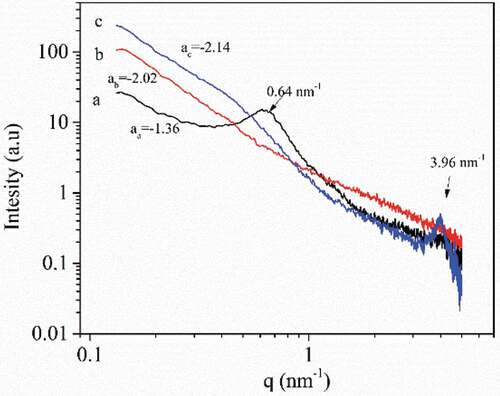
In case of -3 < α < -1, the scattering objects can be seen as possessing a mass fractal structure with the fractal dimension Dm = -α, which indicates the degree of compactness of the physical arrangement of the mass.[Citation45] As shown in ), the slope of the scattering patterns of amylose and complexes was -2.02 and -2.14, respectively, indicating that both amylose and complexes possessed a mass fractal structure with Dm = 2.02 and 2.14, respectively. The Dm value of complexes was slightly higher than that of the amylose, which suggested that the molecules of complexes were arranged more tightly.
CLSM analysis
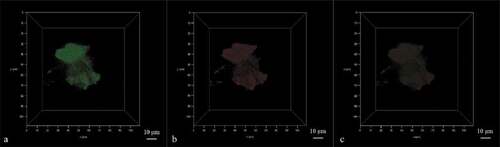
Apart from previously mentioned methods based on molecular level, CLSM provides another way to identify the precise structural feature of complexes from direct observation. The CLSM images of amylose/quercetin complexes (5% w/w) were taken under various laser channels. According to the principle, the quercetin stained by Nile Red emits red fluorescence under 633 nm wavelength laser channel, whereas green fluorescence appears in amylose stained by Nile Blue under 488 nm wavelength laser channel. Based on this, the compositions and their distribution in the complexes can clearly be observed in ). What obviously we can see are the homogeneous dispersed amylose and quercetin and the aggregative nature of amylose/quercetin inclusion complexes. This behavior of amylose inclusion complexes consistent with previous studies. Aggregation of amylose is reported to lie in the formation of interchain double helices.[Citation46] On one hand, the complexes were filled with the green fluorescence under 488 nm laser channel, which proved that amylose accounted for the main composition and thus occupied most of the space. On the other hand, CLSM images show that quercetin molecules distribute quite homogeneously over the particles which were confirmed by the red fluorescence distributed in the whole particles. When it comes to the superimposed channel in ), the amylose and the quercetin still exhibited green and red fluorescence, respectively. It was obvious that amylose and quercetin complexed successfully and presented an encapsulation structure. It was strongly linked to the V6ΙΙΙ structure characteristic that parts of quercetin laid between helices changed with the deformed configuration when the regular arrangement of amylose was disrupted by the quercetin molecules encapsulated in the helix cavity.[Citation36]
Figure 5. CLSM 3D images of amylose/quercetin complexes (5% w/w) under (a) 488 nm wavelength, (b) 633 nm wavelength and (c) superimposed laser channel
SEM analysis
The morphologies of quercetin and amylose were significantly altered after complexation; thus, they were investigated at different magnifications by scanning electron microscopy. From ), the granules of quercetin presented the strip-like structure, the surface of which appeared to be smooth with no distinct features. For aggregated amylose granule, it existed in random shape showing the rough surface and loose structure. In the physical mixtures, both amylose granules and quercetin granules kept their own structure properties, which are confirmed by ) that the strip-like quercetin and loose granular amylose distributed evenly without showing obvious discrepancy compared with their individuals. But when it comes to ), the complexes displayed a larger and tighter granular structure, which was smoother and more angular, with the absence of the strip-like quercetin structure. We can predict the molecular microstructure through macroscopic phenomena of aggregated granules. On one hand, from SAXS data, molecules of complexes were arranged more tightly compared to amylose. On the other hand, as part of quercetin distributed outside the helical cavity, it induced hydrophobic interactions between helices and the resulting complexes tended to aggregate, which contributed to an improvement in granule size, compactness, and surface to a certain degree. In the previous literature, similar results were found by Cohen et al.[Citation47] who proved that amylose-genistein complexes exhibited a significantly larger size than amylose.
Figure 6. SEM images of (a) quercetin, (b) amylose, (c) amylose/quercetin physical mixtures and (d) amylose/quercetin complexes (5% w/w)
Antioxidant study
DPPH• has been widely applied to the study of antioxidant activity of natural compounds due to its high reproducibility, convenience, and efficiency.[Citation48] It is often to track the absorbance at 517 nm for measuring the rate of the DPPH• scavenging reaction. In order to explore whether the inclusion has an influence on quercetin, the equilibrium of the reactions between DPPH• and amylose, quercetin and amylose/quercetin complexes were reached in different times ()). It clearly showed that no decay in absorbance was observed when amylose was mixed with DPPH•, which inferred that amylose had no antioxidant activity. Moreover, the differences in scavenging capacity between free quercetin and complexed quercetin were little, which suggested that the inclusion process had little influence on the antioxidant activity. This was exactly in agreement with Jullian’s report.[Citation49]
Figure 7. (a) Reaction curves between DPPH• and samples at 25°C. 0.1 ml of each sample was added to 4 ml of DPPH• solution. (b) The scavenging capacity of quercetin and complexes toward DPPH• at 25°C
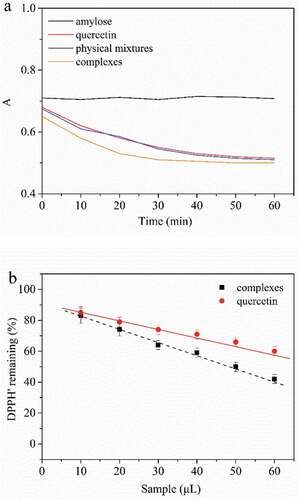
In order to explore quercetin concentration on antioxidant activity of quercetin and its complexes, the scavenging capacity toward DPPH• of quercetin and amylose/quercetin complexes at the various additions are compared in ). The percentage of DPPH• remaining showed a linear decrease with increasing addition of samples, which meant scavenging capacity toward DPPH•of both samples promoted as quercetin concentration increased. However, complexes presented lower DPPH• remaining at any addition, which indicated that quercetin was achieved for sustained high antioxidant activity after complexation with amylose. The reason why the increment in the antioxidant activity was unknown and needed to be further investigated. We might think that the penetration of catechol group into the less polar helical cavity led to a change in the redox behavior of the quercetin during the complexation of quercetin with amylose, which was in line with Parrilla et al.[Citation50] for polyphenol molecules.
Digestibility analysis
For creating a delivery system, the ultimate goal is to offer a platform for bioactivity compounds to protect against the acidic environment of the stomach before their being delivered to specific sites in the lower gastrointestinal tract. Therefore, for complexes, the percentage of quercetin released was investigated in the condition of simulated stomach and small intestine. As can be seen from , the complexes were relatively stable under stomach conditions, which indicated that the complexes with V type crystal structure presented good resistance to acid hydrolysis. Thereinto, 17% of quercetin released after incubating for 8 h, which was mainly due to the fact that the hydrolysis occurred from outside to inside of helices cavity[Citation51]; thus, parts of quercetin between the helices were easily hydrolyzed. Using similar complexation process, Lalush et al.[Citation32] proved that complexes of amylose with conjugated linoleic acid (CLA) were more stable, in which only 6% of CLA released in simulated stomach conditions. The results demonstrated that, in comparison with quercetin containing two bulky aromatic rings, the conjugated linoleic acid with an elongated molecular chain had a better opportunity to be fully encapsulated within the helical cavity; thus, it protected more molecules against the acidic environment in the stomach.
Figure 8. Amount of quercetin released of amylose/quercetin complexes (5% w/w) in simulated stomach and small intestine conditions
According to Heinemann et al.[52], it is the enzymes in the small intestine that can hydrolyze predominantly amylose-complexes to a greater extent, because they are more active and higher concentrated than in the oral cavity. Therefore, pancreatic solution containing the amylose-degrading enzymes as the simulated small intestine was selected for in vitro digestibility analysis of amylose/quercetin complexes. The result showed that quercetin was gradually released with the increasing time until it reached the maximum release rate of 97% at 8 h. It confirmed the theory of Heinemann et al. that amylose/quercetin complexes could be effectively hydrolyzed in simulated small intestine condition, and thus complexes could be served as a carrier for controlled release of specific compounds in the gastrointestinal system.
Conclusion
In conclusion, amylose/quercetin complexes were synthesized through pullulanase hydrolysis of quercetin and cassava starch, which was a simple and convenient method to obtain ameliorative bioactive quercetin products. The optimum preparation conditions were obtained: temperature 60°C, time 4 h, pH 6 and the addition amount of quercetin 5%. Afterward, the structure of synthesized complexes was confirmed by analysis of FT-IR and XRD. Furthermore, the molecular structures of the complexes were investigated usingCitation13C CP/MAS NMR to clarify the precise combining forms between quercetin and amylose, where quercetin must keep the constant direction with C-3ʹ,4ʹ of B aromatic ring ahead inside the helical cavity. Moreover, a new semicrystalline structure with a Bragg distance of about 1.57 nm was formed in the complexes. The complexes possessed a mass fractal structure and displayed a tight appearance with thin lamellar structures embedded in the matrix. Then, CLSM images proved amylose/quercetin complexes were encapsulation structure from direct observation. SEM images showed a change in the morphology of complexes to the smoothness and angularity. For quercetin, its antioxidant activity was improved after complexation with amylose; meanwhile, high retention in simulated stomach along with gradual released in simulated small intestine existed in the preliminary delivery application.
Acknowledgments
This research was supported by the National Natural Science Foundation of China (21878106 and 21576098), the 111 Project (B17018), the Key Project of Science and Technology of Guangdong Province (2018A050506016 and 2017B090901002), the Key Project of Science and Technology of Guangzhou Economic Development Zone (2018GH21), the Key Project of Science and Technology of Guangzhou (201904010240), Fundamental Research Funds for the Central Universities, SCUT (2018KZ08). The authors declare no conflicts of interest exist in the submission of this manuscript. This article does not contain any studies with human or animal subjects.
Additional information
Funding
References
- Waxman, A.;. Why a Global Strategy on Diet, Physical Activity and Health? Nutrition and Fitness: Mental Health. Aging Implementation Healthy Diet Physi Activity Lifestyle. 2005, 95, 162–166.
- Nwakoby, I. E.; Reddy, K.; Patel, P.; Shah, N.; Sharma, S.; Bhaskaran, M.; Gibbons, N.; Kapasi, A. A.; Singhal, P. C. Fas-Mediated Apoptosis of Neutrophils in Sera of Patients with Infection. Infect. Immun. 2001, 69(5), 3343–3349. DOI: 10.1128/IAI.69.5.3343-3349.2001.
- Crespy, V.; Morand, C.; Manach, C.; Besson, C.; Demigne, C.; Remesy, C. Part of Quercetin Absorbed in the Small Intestine Is Conjugated and Further Secreted in the Intestinal Lumen. Am J Physiol-Gastroint Liver Physiol. 1999, 277(1), 120–126. DOI: 10.1152/ajpgi.1999.277.1.G120.
- Juan, D.; Rosario, J.; Milagros, G.; Raquel, P. P.; Felix, V.; Francisco, P. V.; Antonio, Z.; Juan, T. Protective Effects of the Flavonoid Quercetin in Chronic Nitric Oxide Deficient Rats. J. Hypertens. 2002, 20(9), 1843–1854.
- Milojevic S, Newton JM, Cummings JH, Gibson GR, Botham RL, Ring SG, Stockham M, Allwood MC. Amylose as a Coating for Drug Delivery to the Colon: Preparation and in Vitro Evaluation Using 5-aminosalicylic Acid Pellets. J. Control. Release. 1996, 38(1), 75–84. doi:10.1016/0168-3659(95)00112-3.
- Häckl, L. P. N.; Cuttle, G.; Dovichi, S. S.; Lima-Landman, M. T.; Nicolau, M. Inhibition of Angiotesin-converting Enzyme by Quercetin Alters the Vascular Response to Brandykinin and Angiotensin I. Pharmacology. 2002, 65(4), 182–186. DOI: 10.1159/000064341.
- Kakran, M.; Sahoo, N. G.; Li, L. Dissolution Enhancement of Quercetin through Nanofabrication, Complexation, and Solid Dispersion. Colloids Surf B-Biointerfaces. 2011, 88(1), 121–130. DOI: 10.1016/j.colsurfb.2011.06.020.
- Mcclements, D. J.; Li, Y. Structured Emulsion-based Delivery Systems: Controlling the Digestion and Release of Lipophilic Food Components. Adv. Colloid Interface Sci. 2010, 159(2), 213–228. DOI: 10.1016/j.cis.2010.06.010.
- Velikov, K. P.; Pelan, E. Colloidal Delivery Systems for Micronutrients and Nutraceuticals. Soft Matter. 2008, 4(10), 1964–1980. DOI: 10.1039/b804863k.
- Dick, D. L.; Rao, T. V. S.; Sukumaran, D.; Lawrence, D. S. Molecular Encapsulation: Cyclodextrin-based Analogs of Heme-containing Proteins. J. Am. Chem. Soc. 1992, 114(7), 2664–2669. DOI: 10.1021/ja00033a046.
- Panichpakdee, J.; Supaphol, P. Use of 2-hydroxypropyl-β-cyclodextrin as Adjuvant for Enhancing Encapsulation and Release Characteristics of Asiaticoside within and from Cellulose Acetate Films. Carbohydr. Polym. 2011, 85(1), 251–260. DOI: 10.1016/j.carbpol.2011.02.023.
- Kayaci, F.; Uyar, T. Electrospun Zein Nanofibers Incorporating Cyclodextrins. Carbohydr. Polym. 2012, 90(1), 558–568. DOI: 10.1016/j.carbpol.2012.05.078.
- Jing, G.; Luo, Z.; Xiong, F. U.; Luo, F.; Peng, Z. Effect of Enzymatic Pretreatment on the Synthesis and Properties of Phosphorylated Amphoteric Starch. Carbohydr. Polym. 2012, 88(3), 917–925. DOI: 10.1016/j.carbpol.2012.01.034.
- Uchino, T.; Tozuka, Y.; Oguchi, T.; Yamamoto, K. The Change of the Structure of Amylose during the Inclusion of 2-naphthol in Sealed-heating Process. J. Incl. Phenom. Macrocycl. Chem. 2001, 39(1–2), 145–149. DOI: 10.1023/A:1008145407085.
- Takeo, K.; Tokumura, A.; Kuge, T. Complexes of Starch and Its Related Materials with Organic Compounds. Part. X. X‐Ray Diffraction of Amylose‐Fatty Acid Complexes. Starch‐Starke. 1973, 25(11), 357–362.
- Jin, X.; Zhao, W.; Ning, Y.; Bashari, M.; Wu, F.; Chen, H.; Na, Y.; Jin, Z.; Xu, B.; Zhang, L. Improved Stability and Controlled Release of ω3/ω6 Polyunsaturated Fatty Acids by Spring Dextrin Encapsulation. Carbohydr. Polym. 2013, 92(2), 1633–1640. DOI: 10.1016/j.carbpol.2012.11.037.
- Lesmes, U.; Barchechath, J.; Shimoni, E. Continuous Dual Feed Homogenization for the Production of Starch Inclusion Complexes for Controlled Release of Nutrients. Innov. Food Sci. Emerg. Technol. 2008, 9(4), 0–515. DOI: 10.1016/j.ifset.2007.12.008.
- Lesmes, U.; Cohen, S. H.; Shener, Y.; Shimoni, E. Effects of Long Chain Fatty Acid Unsaturation on the Structure and Controlled Release Properties of Amylose Complexes. Food Hydrocolloids. 2009, 23(3), 667–675. DOI: 10.1016/j.foodhyd.2008.04.003.
- Cardoso, M. B.; Putaux, J. L.; Nishiyama, Y.; Helbert, W.; Hÿtch, M.; Silveira, N. P.; Chanzy, H. Single Crystals of V-amylose Complexed with Alpha-naphthol. Biomacromolecules. 2007, 8(4), 1319–1326. DOI: 10.1021/bm0611174.
- Oguchi, T.; Yamasato, H.; Limmatvapirat, S.; Yonemochi, E.; Yamamoto, K. Structural Change and Complexation of Strictly Linear Amylose Induced by Sealed-heating with Salicylic Acid. J Chem Soc. Faraday Trans. 1998, 94(7), 923–927. DOI: 10.1039/a707848j.
- Rutschmann, M. A.; Solms, J. Formation of Inclusion Complexes of Starch with Different Organic Compounds. I: Method of Evaluation of Binding Profiles with Menthone as an Example.Lebensmittle-Wissenschaft und-Technologie. 1989, 22(5), 240–244.
- Tozuka, Y.; Takeshita, A.; Nagae, A.; Wongmekiat, A. Specific Inclusion Mode of Guest Compounds in the Amylose Complex Analyzed by Solid State NMR Spectroscopy. Chem. Pharm. Bull. 2006, 54(8), 1097–1101. DOI: 10.1248/cpb.54.1097.
- Sweedman, M. C.; Hasjim, J.; Tizzotti, M. J.; Schäfer, C.; Gilbert, R. G. Effect of Octenylsuccinic Anhydride Modification on β-amylolysis of Starch. Carbohydr. Polym. 2013, 97(1), 9–17. DOI: 10.1016/j.carbpol.2013.04.041.
- Ward, R. M.; Gao, Q.; De Bruyn, H.; Gilbert, R. G.; Fitzgerald, M. A. Improved Methods for the Structural Analysis of the Amylose-rich Fraction from Rice Flour. Biomacromolecules. 2006, 7(3), 866–876. DOI: 10.1021/bm050617e.
- Bruner, R.;. Determination of Reducing Value: 3, 5-dinitrosalicylic Acid Method. Methods Carbohydr Chem. 1964, 4, 67–71.
- Gilbert, G.; Spragg, S. Iodimetric Determination of Amylose. Methods Carbohydr Chem. 1964, 4, 168–169.
- Chen, C.; Zhang, B.; Fu, X. A Novel Polysaccharide Isolated from Mulberry Fruits (murus Alba L.) And Its Selenide Derivative: Structural Characterization and Biological activities[J]. Food Funct. 2016, 7, 2886–2897. DOI: 10.1039/C6FO00370B.
- Holm, J.; Lundquist, I.; Björck, I.; Eliasson, A. C.; Asp, N. G. Degree of Starch Gelatinization, Digestion Rate of Starch in Vitro, and Metabolic Response in Rats. Am. J. Clin. Nutr. 1988, 47(6), 1010–1016.
- Suzuki, T.; Chiba, A.; Yarno, T. Interpretation of Small Angle X-ray Scattering from Starch on the Basis of Fractals. Carbohydr. Polym. 1997, 34(4), 357–363. DOI: 10.1016/S0144-8617(97)00170-7.
- Jang, H. F.; Robertson, A. G.; Seth, R. S. Transverse Dimensions of Wood Pulp Fibres by Confocal Laser Scanning Microscopy and Image Analysis. J. Mater. Sci. 1992, 27(23), 6391–6400. DOI: 10.1007/BF00576290.
- Zhong, L.; Bo, C.; Hu, Y.; Zhang, Y.; Zou, G. Complexation of Resveratrol with Cyclodextrins: Solubility and Antioxidant Activity. Food Chem. 2009, 113(1), 17–20. DOI: 10.1016/j.foodchem.2008.04.042.
- Lalush, I.; Bar, H.; Zakaria, I.; Eichler, S.; Shimoni, E. Utilization of Amylose-lipid Complexes as Molecular Nanocapsules for Conjugated Linoleic Acid. Biomacromolecules. 2005, 6(1), 121–130. DOI: 10.1021/bm049644f.
- Tomasik, P.; Jane, J.; Spence, K.; Andernegg, J. Starch Ferrates. Starch‐Starke. 1995, 47(2), 68–72. DOI: 10.1002/star.19950470207.
- Peng, S.; Zou, L.; Zhou, W. Encapsulation of Lipophilic Polyphenols into Nanoliposomes Using pH-Driven Method: Advantages and Disadvantages. J. Agric. Food Chem. 2019. DOI: 10.1021/acs.jafc.9b01602.
- Tackett, J. E.;. FT-IR Characterization of Metal Acetates in Aqueous Solution. Appl. Spectrosc. 1989, 43(3), 483–489. DOI: 10.1366/0003702894202931.
- Cheng, W.; Luo, Z.; Li, L.; Fu, X. Preparation and Characterization of Debranched-starch/phosphatidylcholine Inclusion Complexes. J. Agric. Food Chem. 2015, 63(2), 634–641. DOI: 10.1021/jf504133c.
- Pralhad, T.; Rajendrakumar, K. Study of Freeze-dried Quercetin-cyclodextrin Binary Systems by DSC, FT-IR, X-ray Diffraction and SEM Analysis. J. Pharm. Biomed. Anal. 2004, 34(2), 333–339.
- Gessler K, Isabel Usón, Takaha T. V-Amylose at Atomic Resolution: X-Ray Structure of a Cycloamylose with 26 Glucose Residues (cyclomaltohexaicosaose)[j]. Proc. Natl. Acad. Sci. U. S. A. 1999, 96(8), 4246–4251. doi:10.1073/pnas.96.8.4246.
- Hsien-Chih, H. W.; Sarko, A. The Double-Helical Molecular Structure of Crystalline A-Amylose[J]. Carbohydr. Res. 1978, 61(1), 27–40. DOI: 10.1016/S0008-6215(00)84464-X.
- Zabar, S.; Lesmes, U.; Katz, I.; Shimoni, E.; Bianco-Peled, H. Structural Characterization of Amylose-long Chain Fatty Acid Complexes Produced the Acidification Method. Food Hydrocolloids. 2010, 24(4), 347–357. DOI: 10.1016/j.foodhyd.2009.10.015.
- Biais, B.; Bail, P. L.; Robert, P.; Pontoire, B.; Buléon, A. Structural and Stoichiometric Studies of Complexes between Aroma Compounds and Amylose. Polymorphic Transitions and Quantification in Amorphous and Crystalline Areas. Carbohydr. Polym. 2006, 66(3), 306–315. DOI: 10.1016/j.carbpol.2006.03.019.
- Yan, C.; Li, X.; Xiu, Z.; Hao, C. A Quantum-mechanical Study on the Complexation of β-cyclodextrin with Quercetin. J Mol Struct Theochem. 2006, 764(1), 95–100. DOI: 10.1016/j.theochem.2006.02.008.
- Zhang, B.; Li, X.; Liu, J.; Xie, F.; Chen, L. Supramolecular Structure of A- and B-type Granules of Wheat Starch. Food Hydrocolloids. 2013, 31(1), 68–73. DOI: 10.1016/j.foodhyd.2012.10.006.
- Zhu, J.; Li, L.; Chen, L.; li, X. Study on Supramolecular Structural Changes of Ultrasonic Treated Potato Starch Granules. Food Hydrocolloids. 2012, 29(1), 116–122. DOI: 10.1016/j.foodhyd.2012.02.004.
- Zabar, S.; Lesmes, U.; Katz, I.; Shimoni, E.; Bianco-Peled, H. Studying Different Dimensions of Amylose–long Chain Fatty Acid Complexes: Molecular, Nano and Micro Level Characteristics. Food Hydrocolloids. 2009, 23(7), 1918–1925. DOI: 10.1016/j.foodhyd.2009.02.004.
- Gidley, M. J.;. Molecular Mechanisms Underlying Amylose Aggregation and gelation[J]. Macromolecules. 1989, 22(1), 351–358. DOI: 10.1021/ma00191a064.
- Cohen, R.; Orlova, Y.; Kovalev, M.; Ungar, Y.; Shimoni, E. Structural and Functional Properties of Amylose Complexes with Genistein. J. Agric. Food Chem. 2008, 56(11), 4212–4218. DOI: 10.1021/jf800255c.
- Villano, D.; Fernández-Pachón, M. S.; Moyá, M. L.; Troncoso, A. M.; García-Parrilla, M. C. Radical Scavenging Ability of Polyphenolic Compounds Towards DPPH Free Radical. Talanta. 2007, 71(1), 230–235. DOI: 10.1016/j.talanta.2006.03.050.
- Jullian, C.; Moyano, L.; Yanez, C.; Olea-Azar, C. Complexation of Quercetin with Three Kinds of Cyclodextrins: an Antioxidant Study. Spectroc Acta Pt A Molec Biomolec Spectr. 2007, 67(1), 230–234. DOI: 10.1016/j.saa.2006.07.006.
- Alvarez-Parrilla, E.; Rosa, L. A. D. L.; Torres-Rivas, F.; Rodrigo-Garcia, J.; González-Aguilar, G. A. Complexation of Apple Antioxidants: Chlorogenic Acid, Quercetin and Rutin by β -cyclodextrin (β -CD). J. Incl. Phenom. Macrocycl. Chem. 2005, 53(1–2), 121–130. DOI: 10.1007/s10847-005-1620-z.
- Biliaderis, C. G.; Galloway, G. Crystallization Behavior of amylose-V Complexes: Structure-property Relationships. Carbohydr. Res. 1989, 189(12), 31–48. DOI: 10.1016/0008-6215(89)84084-4.
- Heinemann, C.; Zinsli, M.; Renggli, A.; Escher, F.; Conde-Petit, B. Influence of Amylose-flavor Complexation on Build-up and Breakdown of Starch Structures in Aqueous Food Model Systems. LWT - Food Sci. Technol. 2005, 38(8), 885–894. DOI: 10.1016/j.lwt.2004.08.016.