
ABSTRACT
Beef is popular meat, rich in protein and delicious taste. Good stir-fried conditions could make the beef more nutritious and delicious. In this work, the optimization of stir-fried condition was studied through orthogonal method. Separation procedures utilizing ultrafiltration, Sephadex G-15 and reversed-phase high-performance liquid chromatography were used to isolate umami taste peptides. The range analysis of orthogonal methods indicated that the stir-fried time was the main factor in the taste efficiency of sensory evaluation, followed by sucrose, oil, and finally was the salt. Combined with sensory evaluation and LC-Q-TOF/MS, the amino acid sequences of five oligopeptides were identified in optimized stir-fried beef, included VAPEEHPT, LAPSTM, PECGLVVG, FADNVFAL, FAGDDAPR. There were 4 eight-peptide and 1 six-peptide. The 15 amino acids were identified in these five peptides. In the five peptides, the Pro appeared 5 times, Val and Ala appeared 4 times, Glu, Leu, Gly, Phe, and Asp appeared 3 times. The amino acid residues of Glu-Glu (EE)-continuous and Asp-Asp (DD)-continuous in the polypeptide of stir-fried beef were identified. Double umami amino acid-continuous could be important for the umami taste of peptide.
Abbreviations: G Gly, Glycine; A Ala, Alanine; V Val, Valine; L Leu, Leucine; I Ile, Isoleucine; F Phe, Phenylalanine; W Trp, Tryptophan; Y Tyr, Tyrosine; D Asp, Aspartic acid; H His, Histidine; N Asn, Asparagine; E Glu, Glutamic acid; K Lys, Lysine; Q Gln, Glutamine; M Met, Methionine; R Arg, Arginine; S Ser, Serine; T Thr, Threonine; C Cys, Cysteine; P Pro Proline
Introduction
Cooked flavor is an important quality attribute perceived by the senses in response to various compounds formed during cooking.[Citation1] Raw meat has a blood-like flavor, due to the presence of blood salts and products of pyrolysis and saliva[Citation2], with some overtones due to species, food, and environment of the animal. Meat acceptance involves all the consumer’s senses. Taste and odor sensations are developed in meat exposed to heat and then masticated.[Citation3,Citation4] The stir-frying is one of the most important cooking methods in traditional Chinese cooking. Many delicious dishes are stir-fried, such as Minced Beef Thick Soup, Stewed Beef with Carrots, Stewed Beef in Casserole, etc. At present, more research has focused on the flavor of stewed and enzymatically hydrolyzed beef. There are few reports on the flavor of stir-fried beef.
Kang et al.[Citation5] purified and detected the flavor peptide in beef enzymatic hydrolyzate. The results showed that the peptide molecules with Maillard reaction activity had similar amino acid composition, and the molecular structure of beef flavor precursor peptides was mainly Leu(Ile)-X, Val-X, and Phe-X, which were identified by this experiment. Sensory evaluation showed that different peptides had different sensory properties, such as Leu-Thr can increase mellow feeling, Phe-Ser has umami effect. Tamura et al.[Citation6] discovered a flavoring peptide (Lys-Gly-Asp-Glu-Glu-Ser-Leu-Ala) in beef soup and named it “Delicious Peptide”. Through the study of its mechanism, it was found that the source of the taste of the peptide may be N-terminal alkaline amino acid (Lys) and intermediate acidic amino acid. This discovery played an important role in the follow-up study of peptides.
Taste may be defined as a sensory attribute of soluble substances perceptible via specific molecular receptors located at the tongue, usually the sweet, bitter, sour, salty and umami sensations.[Citation7]Taste is one of the most important factors that governs the acceptability of food. Umami has been confirmed to the fifth primary taste quality, which taste described the pleasant feeling obtained from monosodium L-glutamate (MSG).[Citation8] Many other substances including L-amino acids, bi-functional acids, peptides, and some Maillard reaction products have been successively reported to have umami taste.[Citation9–Citation12] Peptides contain amino acids thus nucleophilic amine group contributors to the Maillard reaction involving the carbonyl group of reducing carbohydrates, causing changes in flavor.[Citation13] It indicated that the Maillard reaction could enhance the flavor of peptide fractions (1–5 kDa) from soybean protein hydrolyzate. Maillard reaction represents a feasible approach for producing peptide-containing substances with umami taste or promoting the umami intensity of certain taste peptides.
Umami peptides are naturally found in a wide variety of foods and have been proved to be essential components contributing to the taste of foods. The low-molecular-weight acidic peptides were reported to be the main compounds that contributed to the umami taste of doenjang (a kind of bean paste usually consumed in Korea) water extract[Citation14] . The sensory attributes of Maillard reaction products generated from vegetable (sunflower, corn, and soybean) protein hydrolyzates have been studied, and a peptide of 1–3 kDa is known for its contribution to kokumi taste. Liu et al.[Citation15] reported that in chicken enzymatic hydrolyzate Maillard reaction products, a peptide fraction <0.5 kDa contributed to the roasted aroma of chicken, a peptide fraction >1 kDa derived by cross-linking of the peptide fraction <0.5 kDa gave a kokumi taste, and a peptide fraction >3 kDa gave the bitter taste.
Researchers found that some di- or tri-peptides containing Glu such as Glu-Glu, Glu-Asp, Glu-Asp-Glu, Glu-Gly-Ser were reported to elicit umami taste.[Citation16,Citation17] On the other hand, sensory evaluation provides integrated, direct measurements of perceived intensities of target attributes, such as appearance, color, aroma, taste, and texture.[Citation18] In this work, the optimization of stir-fried process condition was studied through orthogonal method. The flavor peptides were compared and analyzed in stir-fried beef before and after optimization. Combined with sensory evaluation, separation procedures utilizing ultrafiltration, Sephadex G-15 and reversed-phase high-performance liquid chromatography were used to isolate umami taste peptides. The molecular mass and amino acid sequences of peptides were identified by LC-Q-TOF/MS.
Materials and methods
Materials and chemicals
Beef was purchased in Yonghui market (Beijing, China), with the content of moisture 10.3%, ash 1.0%, crude protein 21.9%, crude fat 1.1%, glucose < 0.1%, fructose < 0.1%, lactose < 0.1%, sucrose < 0.1%, maltose < 0.1%. Salt was purchased in Zhongyan Yangtze Salinization Co., Ltd. Sucrose was purchased in Beijing Yuli Xing Commerce and Trade Co., Ltd. welsh onion powder, onion powder, coriander powder were purchased in Shandong Fufeng Fermentation Co., Ltd. The oil is blended oil, contains sunflower oil (25.0%), rapeseed oil (24.0%), corn oil (18.9%), soybean oil (18.0%), peanut oil (6.0%), rice oil (5%), linseed oil (2.5%), sesame oil (0.6%), which is from Golden Dragon Company and purchased from Yonghui Supermarket.
Lactic acid, citric acid, succinic acid, potassium dihydrogen phosphate (KH2PO4), phosphoric acid (H3PO4) (all AR grade), and malic acid (BR grade) were obtained from Sinopharm Chemical Reagent Co., Ltd. (Shanghai, China). Perchloric acid (HClO4, AR grade) was purchased from Xinyuan Chem Ltd. (Tianjin, China). Methanol, trifluoroacetic acid (TFA), and acetonitrile (ACN) (all HPLC grade) were purchased from Fisher Scientific (Shanghai, China). Sephadex G-15 was purchased from Beijing RuiDaHengHui Science & Technology Development Co., Ltd. (Beijing, China). HD-A computer collector and HL-2S constant current pump were purchased from Shanghai Huxi Co. Ltd. The ultra-pure water was purchased from Hangzhou Wahaha Group Co., Ltd. (Hangzhou, China).
Preparation of stir-fried beef
Beef broth Ⅰ (S1): First, cut 100.00 g beef into thin slices, add 27.00 g blending oil into the pot, heat to 207 °C and pour in 100.00 g beef, stir-fry for 3.75 min, then taken stir-fried beef, beaten with water (m:V= 100:150) in beating engine. The mixture was centrifuged in a centrifuge at 4°C and 9600 r/min for 10 min. The supernatant was taken and refrigerated at 4°C for 12 h for the purpose of removing the oil. Then, we get the residue-free and grease-free broth. Repeat the above 10 times and mix each broth to get the beef broth Ⅰ (S1) sample.
Beef broth Ⅱ (S2): The 100.00 g beef cut was cut into pieces. The 27.00 g oil was added in a cooker, and heated in 207°C, then put 100.00 g beef, 1.80 g sucrose, 2.13 g salt, and 1.50 g mixed spice, stir-fried for 3.75 min, then taken stir-fried beef, beaten with water (100:150) in beating engine. The mixture was centrifuged in a centrifuge at 4°C and 9600 r/min for 10 min. The supernatant was taken and refrigerated at 4°C for 12 h for the purpose of removing the oil. Then, we get the residue-free and grease-free broth. Repeat the above 10 times and mix each broth to get the beef broth Ⅱ (S2) sample.
Purification of the umami peptides by ultrafiltration
The beef broth Ⅰ (S1) and beef broth Ⅱ (S2) were centrifuged in 50 mL centrifuge tubes for 15 min at 10000 r/min under 4°C. The fat-removed supernatant was ultrafiltrated (25°C, 0.2 MPa) by using an ultrafiltration device of Millipore (Bedford, MA, USA). In each sample, four portions were obtained and collected, included >5 kDa, 3-5 kDa, 1-3 kDa and <1 kDa. The collected portions were lyophilized and weighed then stored at room temperature for sensory evaluation and further purification. Ultrafiltration component content (mg/kg) = total weight of the freeze-dried powder of each UF component/1 kg beef.
Purification of the umami peptides by GFC
Through sensory evaluation, the ultrafiltration portions of the most delicious fraction were selected and dissolved in ultrapure water, and the solution was prepared at 50–200 mg/mL. After filtration with nylon filter membrane over 0.22 µm, the 2 mL separation was loaded onto a Sephadex G-15 gel filtration chromatography column (1.6 × 100 cm, Qingpuhuxi instrument factory, Shanghai, China) at 25°C with ultra-pure water as the eluent at a flow rate of 2 mL/min. The Constant current pump was HL-2S. The UV absorbance of the effluent was monitored at 220 nm with a sensitivity of 1.0, used HD-3 UV detector (Qingpuhuxi instrument factory, Shanghai, China) and HD-A computer collector. The peptide bond’s absorbance at this wavelength yielded the greatest sensitivity.[Citation19] Fractions were collected and pooled into four fractions, then lyophilized for sensory evaluation and next separation by RP-HPLC.
Purification of the umami peptides by RP-HPLC
The components of the Sephadex gel chromatographic separation were used for sensory evaluation. The freeze-dried powder of the most intense taste fraction was selected and dissolved in ultrapure water and the solution was prepared at 50–200 mg/mL. After filtration with nylon filter membrane over 0.22 µm, obtained from the gel filtration chromatography, was further separated by using a 440-LC Fraction Collector (Agilent Technologies, USA) on an COSMOSIL 5 C18-MS-Ⅱ column (10 mm × 250 mm, 5 μm, Nacalai Tesque, Japan) at 30°C to achieve several subfractions containing flavor peptides. The detector wavelength was set at 214 nm. A gradient elution solvent system consisted of mobile phase A (ACN) and mobile phase B (ultra-pure water) with the VA:VB = 1:9. The flow rate was 1 mL/min. The injection volume was 1 mL. After sample separation, each fraction was collected and freeze-dried and then stored in a refrigerator at −18°C for further liquid quality identification.
Identification of peptides by LC-MS/MS
The dried RP-HPLC fractions were redissolved in ultra-pure water. The solution of 1 mg/mL was filtered by 0.22 μm nylon membrane; nano LC-Q-TOF was used for further separation and identification. The identification of the peptides was performed by nanoliquid chromatography-tandem mass spectrometry and an Eksigent Nano-LC 425 system (Eksigent of AB Sciex, CA, USA) and a quadrupole/time-of-flight (Q-ToF) TripleTOF® 5600+ system (AB Sciex Instruments, MA, USA) with a nanoelectrospray ionization source (ESI). Sample was preconcentrated on ChromXP C18-CL trap column (200 μm × 0.5 mm, 3 μm 120 Å; Eksigent of AB Sciex, CA, USA) and Nano cHiPLC column (75 μm × 15 cm, 3 μm 120 Å; Eksigent of AB Sciex, CA, USA). Mobile phase A (98% water, 2% acetonitrile,0.1% formic acid) and mobile phase B(98% acetonitrile, 2% water, 0.1% formic acid). The elution gradient 0–33 min 5–18% A, 33–45 min 82% A, 46–48 min 65% A, 49–53 min 20% A, 54–60 min 95% A; the flow rate was 300 nL/min and the injection volume was 10 µL. The ionization source ESI, mass scanning range was 50–1500 m/z, ion spray voltage was 2.4 kV; accumulation time was 0.25 s; at the first stage, 30 parent ions were fragmented, the accumulated time of each two level was 100 ms, two-level scanning range was m/z: 100–1500, the dynamic exclusion time: each 30 min gradient was 8 s, 60 min gradient was 12 s, spray gas G was 5 psi, air curtain gas was 12, cluster voltage was 100 V. Using dynamic collision energy, collision energy expansion was 5.
Sensory evaluation
The sensory evaluation was carried out using the method of “GB/T 12310–2012 Sensory analysis method-Paired comparison test” with some modifications. The beef broth: The beef broth was heated, added 2% (mbeef) salt and kept at (40 ± 2) °C to evaluate. The taste score of the beef broth added 2% (mbeef) salt was set at 5, including umami taste and overall taste. Samples were analyzed by score test using a 10-point scale. The sensory evaluation panel was composed of five males and six females (age 21–25) that had previously been trained to recognize the umami taste.
The lyophilized ultrafiltration and GFC fractions: The lyophilized ultrafiltration and GFC fractions were dissolved in ultra-pure water at concentrations of 10 mg/mL to evaluate. The 11 trained assessors should recognize the basic tastes (sourness, sweetness, bitterness, saltiness, and umami). They were recruited from the Beijing Technology and Business University (Beijing, China). Sensory evaluation was performed in a sensory panel room at (23 ± 2) °C by using grading.[Citation20,Citation21] Samples were analyzed by score test using 10 scale. Score indexes included the taste of sourness, sweetness, bitterness, saltiness, and umami. Sensory evaluation criteria were established. The taste score of the standard control solution was set at 5, including umami (Salt-monosodium glutamate solution, msalt: mmonosodium glutamate = 1:1), sourness (Citric acid 0.025 g/L), sweetness (Sucrose 1.000 g/L), bitterness (Quinine sulfate 0.001 g/L), saltiness (Salt-monosodium 3.500 g/L).The purification and detection processes, including ultrafiltration, GFC and RP-HPLC methods, were derived from the method of Kong et al.[Citation22]
All scorecards were collected at the end of each session, and the averaged values given by 11 assessors for all the descriptors were used for multivariate statistical analysis. To avoid fatigue and carryover effect, the panelists were asked to wash their mouth with 50–60 mL drinkable water between testing two different samples.
Statistical analysis
All statistical analysis was performed using SPSS v22.0 software (SPSS Inc., Chicago, IL, USA). Significant differences among the samples were calculated using one-way ANOVA followed by Duncan’s multiple range test at the 5% level (P< 0.05).[Citation23]
Results and discussion
Optimization of single factor
The beef to stir-fried time, amount of oil, amount of salt, amount of sucrose were optimized by single-factor test from the result of sensory evaluation. Sensory evaluation results of beef broth by single-factor test are depicted in . As shown in , the beef to the cooking time of 3.50, 4.00, 4.50, 5.00 and 5.50 min were compared according to the sensory evaluation scores. The highest score of umami taste and overall taste were 6.700 and 6.850 when stir-fried time in 4.00 min. The effect of oil content on the sensory evaluation score is shown in . With the increasing of the amount of oil, the sensory evaluation scores of umami taste and overall taste increased to 5.100 and 5.350 at 25 g oil, respectively.
Figure 1. Sensory evaluation results of stir-fried beef by different single-factor test. (a: stir-fried time; b: the amount of oil; c: the amount of salt; d: the amount of sucrose)
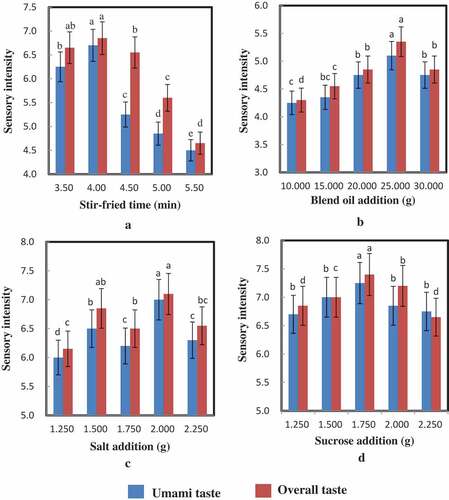
The effect of salt addition on sensory evaluation score is shown in . The trend of umami taste change was consistent with that of overall taste. The highest sensory evaluation scores of umami taste and overall taste increased were 7.000 and 7.100 at 2.000 g salt, respectively. The sensory evaluation scores of umami taste and overall taste at 2.000 g salt were higher than increased were 7.000 and 7.100, respectively. With adding 2.000 g salt, the flavor and overall taste of stir-fried beef were significantly higher than those of other additions.
The effect of sucrose addition on sensory evaluation score is shown in . With the increasing of the amount of sucrose, the sensory evaluation scores of umami taste and overall taste increased to 7.250 and 7.400 at 1.750 g sucrose, respectively. When the sucrose addition was more than 1.750 g, the sensory evaluation scores decreased. With adding 1.750 g sucrose, the flavor and overall taste of stir-fried beef were significantly higher than those of other additions. When the sucrose content was 1.250–1.750 g, with the increase of sucrose content, sweetness had a synergistic effect on the increase of flavor and the increase of sucrose content, but with the further increase of sucrose content, sweetness inhibited the characteristic flavor of beef and reduced the sensory evaluation value.[Citation24] Through sensory evaluation, the optimal amount of sucrose added to stir-fried beef was 1.750 g. The optimum processing conditions are as follows: the time of stir-frying was 4.00 min; the additions of oil, salt and sucrose were 25.000 g, 2.000 g, and 1.750 g, respectively.
Orthogonal optimization
The orthogonal experiment method is to select appropriate representative points from a large number of points to be tested, develop the experiments and analyze the data based on the orthogonal table.[Citation25] According to the amount of four parameters, an L9(34) orthogonal array, which was made up of nine rows and four columns, was chosen and the results were listed in Table T1. There were nine experiments to be developed. The optimal experiment method was obtained from the maximum possible score of sensory evaluation.
Table T2 listed the corresponding variables and their levels for the score of sensory evaluation based on the orthogonal method. According to the result of “The optimization of single factor”, three levels were selected. The range analysis of the response data was performed to measure the optimal level for these variables. The means of scores of sensory evaluation (Ki) for the four levels (i, i = 1, 2, 3, 4) of each factor are listed in . For each factor, the larger mean values indicate this level made more contribution to scores of sensory evaluation.[Citation25] In , the best level for each factor of beef broth taste could be acquired according to the highest means of scores of sensory evaluation. Thus, the highest scores of the sensory evaluation were obtained under the factor of the cooking time of 3.75 min, the amount of oil addition of 27.000 g, the amount of salt addition of 2.125 g, the amount of sucrose addition of 1.800 g. Moreover, the range value (R) is also listed in to evaluate the effect of each factor on the response. The range value displays the significance of the factor’s effect, and a larger R means the factor has a stronger impact on the scores of sensory evaluation. In , the range value of cooking time is ranked in the first place, followed is the amount of sucrose addition, the amount of oil addition, and the amount of salt addition is the last. As seen that the cooking time is the main factor affecting the scores of sensory evaluation, followed by the amount of sucrose addition, the amount of oil addition finally is the amount of salt addition.
Table 1. The stir-fried condition and sensory evaluation results of stir-fried beef
Fig.F1 showed the main effects plot for the mean values of each factor. The main effects plot indicates how each factor specifically affects the response, which further displayed the general trend of the factors influence. By comparing the slopes of the lines, the relative magnitude of the effects could be estimated. In Fig.F1, the relative slope of the lines of stir-fried time is larger, further indicated that the stir-fried time was the most important parameter affecting the scores of sensory evaluation, in accordance with the results of range analysis. So the better experiment method was the stir-fried time of 3.75 min, the amount of oil addition of 27.000 g, the amount of salt addition of 2.125 g, the amount of sucrose addition of 1.800 g.
Fractionation by ultrafiltration
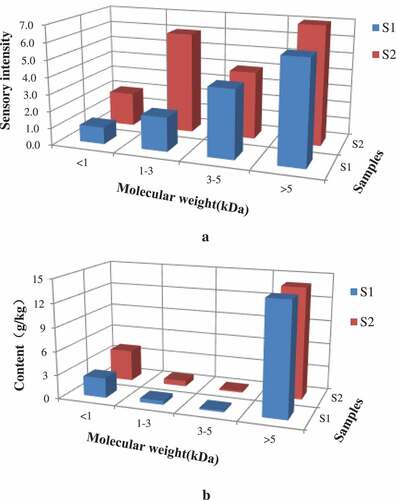
Many flavor peptides in raw beef meat and stewing beef are generated as a consequence of muscle protein degradation. Dang et al.[Citation26] obtained umami taste peptides from the fractions with MW < 5 kDa from ham. In order to study the umami effect of the peptide, beef broth Ⅰ and Ⅱ were partitioned into four peptide fractions by ultrafiltration membranes according to the MW range <1 kDa, 1–3 kDa, 3–5 kDa, and MW>5 kDa, respectively (). All fractions were lyophilized and re-dissolved for sensory evaluate. The sensory evaluation was done for the four peptide fractions according to their umami taste. In , the scores of sensory evaluation of fractions (MW <1 kDa) were all the highest in S2. Fractions of MW <1 kDa and 1–3 kDa contributed to the umami taste.[Citation27] The results showed that fraction with MW less than 1 kDa had the most umami taste consistents with previous studies. In , the content of fractions (MW <1 kDa) was all the highest in S1 and S2. The sensory scores of 3–5 kDa components in S2 samples were very close to those of <1 kDa components. This may be due to the presence of some Maillard peptides with a molecular weight of about 3–5 kDa were glycopeptide cross-linking products, which could enhance the taste, mellow and maintain the aftertaste.
Figure 2. Sensory evaluation scores (a) and fraction content (b) of ultrafiltration fraction in stir-fried beef
Fractionation by GFC
The most intense umami peptide fractions of MW <1 kDa were separated by Sephadex G-15 column chromatography (,). In , the fraction MW <1 kDa of S1 were further separated into four subfractions (S1M1, S1M2, S1M3, and S1M4). In , the fraction MW <1 kDa of S2 were further separated into four subfractions (S2M1, S2M2, S2M3, and S2M4).
Figure 3. Purification of the crude peptide with <1 kDa in stir-fried beef by Sephadex G-15 and RP-HPLC. (a: Sephadex G-15 gel filtration chromatogram of ultrafiltration fraction with molecular weight (MW) <1 kDa obtained from stir-fried beef blank experiment; b: Sephadex G-15 gel filtration chromatogram of ultrafiltration fraction with molecular weight (MW) <1 kDa obtained from stir-fried beef orthogonal optimal experiment; c: RP-HPLC chromatogram of gel filtration fraction with the highest umami score obtained from stir-fried beef blank experiment; d: RP-HPLC chromatogram of gel filtration fraction with the highest umami score obtained from stir-fried beef orthogonal optimal experiment.)
Sensory evaluation scores of four subfractions in beef broth are shown in . In , the total taste score of S1M2 was 10, which was much higher than that of other subfractions in S1. It had umami, sweet, and bitter taste except sour, among which umami taste is the dominant one.[Citation28] The subfractions of S1M3 and S1M4 were mainly bitter taste. The S1M3 was more bitter. Therefore, the S1M2 was selected for the next step of the purification of reverse-phase high-performance liquid chromatography (RP-HPLC).
Figure 4. Sensory evaluation scores of Sephadex G-15 fraction in stir-fried beef. (a): S1, (b): S2
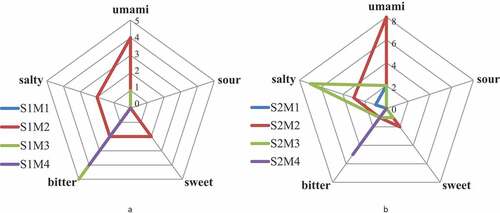
In , the total taste score of S2M2 was 14, which was much higher than that of other subfractions in S2. It had umami, sweet, and bitter taste except sour, among which umami taste is the dominant one. The subfraction of S2M1 had slightly umami taste, which is lower than that of S2M2. The S2M3 taste sour is the dominant one, the subfractions of S2M4 had a very strong bitter taste. Therefore, the S2M2 was selected for the next step of the purification of RP-HPLC.
RP-HPLC purification of taste peptides
The two fractions S1M2 and S2M2 were used for further fractionation to identify the umami taste effect, using a reverse-phase HPLC system with a preparative C18 column. As shown in , peak M1 was separated into two peaks S1M2-Ⅰ and S1M2-Ⅱ. In , peak S2M2 was separated into two peaks S2M2-Ⅰ and S2M2-Ⅱ. Subfractions of S1M2-Ⅰ, S1M2-Ⅱ, S2M2-Ⅰ, and S2M2-Ⅱ were collected and lyophilized for LC-MS identification.
Identification of taste peptides by LC-Q-TOF- MS
The molecular mass and sequence of the peptides in four subfractions (S1M2-Ⅰ, S1M2-Ⅱ, S2M2-Ⅰ, and S2M2-Ⅱ) were identified by LC-Q-TOF/MS and showed in . After the high-energy collision-induced dissociation on peptides, b-type ions and y-type ions were generated when peptides were cleaved at an amide bond.[Citation29] Hydrophilic amino acids such as Tyr, Gly, Gly, and Thr are considered to be the main contributors to the umami and sweet taste, while hydrophobic amino acid residues such as Phe and Val are responsible for the bitter taste.[Citation30] On account of repeated several times on isolation and purification employed to generate S1M2-Ⅰ, S1M2-Ⅱ, S2M2-Ⅰ, and S2M2-Ⅱ in this experiment, matrix interference was largely reduced, which could increase the feasibility and accuracy for achieving reliable sequence matching and structural characterization of peptides.
Table 2. The sequence of the peptide
The results of liquid separation of taste peptides from S1 and S2 samples are shown in . The five kinds of peptide sequences were detected by matching and analyzing the existed peptide sequences in bovine libraries and selecting more than 80% of the peptide sequences with confidence intervals. There were 4 eight-peptide and 1 six-peptide. Liu et al.[Citation31] identified seven-peptide (Pro-Val-Ala-Arg-Met-Cys-Arg) and eight-peptide (Tyr-Gly-Gly-Thr-Pro-Pro-Phe-Val) in Takifugu obscurus (T. obscurus). The two peptides were the key substances on the taste of pufferfish flavor. The peptide of VAPEEHPT was identified in S1M2-Ⅰ. The two main peptides were identified in S1M2-Ⅱ, including LAPSTM and PECGLVVG. The peptide of FADNVFAL was identified in S2M2-Ⅰ. The peptide of FAGDDAPR was identified in S2M2-Ⅱ. It has been observed that most peptides containing hydrophobic amino acids, including, Phe, Tyr, Trp, Leu, Val, Pro, Ala, Trp, Gly, Met, and Ile, release bitter taste, as do their corresponding free forms.[Citation32] Bitter peptides containing hydrophobic amino acids, such as Ala, Phe, and Leu, increase the intensity of bitterness when they are located at the C-terminal position. Peptides with hydrophobic groups, such as Phe, Leu in C-terminal positions, provide strong bitter taste.[Citation33]
Three peptides were detected in S1, but only two peptides in S2, which may be due to the high temperature fried induced cross-linking of glycopeptides, the decreased of taste peptide content due to the excessive molecular weight. Kim et al.[Citation34] identified that the amino acid sequence of this pentapeptide is similar to that of soybean protein hydrolyzate bitter peptides Ser-Ala-Glu-Phe-Gly and bitter peptides Asn-Ala-Leu-Pro-Glu.[Citation35] Liu also reported sequences such as Val-Glu, Asp-Ala, Gly-Asp, Val-Asp, and Gly-Glu, presented in dry-cured ham might provide sour and umami taste.[Citation32] Ichizo et al. investigated the effects of Gly-Gly residue on the decrease of bitterness using Phe-Phe as a standard bitter peptide. When a Gly-Gly residue in Phe-Phe-Gly-Gly replaced s-aminocaproic acid (s-Aca) whose skeletal chain length was approximately the same as that of the Gly-Gly residue and its flexibility was greater, the strength of bitterness reverted to that of Phe-Phe, indicated that the directionality of the Gly-Gly residue was important for the decrease of bitterness.[Citation36]
Tamura et al. [Citation6] discovered a flavoring peptide (Lys-Gly-Asp-Glu-Glu-Ser-Leu-Ala) in beef soup and found that the source of the taste of the peptide may be N-terminal alkaline amino acid (Lys) and intermediate acidic amino acid. It is a difference that hydrophobic amino acids, including Val, Leu, Pro, and Phe, were found in the N-terminal alkaline amino acid of five peptides isolated in stir-fried beef. The 15 amino acids were identified in these five peptides. In the five peptides, the Pro appeared 5 times, Val and Ala appeared 4 times, Glu, Leu, Gly, Phe, and Asp appeared 3 times. Pro has sweetness and bitterness. Val, Leu, and Phe have bitterness. Ala and Gly have sweetness. Glu and Asp have umami.[Citation37] In these peptides, the amino acid residues of Glu-Glu (EE)-continuous and Asp-Asp (DD)-continuous in the polypeptide of stir-fried beef were identified. Double umami amino acid-continuous could be important for the umami taste of peptide.
Conclusion
Four single-factor experiments, including stir-fried time, amount of oil, amount of sucrose and amount of salt, were conducted to determine the initial range of addition. Then, L9(34) orthogonal experiment was carried out to determine the optimal process of fried beef: 100.00 g beef, 27.000 g oil, 1.800 g sucrose, 2.125 g salt and stir-fried time was 4.00 min. The flavor peptides of S1 and S2 were separated, purified and identified by ultrafiltration, Sephadex G-15, RP-HPLC, and LC-Q-TOF-MS. Combined with sensory evaluation and LC-Q-TOF-MS, five peptides were finally identified. The 15 amino acids were identified in these five peptides. In the five peptides, the Pro appeared 5 times, Val and Ala appeared 4 times, Glu, Leu, Gly, Phe, and Asp appeared 3 times. In the five peptides, the amino acid residues of Glu-Glu (EE)-continuous and Asp-Asp (DD)-continuous in the polypeptide of stir-fried beef were identified. Double umami amino acid-continuous could be important for the umami taste of peptide. The presence of peptides in stir-fried beef could make an important contribution to taste and affect the whole flavor.
Supplemental Material
Download MS Word (295.7 KB)Supplementary material
Supplemental data for this article can be accessed here.
Correction Statement
This article has been republished with minor changes. These changes do not impact the academic content of the article.
Additional information
Funding
Related Research Data
References
- Dinh, T. T. N.; Legako, J. F.; Miller, M. F.; Brooks, J. C. Effects of USDA Quality Grade and Cooking on Water-soluble Precursors of Beef Flavor. Meat Sci. 2018, 146, 122–130. DOI: 10.1016/j.meatsci.2018.08.008.
- Gul, J.; Avijit, G.; Shambadeb, B.; Hiren, K.; Sujeet, K. S.; Kailash, C.; Lalit, K. S.; Mukesh, T. Wildlife Forensics in Nullifying the False Accusation: A Case to Deal with Raw Meat. Mitochondrial DNA B. 2018, 4(1), 736–739. DOI: 10.1080/23802359.2019.1565928.
- D’evoli, L.; Salvatore, P.; Lucarini, M.; Nicoli, S.; Aguzzi, A.; Gabrielli, P.; Lombardi-Boccia, L. Nutritional Value of Traditional Italian Meat-based Dishes: Influence of Cooking Methods and Recipe Formulation. Int. J. Food Sci. Nutr. 2009, 60, 38–49. DOI: 10.1080/09637480802322103.
- Stea, S.; Pickering, G. J. Optimizing Messaging to Reduce Red Meat Consumption. Environ. Commun. 2019, 13, 633–648. DOI: 10.1080/17524032.2017.1412994.
- Kang, L.; Alim, A.; Song, H. Identification and Characterization of Flavor Precursor Peptide from Beef Enzymatic Hydrolysate by Maillard Reaction. J. Chromatogr. B. 2019, 1104, 176–181. DOI: 10.1016/j.jchromb.2018.10.025.
- Tamura, M.; Nakatsuka, T.; Tada, M.; Kawasaki, Y.; Kikuchi, E.; Okai, H. The Relationship between Taste and Primary Structure of “delicious Peptide” (lys-gly-asp-glu-glu-ser-leu-ala) from Beef Soup. Agric Biol Chem. 1989, 53(2), 319–325. DOI: 10.1080/00021369.1989.10869317.
- Mouritsen, O. G.; Khandelia, H. Molecular Mechanism of the Allosteric Enhancement of the Umami Taste Sensation. Febs J. 2012, 279(17), 3112–3120. DOI: 10.1111/j.1742-4658.2012.08690.x.
- Narukawa, M.; Morita, K.; Uemura, M.; Kitada, R.; Oh, S. H.; Hayashi, Y. Nerve and Behavioral Responses of Mice to Various Umami Substances. Biosci., Biotechnol., Biochem. 2011, 75(11), 2125–2131. DOI: 10.1271/bbb.110401.
- Zhang, J.; Zhao, M.; Su, G.; Lin, L. Identification and Taste Characteristics of Novel Umami and Umami-enhancing Peptides Separated from Peanut Protein Isolate Hydrolysate by Consecutive Chromatography and UPLC-ESI-QTOF-MS/MS. Food Chem. 2019, 278, 674–682. DOI: 10.1016/j.foodchem.2018.11.114.
- Zhang, Y.; Venkitasamy, C.; Pan, Z.; Liu, W.; Zhao, L. Novel Umami Ingredients: Umami Peptides and Their Taste. J. Food Sci. 2017, 82(1), 16–23. DOI: 10.1111/1750-3841.13576.
- Temussi, P. A.;. The Good Taste of Peptides. J. Pept. Sci. 2012, 18(2), 73–82. DOI: 10.1002/psc.1428.
- Robert, F.; Blank, I.; Fay, L. B.; Beksan, E.; Hofmann, T.; Schieberle, P. Synthesis, Structure, and Activity of Novel Glycoconjugates Exhibiting Umami Taste. Challenges in Taste Chemistry and Biology. ACS Symposium Series, 2003; pp 195–209. chapter 13. DOI: 10.1021/bk-2003-0867.ch013.
- Ogasawara, M.; Katsumata, T.; Egi, M. Taste Properties of Maillard-reaction Products Prepared from 1000 to 5000 Da Peptide. Food Chem. 2006, 99(3), 600–604. DOI: 10.1016/j.foodchem.2005.08.040.
- Rhyu, M. R.; Kim, E. Y. Umami Taste Characteristics of Water Extract of Doenjang, a Korean Soybean Paste: Low-molecular Acidic Peptides May Be a Possible Clue to the Taste. Food Chem. 2011, 127(3), 1210–1215. DOI: 10.1016/j.foodchem.2011.01.128.
- Liu, J.; Liu, M.; He, C.; Song, H.; Chen, F. Effect of Thermal Treatment on the Flavor Generation from Maillard Reaction of Xylose and Chicken Peptide. LWT Food Sci. Technol. 2015, 64(1), 316–325. DOI: 10.1016/j.lwt.2015.05.061.
- Kawai, M.; Okiyama, A.; Ueda, Y. Taste Enhancements between Various Amino Acids and IMP. Chem. Senses. 2002, 27(8), 739–745. DOI: 10.1093/chemse/27.8.739.
- Yamasaki, Y.; Maekawa, K. Synthesis of a Peptide with Delicious Taste. J. Agric. Biol. Chem. 1980, 44(1), 93–97. DOI: 10.1080/00021369.1980.10863911.
- Bleibaum, R. N.; Stone, H.; Tan, T.; Lavreche, S.; Saint-Martin, E.; Isz, S. Comparison of Sensory and Consumer Results with Electronic Nose and Tongue Sensors for Apple Juices. Food Qual. Preference. 2002, 13, 409–422. DOI: 10.1016/S0950-3293(02)00017-4.
- Yuan, H. N.; Lv, J. M.; Gong, J. Y.; Xiao, G. N.; Zhu, R. Y.; Li, L.; Qiu, J. N. Secondary Structures and Their Effects on Antioxidant Capacity of Antioxidant Peptides in Yogurt. Int. J. Food Prop. 2018, 21(1), 2167–2180. DOI: 10.1080/10942912.2018.1501700.
- Kang, B. S.; Lee, J. E.; Park, H. J. Electronic Tongue-based Discrimination of Korean Rice Wines (makgeolli) Including Prediction of Sensory Evaluation and Instrumental Measurements. Food Chem. 2014, 151, 317–323. DOI: 10.1016/j.foodchem.2013.11.084.
- Han, Y.; Wang, X.; Cai, Y.; Li, Z.; Zhao, L.; Wang, H.; Jin, J.; Cai, Y.; Xu, L.; Zhu, L. Sensor-array-based Evaluation and Grading of Beef Taste Quality. Meat Sci. 2017, 129, 38–42. DOI: 10.1016/j.meatsci.2017.02.016.
- Kong, Y.; Yang, X.; Ding, Q.; Zhang, Y.; Sun, B.; Chen, H.; Sun, Y. Comparison of Non-volatile Umami Components in Chicken Soup and Chicken Enzymatic Hydrolysate. Food Res. Int. 2017, 102, 559–566. DOI: 10.1016/j.foodres.2017.09.038.
- Zheng, H.; Zhang, Q.; Quan, J.; Zheng, Q.; Xi, W. Determination of Sugars, Organic Acids, Aroma Components, and Carotenoids in Grapefruit Pulps. Food Chem. 2016, 205, 112–121. DOI: 10.1016/j.foodchem.2016.03.007.
- Suami, T.; Hough, L. Molecular Mechanisms of Sweet Taste 2: Glucopyranose, Fructopyranose and Sucrose. J. Carbohydr. Chem. 1992, 11, 953–967. DOI: 10.1080/07328303.1992.11760691.
- Bechhofer, R. E.; Dunnett, C. W. Multiple Comparisons for Orthogonal Contrasts: Examples and Tables. Technometrics. 1982, 24(3), 213–222. DOI: 10.2307/1268681.
- Dang, Y.; Gao, X.; Ma, F.; Wu, X. Comparison of Umami Taste Peptides in Water-soluble Extractions of Jinhua and Parma Hams. LWT Food Sci. Technol. 2015, 60(2), 1179–1186. DOI: 10.1016/j.lwt.2014.09.014.
- Su, G.; Cui, C.; Zheng, L.; Yang, B.; Ren, J.; Zhao, M. Isolation and Identification of Two Novel Umami and Umami-enhancing Peptides from Peanut Hydrolysate by Consecutive Chromatography and MALDI-TOF/TOF MS. Food Chem. 2012, 135(2), 479–485. DOI: 10.1016/j.foodchem.2012.04.130.
- Nishimura, T.; Kato, H. Taste of Free Amino Acids and Peptides. Food Rev. Int. 1988, 4, 175–194. DOI: 10.1080/87559128809540828.
- Zhuang, M.; Zhao, M.; Lin, L.; Dong, Y.; Chen, H.; Feng, M.; Sun-Waterhouse, D.; Su, G. Macroporous Resin Purification of Peptides with Umami Taste from Soy Sauce. Food Chem. 2016, 190, 338–344. DOI: 10.1016/j.foodchem.2015.05.105.
- Zhuang, M.; Lin, L.; Zhao, M.; Dong, Y.; Sun-Waterhouse, D.; Chen, H.; Qiu, C.; Su, G. Sequence, Taste and Umami-enhancing Effect of the Peptides Separated from Soy Sauce. Food Chem. 2016, 206, 174–181. DOI: 10.1016/j.foodchem.2016.03.058.
- Zhang, N.; Ayed, C.; Wang, W.; Liu, Y. Sensory-guided Analysis of Key Taste-active Compounds in Pufferfish (takifugu Obscurus). J. Agric. Food Chem. 2019, in press. DOI: 10.1021/acs.jafc.8b06047.
- Sentandreu, M. A.; Stoeva, S.; Aristoy, M.; Laib, K.; Voelter, W.; Toldrá, E. Identification of Small Peptides Generated in Spanish Dry‐cured Ham. J. Food Sci. 2003, 68(1), 64–69. DOI: 10.1111/j.1365-2621.2003.tb14115.x.
- Normah, I.; Jamilah, B.; Saari, N.; Man, Y. B. C. Chemical and Taste Characteristics of Threadfin Bream (nemipterus Japonicus) Hydrolysate. J. Sci. Food Agric. 2004, 84(11), 1290–1298. DOI: 10.1002/jsfa.1743.
- Kim, M. R.; Yukio, K.; Kim, K. M.; Lee, C. H. Tastes and Structures of Bitter Peptide, Asparagine-alanine-leucine-proline-glutamate, and Its Synthetic Analogues. J. Agric. Food Chem. 2008, 56(14), 5852–5858. DOI: 10.1021/jf7036664.
- Kim, I. M. R.; Kawamura, Y.; Lee, C. H. Isolation and Identification of Bitter Peptides of Tryptic Hydrolysate of Soybean 11S Glycinin by Reverse‐phase High‐performance Liquid Chromatography. J. Food Sci. 2003, 68(8), 2416–2422. DOI: 10.1111/j.1365-2621.2003.tb07039.x.
- Shinoda, I.; Nosho, Y.; Kouge, K.; Ishibashi, N.; Okai, H.; Tatsumi, K.; Kikuchi, E. Variation in Bitterness Potency When Introducing Gly-Gly Residue into Bitter Peptides. Agric Biol Chem. 1987, 51(8), 2103–2110. DOI: 10.1080/00021369.1987.10868361.
- Kato, H.; Rhue, M. R.; Nishimura, T. Role of Free Amino Acids and Peptides in Food Taste. In Flavor Chemistry; Teranishi, R., Buttery, R. G., Shahidi, F., Eds.; American Chemical Society: Washington DC, ACS Symposium Series, 1989; Vol. 388, pp 158–174.