
 ?Mathematical formulae have been encoded as MathML and are displayed in this HTML version using MathJax in order to improve their display. Uncheck the box to turn MathJax off. This feature requires Javascript. Click on a formula to zoom.
ABSTRACT
Thermophysical properties such as thermal conductivity (k), bulk density (ρ), specific heat (C), and thermal diffusivity (D) are crucial for simulating dynamic thermal processes such as drying and temperature-controlled storage. In this study, the effects of product temperatures (T) and moisture contents (MC) on different thermophysical properties of kelp were studied. The thermal conductivity and thermal diffusivity of the samples were measured using a KD2 Pro dual-needle sensor for a temperature range of 30–70° C and moisture content varying from 6 to 90 g (100 g sample)−1. The particle density and the bulk densities of the samples were estimated using a pycnometer with toluene as a working liquid. The k, C, and D values were fitted with a regression equation considering the individual and interaction factors (MC × T). Moisture content and temperature of the sample have significant effects (p < 0.05) on its thermophysical properties. The thermophysical properties calculated using the Choi and Okos' model based on the mass fraction of individual components present in sugar kelp and temperature were significantly (p < 0.05) different as compared to the experimental values. An artificial neural network (ANN) model evaluated eight different configurations of neurons in a single hidden layer for 180 data. The prediction performances of the ANN were evaluated in terms of mean absolute error (MAE), mean relative error (MRE), standard error (SE) and coefficient of determination in MATLAB. Overall, the ANN model’s performance was superior to the Choi and Okos empirical model in predicting the thermophysical properties with a relatively high coefficient of determination and low MAE, MRE, and SE.
Introduction
For thousands of years, seaweeds have been an important part of the human diet, dating as far back as the 13,000 B.C. in Chile, 300 B.C. in China and Japan and A.D. 500 in Ireland.[Citation1–Citation3] Currently, seaweeds are harvested either from naturally growing wild or cultivated (aquaculture) crops. At present, the production of the farmed or cultivated seaweed industry is valued at over US$ 6 billion annually, increasing at a steady rate of 8% every year.[Citation4] Countries like China, Chile, Norway, Japan, Philippines, France, Ireland, and Indonesia dominate the seaweed farming industry by producing 99% of the 25 million tons of the seaweed share worldwide.[Citation4] Food products for human consumption constitute around 83% of the annual cultivation, while the rest is used in developing hydrocolloids, fertilizers and animal feeds.[Citation5]
Fresh seaweeds have low shelf stability and are prone to enzymatic deterioration, lipid oxidation and microbial attack due to its very high moisture content (∼75–90% w.b). Drying was one of the earliest processing techniques for food preservation, governed by simultaneous heat and mass transfer of liquid-vapor phase change.[Citation6] At present, dried seaweeds are commercially produced under direct sunlight or using a convective hot air dryer based on propane or natural gas heating. Many areas, especially in the equatorial and subtropical zone of many developing countries in the Asia and Pacific region, use open drying systems to capture sunlight. However, sun drying has very limited application in the US state of Maine, due to lack of exposure to sunlight, warm dry air and clear weather conditions during the harvesting season of the year. In contrast, conventional convective dryers are energy-intensive but have proved to be better than sun drying in terms of nutrient retention and hygiene.[Citation7,Citation8] The applied drying methods vastly influence the functional properties, bioactive compounds, volatile compounds (aroma, flavor) and antioxidant activity in the finished seaweed.[Citation9–Citation18] The levels of total phenolic compounds (TPC), total flavonoid content (TFC) and proanthocyanidins in brown alga Hormosira banksii were higher in vacuum drying, freeze-drying and dehumidified drying as compared to the sun and oven drying.[Citation10] Compared to the fresh sugar kelp (Saccharina latissima), irrespective of the applied drying method, the total phenolic content (TPC), antioxidant activity and vitamin C content were observed to decrease by 5- to 10-fold in the final processed product.[Citation18] Similarly, phytochemical content in dried red seaweed Kappaphycus alvarezii was found to be lower in the case of sun and sauna drying.[Citation13] Hence, knowing the thermal properties (thermal conductivity (k), thermal diffusivity (D), specific heat capacity (C)) of sugar kelp is important for predicting the influence of drying rate under different drying conditions on the overall chemical profile affecting the nutritional, functional and bioactive properties of the dried seaweeds. Furthermore, this information will also be helpful in optimizing the design parameters of large-scale dryers to obtain uniform product quality.
Microscopic structural changes (pore formation) during drying as a result of moisture removal can be characterized macroscopically by structural properties such as true density, bulk density, porosity, and shrinkage. True density or particle density in the case of granular food is determined by the densities of its constituents and it decreases with the increase in the moisture content. The bulk density of granular food is measured experimentally depending on how the food is packed in the container. A vast amount of data has been presented for the structural properties of food (true density, bulk density, and porosity) with respect to its moisture content and temperature.[Citation19,Citation20] It has been observed that the true density is always greater than the bulk density and lies in between the density of pure water and dry solids. The applied drying method and processing conditions can also highly influence the porosity of the dried product.[Citation21,Citation22]Choi and Okos[Citation23] have proposed empirical models based on the proximate composition of the food for predicting the thermal properties such as k, C, D, and ρ over a wide range of processing temperatures. For instance, this model has been used to estimate the thermal properties of several different foods such as bakery products and carrot and meat alginate particles by considering all the major food components present including water, protein, fats, carbohydrate, fiber, and ash.[Citation24,Citation25] However, the application of empirical modeling in the case of seaweeds has known limitations since the primary constituent groups in seaweeds consist of complex polysaccharides (alginates, cellulose, laminarin, mannitol, and fucoidan) which are very different from the land-based products. Moreover, transport properties of food such as thermal conductivity, specific heat capacity, and diffusivity are dependent on structural properties especially porosity and therefore the volume fraction of air should be considered while calculating the thermophysical properties from individual constituents.[Citation26] Alternatively, thermophysical properties (k, D) can be measured directly in a single experiment by the modified heat probe method using a dual-needle probe.[Citation27,Citation28] In this method, a central heat source generates heat pulses, and the temperature response is monitored by the thermocouple placed parallel to the heating source at a fixed distance. The solution algorithm of this method only accommodates conduction as the primary mode of heat transfer. Consequently, during the heating stage, a large temperature gradient can induce convective currents in low viscous foods and might change the food structure at the microscopic level, resulting in inaccurate measurement. The pycnometer is currently used as the standard method for measuring the ρ of foods.[Citation29–Citation31] The volume of the fixed mass of the food placed in the pycnometer flask is measured by displacing the non-wetting working liquid, indirectly allowing the density of the sample to be determined. The C of the various food samples including potato,[Citation32] chicken breast patties,[Citation33] lentil seeds,[Citation34] and honey[Citation35] has been measured in the past by the standard method of differential scanning calorimetry (DSC). DSC measures the specific heat by applying a constant rate of heating and measuring the temperature difference between the unit mass of the food material and the empty reference. Specific heat capacity can also be measured indirectly by measuring thermal conductivity, density, and thermal diffusivity by using EquationEquation (4)(4)
(4) presented in this paper.
Artificial neural networks (ANN) are models designed to function like a biological human brain, based on a progressive learning system. An ANN consists of a complex network of artificial neurons, which perform in a function identical to biological neurons. The artificial neurons in one layer receive the input information and pas the activation value, calculated by subtracting the threshold value (bias) from the weighted input, through an activation function to the neurons connected in the next layer. The network training algorithm establishes a non-linear relationship between the input and output by adjusting the network weights and the threshold (bias) in order to minimize the error between the predicted value and training data set. Correspondingly, ANN is capable of modeling complex nonlinear relationships due to its excellent fault tolerance, self-learning ability, and high computational capability as compared to traditional regression approaches based on individual food constituents. In recent years, ANNs have been applied across a wide range of problems in food science such as modeling microbial growth for food safety, interpreting spectroscopic data, process control and simulation, machine perception (electronic nose) and predicting physical, chemical, thermal and functional properties of food products during processing and storage.[Citation36–Citation38]
Fresh sugar kelp is thin leafy sea vegetable which can be characterized as continuous material with low porosity. Moreover, glass transition temperature (Tg) of the kelp while air drying is always lower than the air temperature.[Citation39] Consequently, the volume shrinkage during drying can be completely attributed to the volume lost due to moisture removal without creating any void space for air as the whole process of drying occurs completely in the rubbery phase above its Tg. However, continuous monitoring of thermophysical properties while drying sugar kelp using dual-needle probe can be experimentally challenging due to following reasons: (1) Due to its thin structure multiple blades of kelp needs to be stacked along the heating needle; (2) While drying, sugar kelp blade undergoes irregular shrinkage and might create inconsistent contact surface with the heating needle; (3) Dried kelp becomes brittle and might break while stacking along the heating needle. Therefore, granulated powder of kelp is rehydrated to different moisture content and packed in a cylindrical tube to measure the thermophysical properties of sugar kelp with respect to its moisture content, temperature, and porosity.
Although there are several research articles reporting the physicochemical properties of the seaweeds and its variation with season and processing conditions, very limited information was available on the thermophysical properties of any type of seaweeds and its proximate constituents as compared to fruits, vegetables, and meat products. This study has been done on a variety of brown seaweed, sugar kelp (Saccharina latissima) to evaluate the effect of the moisture content and the temperature of the sample on its thermophysical properties. The objectives of this study were: (1) to evaluate the thermophysical properties (thermal conductivity (k), thermal diffusivity (D), bulk density (ρ), and specific heat capacity (C)) of sugar kelp considering porosity with respect to its moisture content and temperature and (2) to compare the experimental thermophysical data with the Choi and Okos empirical model and the ANN model. The results from this study will help in optimizing the design parameters of large-scale dryers focused on clean, energy-efficient and closed drying systems for producing uniform and high-value products for consumers.
Materials and methods
Sample preparation
Fresh sugar kelp (Saccharina latissima) grown in Damariscotta bay, Maine (43°56ʹ15.4” N; 69°34ʹ53.0” W), was donated by Maine Fresh Sea Farms, Walpole, ME, USA and shipped to the University of Maine at the end of June 2017. Holdfasts were removed and the blades along with the stipes were washed under running water to remove any biofouling and surface salts. Fresh sugar kelp was then freeze-dried for 4 h at each temperature of −20ºC, −10ºC, 0ºC, 10ºC and 25ºC using a freeze dryer (Virtis Ultra 35 EL, SP scientific, Warminster, PA, USA) with vacuum maintained at 20 Pa. After drying, the sugar kelp samples were ground into a fine powder using a food grinder (Magicbullet, Nutribullet LLC, Pacoima, CA, USA). The powdered samples were then sifted through a brass, multilevel sifter, and particles <0.5 mm were kept in the brown Nalgene bottles. These bottles were stored at room temperature (~22ºC) in cardboard boxes to avoid any light interference until further analysis.
Proximate analysis
The moisture content of the dried sugar kelp was determined gravimetrically using the AOAC method.[Citation40] Briefly, 1.0 ± 0.002 g of powdered kelp was dried in an oven (VWR, VWR International, Radnor, PA, USA) at 105ºC until there is no further change in weight ± 0.001 g.[Citation40] Ash content was determined gravimetrically by heating the same glass scintillation vials containing the dried seaweed samples (after measuring moisture content) in a muffle furnace (Thermolyne Model F-A1730, Dubuque, IA, USA) at 550°C for 7 h.[Citation40] Total nitrogen content was determined using a dry combustion analyzer (TruMac CNS, LECO Corporation, MI, USA).[Citation41] The total crude protein was calculated using an average nitrogen-to-protein conversion factor of 5.3 for sugar kelp.[Citation42] Crude fat/lipid content of the samples was measured using the acid hydrolysis method for seafoods.[Citation43] The total carbohydrate content was determined using the difference method.[Citation44]
Thermal properties
Sugar kelp samples of different moisture content (0.06, 0.10, 0.30, 0.50, 0.70 and 0.90 kg H2O/kg sample) were prepared by rehydrating the freeze-dried powder. Thermal conductivity (k) and thermal diffusivity (D) of the prepared samples were measured using an SH-1 dual needle of KD2 Pro thermal propertiesanalyzer (Decagon Devices Inc., Pullman, WA, USA). The dual-needle sensor consists of two stainless steel parallel needles spaced 6 mm apart; one needle consists of a line-heating source while the temperature-monitoring thermocouple is enclosed in the other needle. Short duration heat pulses are applied to the heating needle and the temperature of the thermocouple needle is monitored during the heating phase and the cooling phase followed by the heating phase. The working principle of KD2 Pro is described using Equationequation (1)(1)
(1) for transient one-dimensional radial heat conduction equation for a long cylinder.
where T is the final temperature (°C); Ti is the initial temperature (°C); q is the heat generated in the heating needle per unit length (W m−1); k is the thermal conductivity of the medium (W m−1 K−1); Ei is the elliptic integral function; t is heating time (s); r is the radial distance between the heating and the temperature monitoring probe (m); and D is the thermal diffusivity of the medium (m2 s−1). EquationEquation (1)(1)
(1) can also be expressed using an infinite power series considering initial terms as below.
where γ is the Euler constant (0.5772). Sugar kelp samples were packed tightly inside the sample holder to avoid any air resistance during measurement and closed with a cap drilled with two holes (ϕ = 0.813 mm) spaced 6 mm apart to insert the SH-1 dual needle. After insertion, the space between the top of the cap and the needle head is sealed with non-wetting clay to avoid any moisture loss while heating the sample. The sample holder along with the inserted needle was held at room temperature for 15 min to equilibrate with the surroundings. Before measurement, the sample holder was held by a clamp stand inside a water bath (Julabo SW22, Allentown, PA, USA) for 15 min to equilibrate and attain the required temperature at which the thermal properties were measured. The readings of k and D were recorded for six replicates at each temperature (30, 40, 50, 60, 70°C) and moisture content (0.06, 0.10, 0.30, 0.50, 0.70, 0.90 kg H2O/kg sample) of the sample. The KD2 pro sensor was calibrated with the two-hole Delrin block provided by the manufacturer to verify its performance, prior to the measurements.
Particle density, bulk density, and porosity
The particle density of the sugar kelp samples of moisture content 0.06 g water (g sample)−1 was measured using a liquid pycnometer.[Citation45] Toluene was chosen as the working liquid due to its non-wettability, high boiling point, and low specific gravity.[Citation46] In brief, the empty weight of the pycnometer is recorded along with its top head. After placing ~2 g sample in the glass flask of the pycnometer, toluene was poured in and stirred to remove the trapped air. The top head of the glass pycnometer was closed by the glass stopper with a capillary hole releasing the excess toluene. The particle density of the sample was calculated using formula (3).
where ρs is the particle density of the sample (kg m−3) of moisture content 0.06 kg H2O/kg sample, WS is the initial weight of the sample and the pycnometer together (kg), WE is the weight of empty pycnometer (kg), VP is the total volume of the empty pycnometer (m3), WST is the initial weight of the sample plus poured toluene and the pycnometer together (kg) and ρT is the density of toluene at room temperature ~ 22°C (867 kg m−3).
The bulk density (ρT) of sugar kelp samples of moisture content (0.06, 0.10, 0.30, 0.50, 0.70, 0.90 g water (g sample)−1) was measured by packing tightly in a glass cuvette of known volume. The porosity (φ) of the samples was calculated assuming no excess volume due to interaction between added components and negligible air weight using formula (4).
where VC is the total volume of the glass cuvette, MS is the mass of the dry seaweed of moisture content 0.06 g water (g sample)−1, ρs is the particle density of the sample (kg m−3) of moisture content 0.06 g water (g sample)−1, MW is the amount of water added to bring the final moisture content in the sample, ρW is the density of water at room temperature ~ 22°C (1000 kg m−3).
Specific heat
The specific heat capacity of the sugar kelp samples was calculated indirectly from the previously determined values of k, D, and the ρT using the relationship (5).
where C is specific heat (J kg−1K−1); k is thermal conductivity (W m−1 K−1); ρT is bulk density (kg m−3); and D is thermal diffusivity (m2 s−1) of the samples.
Empirical models
The thermophysical properties were estimated by a predictive model approach based on the proximate content of the sugar kelp samples ().[Citation23] The empirical approach is easy to compute based on the proximate component of the food samples. However, the major disadvantage of using the empirical model in estimating the thermal properties of sugar kelp is that these models were developed for specific land-based foods by studying the thermal properties of their proximate. It also does not provide necessary information regarding the geometric arrangement of the major components of the food (perpendicular, parallel and dispersed), and it is very food specific.
Table 1. Thermophysical properties calculated using Choi and Okos' (1986) model based on the proximate content of food
Artificial neural network (ANN) model
The thermal properties of sugar kelp samples were fit into a two-layer feed-forward artificial neural network (ANN) programmed in MATLAB, 2017. In ANN, the processing of information occurs through multiple processing units called neurons. Each input parameter (I) passed through the neurons is multiplied by associated weights (W) of each neural connection to compute the net weighted input, followed by the addition of network bias (B). Subsequently, the output (O) of each neuron is calculated by applying a linear or non-linear transfer function (f) on its net weighted input. In this network, a sigmoid function was used for hidden layer neurons and a linear function is used in output layer neurons for function estimation. The network is trained with supervised Levenberg–Marquardt backpropagation algorithm. In this algorithm, the initial output parameter is computed by assigning random weights to each connection. Afterward, the network output is compared with the required target selected in the training dataset and the difference between target and output is propagated backward to the network in the form of mean square error (MSE). Consequently, the weights are adjusted until the produced output is close to the target by minimizing the MSE over the next iterations. The Levenberg–Marquardt method solves nonlinear least squares between the function and the measured data points by combining two minimization methods: the gradient descent method and the Gauss–Newton method. There are three stages involved in designing the neural network: the training stage, the validation stage, and the testing stage. During the training stage, the network is presented with the data for adjusting the connection weights according to the MSE. The validation stage is used to avoid the network overtraining or overfitting by measuring and simultaneously improving the network generalization. The training ceases when the generalization stops improving, indicated by no further increase in the MSE. The testing of the network is performed by presenting a completely new independent data set after the training. Finally, the performance of this network in estimating the required target is measured using R2 and MSE. In this study, 180 data points from six replicates at each temperature (30°C, 40°C, 50°C, 60°C, 70°C) and moisture content (0.06, 0.10, 0.30, 0.50, 0.70, 0.90 g water (g sample)−1) were used for prediction of thermal properties of sugar kelp samples. The 180 data points were split randomly for training (70% of the data points), validation (15% of the data points) and testing (15% of the data points) of various network architecture. The network performance was tested for one hidden layer of neurons comprising 4, 6, 8, 10, 12, and 14 neurons to avoid the complexity while choosing several architectural configurations. Out of six configurations, the one with minimized error parameters and higher R2 value is selected as the optimum model and compared with the experimental and the empirical models.
Statistical analysis
The thermophysical properties were modeled as a function of input parameters (temperature and moisture content). All the quantitative results are reported as mean ± standard deviation of six replicates. Multi-way ANOVA was used to determine any significant effects (p≤ 0.05) of the independent variables (temperature and moisture content) at an individual level and the interaction effect (double effect) on the response variable (thermophysical properties). Tukey’s honest significant difference (HSD) post hoc test was performed to identify any significant differences between the means of comparable treatment. Statistical software SAS Version 9.4 (SAS Institute, Cary, NC, USA) was used for data analysis. Performance of different ANN configurations fitted to the experimental data was evaluated using the determination coefficient (R2), mean absolute error (MAE), mean relative error (MRE) and the standard error (SE) of the thermophysical properties.[Citation24] C-2: No need to write the equations, just mention and include reference?
Results and discussion
Proximate analysis
Carbohydrate content was highest (58.20 ± 0.4 g (100 g)−1 dry solids) followed by ash content (29.4 ± 0.2 g (100 g)−1 dry solids), crude protein (10.8 ± 0.1 g (100 g)−1 dry solids), moisture content (5.3 ± 0.1 g (100 g)−1 dry solids) and fat (1.6 ± 0.1 g (100 g)−1 dry solids) in the freeze-dried samples. The fresh kelp was dried from 90 g (100 g)−1 sample to 6 g (100 g)−1 sample in order to increase the shelf life by limiting the growth of bacteria, mold, yeast.[Citation18] The composition of sugar kelp varies depending on several factors such as plant maturity, geographical locations, environmental conditions (water temperature, salinity, availability of nutrients, sunlight) and growing season.[Citation41,Citation42] The carbohydrates in sugar kelp exist in two forms: structural (alginates and cellulose) and storage (laminarin, mannitol, and fucoidan).[Citation42] In a previous study, the carbohydrate content in sugar kelp comprised more than 55 g (100 g)−1 dry solids of algal biomass.[Citation18] After carbohydrates, the second most abundant component of sugar kelp biomass is ash (~22–33 g (100 g)−1 dry solids). Besides, the average protein content and fat content in the sugar kelp ranged from 9 to 11 and from 1.5to 2 g (100 g)−1 dry solids, respectively.[Citation18]
Thermal conductivity (k)
Thermal conductivity (k) of the food determines the rate of heat transfer through the food during thermal processing. In this study, the sample temperature and moisture content have a significant effect (p< 0.05) on the thermal conductivity of the sugar kelp samples (). The k for the sugar kelp was in the range of 0.147 ± 0.001–0.626 ± 0.072 W m−1 K−1 for a temperature range of 30–70°C and moisture content varying from 6 to 90 g water (100 g sample)−1. Balingasa[Citation47] reported the thermal conductivity of the red seaweed (Kappaphycusspp.) vary from 0.221 to 0.304 W m−1 K−1 within a moisture content range of 90.7 to 31.9 g (100 g sample)−1, which is within the range to the values observed in our study. Additionally, the k of sugar kelp was also comparable to some of the terrestrially grown foods (). The k of water is higher than the other components present in the food. Therefore, the thermal conductivity of food is highly influenced by the moisture content rather than the other food proximate (carbohydrates, ash, protein, fats).[Citation54] The obtained k of the sugar kelp samples was found to be in good agreement (R2 > 0.8) with the Choi and Okos proximate content-based regression model (). Choi and Okos' model predicted closer but significantly (p < 0.05) different values of k of sugar kelp as compared to the experimental values (). This slight difference could be because the primary constituent groups in seaweeds are completely different from the land-based products resulting in different k values calculated based on the Choi and Okos' model. For instance, the major carbohydrates present in sugar kelp (alginates, cellulose, laminarin, mannitol, and fucoidan) are more complex polysaccharides than the ones considered in Choi and Okos' model (dextrose, lactose, sucrose, starch). Only the linear effects of sample temperature and the moisture content on the k of sugar kelp were significant (p < 0.05). The interaction effect (moisture content X sample temperature) was also found to be insignificant (p > 0.05) on the k value. The regression model (R2 = 0.9055) developed based on the temperature and moisture content can be expressed as:
Table 2. Thermal conductivity of sugar kelp measured using KD2 Pro and Choi and Okos' model
Table 3. Thermophysical properties (k, D, and C) of terrestrially grown foods
Table 4. Specific heat capacity of sugar kelp measured using KD2 Pro and Choi and Okos' model
where T is the sample temperature (°C) and MC is the moisture content (g (100 g)−1 sample).
Thermal diffusivity (D)
Thermal diffusivity (D) is a material-specific property for describing the ability of the material to conduct heat energy relative to its ability to store the heat energy. The D of sugar kelp was identical to red seaweed (Kappaphycus spp.) reported in the range of 0.089–0.184 mm2 s−1.[Citation47] The statistical results indicated a significant effect (p< 0.05) of the sample conditions (temperature and moisture content) on the D of sugar kelp (). The D was lowest for samples held at 30°C, 40°C, and 50°C, and no significant difference (p> .05) was observed between them. Additionally, the D of sugar kelp was also found comparable to some of the terrestrially grown foods (). However, the obtained D of the sugar kelp samples was found to be poorly correlated (R2 < 0.8) with the Choi and Okos' model (). Moreover, similar to thermal conductivity, the Choi and Okos' model predicted significantly (p < 0.05) different values of the thermal diffusivity of the sugar kelp as compared to the experimental values (). Both linear and quadratic effects of sample temperature and moisture content on thermal diffusivity of sugar kelp were significant (p < 0.05). Also, the interaction effect (moisture content X sample temperature) was found significant (p < 0.05) on the D value. The regression model (R2 = 0.4689) developed based on the temperature and moisture content can be expressed as:
Table 5. Thermal diffusivity of sugar kelp measured using KD2 Pro and Choi and Okos' model
where T is the sample temperature (°C) and MC is the moisture content (g (100 g)−1 sample).
Particle density, bulk density (ρt), and porosity (φ)
Choi and Okos[Citation23] proposed an empirical equation to estimate densities of main constituents of food and their temperature dependence. However, in this study, the material density was considered to be independent of the sample temperature and only dependent on the moisture content. During the experiment, the sample was prepared and packed hermetically at room temperature in a sealed container leaving no space for thermal expansion. The particle density of 0.06 g water (g)−1 sample was observed to be 1566 kg m−3. The moisture content of the kelp has a significant effect (p< 0.05) on its ρT (). The bulk density of the high moisture samples (0.70 and 0.90 g water (g)−1 sample) was close to that of water with porosity equivalent to zero. This suggests that fresh sugar kelp can be characterized as continuous material with very low porosity. Zabalaga et al.[Citation58] reported the porosity was increased as moisture content decreased during the early stage of banana drying, reaching a maximum value at a moisture content of 46 g water (100 g sample)−1. Further drying resulted in decrease of porosity reduction in moisture content resulted in a decrease of porosity of unripe banana. As the drying proceeds, previously occupied pores by water are either replaced by air or is collapsed due to shrinkage. Similar behavioral trends were also reported during drying mango, banana slices, and pineapple.[Citation59] In the case of fresh sugar kelp, the amorphous form of water always stays in the rubbery state as the Tg of kelp is below the air-drying temperature and therefore the volume shrinkage can be contributed to the volume of the water loss without creating any void fractions in the dried kelp.[Citation39] Under this assumption, the thermophysical properties of the continuous thin matrix of kelp while drying can be estimated indirectly from granular rehydrated kelp without considering the porosity. At room temperature, the bulk densities of the samples varied non-linearly with the moisture content (). With an increase in the water content, the primary carbohydrate alginates in the presence of cations such as Ca2+ bind excess amounts of water by intermolecular cross-linking resulting in swelling and decrease of density.[Citation60]Irrespective of the sample conditions, porosity values calculated using Choi and Okos' model assuming no excess volume due to interaction and negligible air mass were found to be similar to the experimental values ().
Table 6. Measured Bulk density, calculated porosity and the Choi and Okos' model porosity of sugar kelp
Specific heat capacity (C)
The C of sugar kelp was calculated indirectly from the values of k, ρ, and D, and was in the range of 749.00 ± 5.11–3270.62 ± 219.35 J kg−1°C−1 for the temperature and moisture content varying from 30°C to 70°C and 6 to 90 g water (100 g sample)−1, respectively (). The C of fresh sugar kelp was higher than fresh Sargassum species (Sargassum Natans) at 50°C.[Citation17] Furthermore, the C above freezing point of terrestrially grown foods has similar values to sugar kelp (). Both linear and quadratic effects of moisture content on C of sugar kelp were significant (p < 0.05), whereas only the linear effect of sample temperature was significant (p < 0.05) (). The interaction effect (moisture content X sample temperature) was also found significant (p < 0.05). The regression model (R2 = 0.8829) developed based on the temperature and moisture content can be expressed as:
where T is the sample temperature (°C) and MC is the moisture content (g (100 g)−1 sample). The samples held at 30°C and 6 g water (100 g sample)−1 exhibited the lowest C and was significantly (p< 0.05) lower as compared to the other conditions. The specific heat capacity is the measure of the ability of the material to store the thermal energy. As the temperature increases, the average kinetic energy of the molecules increases contributing positively toward the net internal energy and thus raises the specific heat of the material. The experimental values of C of the sugar kelp samples were found to be in good agreement (R2 = 0.758) and were significantly (p < 0.05) different than the Choi and Okos' model (). On the other hand, the temperature had no significant effect (p > 0.05) on the C as predicted by Choi and Okos' model possibly due to less effect of temperature on C of individual food components in the considered range. Water has much higher specific heat capacity as compared to its counterparts present in the food, possibly resulting in higher specific heat capacity in samples containing high moisture.
Modeling with artificial neural network (ANN)
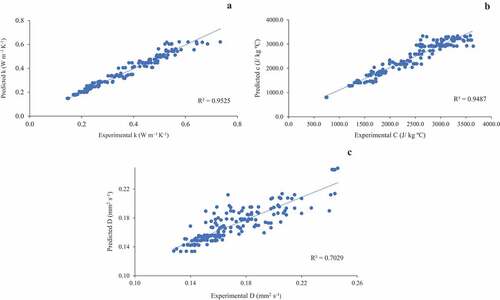
In the current study, ANN was used as an alternate tool for estimating the thermophysical properties (k, D, C) of the sugar kelp based on the parameters of sample temperature and moisture content. After repeated network training, assessment and validation with one hidden layer of neurons comprising of 2, 4, 6, 8, 10, 12, 14, and 16 neurons, the model with lowest error in terms of mean absolute error (MAE), mean relative error (MRE), standard error (SE) and highest R2 value was selected as optimum (). Multiple hidden layers were not considered in this study as simple ANN configurations are a good predictor for the input dataset with inherent variation.[Citation24] The output from the neural network with several configurations was obtained using a second data set consisting of similar size (180) input data points not used in the training. The best ANN configuration with maximum performance included 10, 6, and 8 neurons in a hidden layer for predicting the k, D, and C, respectively. demonstrates an excellent correlation fit between the experimental and predicted values by the ANN model. The corresponding network estimated the k with 0.019 W m−1 K−1 MAE, 0.049 MRE and 0.002 W m−1 K−1 (R2 = 0.961), D with 0.010 mm2 s−1 MRE, 0.054 MAE and 0.001 mm2 s−1 (R2 = 0.750) and C with 152.25 J kg−1°C−1 MAE, 0.060 MAE and 15.29 J kg−1°C−1 (R2 = 0.920). The optimum ANN model predicted the thermophysical properties with a higher coefficient of determination (R2) as compared to the regression model and the Choi and Okos' model (). The regression equation can be written as Y = B2 + LW*tansig (B1 + IW*x); where Y is the output parameter, X is the input matrix, B1 and B2 are bias value for layer 1 and 2, respectively, IW is the input weight matrix and LW is layer weight matrix. The matrix value of B1, B2, IW, and LW for the best ANN configuration to predict the thermophysical properties are given in . Lastly, the developed ANN model in this study was able to capture the effect of sample temperature and moisture content on the thermophysical properties of sugar kelp with high confidence.
Table 7. Prediction errors in the thermophysical properties with different ANN configurations and Choi and Okos' Model
Table 8. Regression parameters for predicting the thermophysical properties of sugar kelp with the best ANN configuration
Figure 1. Correlation of experimental versus neutral network values of thermophysical properties of sugar kelp with training data set (a) thermal conductivity, (b) specific heat capacity, (c) thermal diffusivity. The best ANN configuration included 8, 10, and 14 neurons in each layer for (a) thermal conductivity, (b) specific heat capacity, (c) thermal diffusivity, respectively
Conclusion
This is the first study reporting the effects of moisture content and the sample temperature of sugar kelp on its thermophysical properties (thermal conductivity, thermal diffusivity, material density, specific heat capacity). In the seaweed drying process, the thermophysical properties change continuously with the sample temperature and moisture content. A comparative study was performed between the regression analysis, Choi and Okos' model and ANN model to estimate their ability to predict the thermophysical properties in a dynamic process of sugar kelp drying based on the sample temperature and moisture content. The bulk density of the kelp varied non-linearly with moisture content, whereas k, C, and D were in the range of 0.147–0.626 W m−1 K−1, 484.46–3954.26 J kg−1°C−1 and 0.135–0.244 mm2 s−1, respectively, for a temperature range of 30–70°C and moisture content varying from 6 to 90 g (100 g sample)−1. Choi and Okos' model calculated significantly (p < 0.05) different values of thermophysical properties of sugar kelp based on its major composition including water, fats/lipids, carbohydrate, protein, ash content and air fraction. Above the freezing point, in high moisture samples (>30 g (100 g)−1 sample), water content significantly (p < 0.05) influenced the specific heat capacity and the thermal conductivity of sugar kelp as compared to the other major food components. ANNs were proved to have the ability to learn from the training data set and model non-linear and complex relationships between inputs and outputs. In this study, the optimum ANN model determined the thermophysical properties with less than 16 neurons in one hidden layer. The predicted values by the ANN model were in excellent correlation with the experimental values in terms of coefficient of determination (R2) as compared to the regression model and the Choi and Okos' model with relatively low MAE, MRE, and SE. It can be concluded that the thermophysical properties of fresh sugar kelp are greatly influenced by the moisture content as compared to other food proximate and will not be affected by the seasonal variation. The results will help in estimating the drying time of sugar kelp depending on the thermophysical properties and drying conditions.
Acknowledgments
We would like to thank the National Science Foundation award #1355457 on Sustainable Ecological Aquaculture Network (SEANET) for funding this project and Maine Sea Farms of Maine for harvesting and donating fresh sugar kelp throughout the period of this research work. We would also like to thank Owen Mulrey for helping in preliminary experimental work on the project.
Additional information
Funding
References
- Dillehay, T. D.; Ramirez, C.; Pino, M.; Collins, M. B.; Rossen, J.; Pinot-Navarro, J. D. Monte Verde: Seaweed, Food, Medicine and the Peopling of South America. Science. 2008, 320, 784–789. DOI: 10.1126/science.1156533.
- Fleurence, J.; Levine, I. Seaweed in Health and Disease Prevention; Academic Press: San Diego, 2016.
- Nash, C.;. The History of Aquaculture; John Wiley & Sons: Iowa, 2010.
- FAO. Fishery and Aquaculture Statistics. Aquaculture Production 1950-2012 (Fishstatj); FAO Fisheries and Aquaculture Department [online or CD-ROM]: Rome, 2014. Updated 2014 http://www.fao.org/fishery/statistics/software/fishstatj/en.
- Craigie, J. S.;. Seaweed Extract Stimuli in Plant Science and Agriculture. J. Appl. Phycol. 2011, 23, 321–335. DOI: 10.1007/s10811-010-9560-4.
- Mujumdar, A. S.; Passos, M. L. Drying: Innovative Technologies and Trends in Research and Development. Mujumdar AS, Suvachittanont S (Ed). In Developments in Drying, Vol 2; Kasetsart University Press: Bangkok, Thailand, 2000; pp 235–268.
- Gallali, Y. M.; Abujnah, Y. S.; Bannani, F. K. Preservation of Fruits and Vegetables Using Solar Drier: A Comparative Study of Natural and Solar Drying. III. Chemical Analysis and Sensory Evaluation Data of the Dried Samples (Grapes, Figs, Tomatoes and onions)”. Renew. Energy. 2000, 19, 203–212. DOI: 10.1016/S0960-1481(99)00032-4.
- Murthy, M. V. R.;. A Review of New Technologies, Models and Experimental Investigations of Solar Driers. Renew. Sustain. Energy Rev. 2009, 13, 835–844. DOI: 10.1016/j.rser.2008.02.010.
- Costa, B. R.; Rocha, S. F.; Rodrigues, M. C. K.; Pohndorf, R. S.; Larrosa, A. P. Q.; Pinto, L. A. A. Physicochemical Characteristics of the Spirulina sp. Dried in Heat Pump and Conventional Tray Dryers. Int. J. Food Sci. Technol. 2015, 50, 2614–2620. DOI: 10.1111/ijfs.12930.
- Dang, T. T.; Vuong, Q. V.; Schreider, M. J.; Bowyer, M. C.; Altena, I. A. V.; Scarlett, C. J. The Effects of Drying on Physico-chemical Properties and Antioxidant Capacity of the Brown Alga (Hormosira banksii (Turner) decaisne). J. Food Process Preserv. 2016, 41, e13025. DOI: 10.1111/jfpp.13025.
- Gupta, S.; Cox, S.; Abu-Ghannam, N. Effect of Different Drying Temperatures on the Moisture and Phytochemical Constituents of Edible Irish Brown Seaweed. Lebensm Wiss Technol. 2011, 44(5), 1266–1272. DOI: 10.1016/j.lwt.2010.12.022.
- Lann, K. L.; Jegou, C.; Stiger-Pouvreau, V. Effect of Different Conditioning Treatments on Total Phenolic Content and Antioxidant Activities in Two Sargassacean Species: Comparison of the Frondose Sargassum muticum (Yendo) Fensholt and the Cylindrical Bifurcaria bifurcata R. Ross. Phycol. Res. 2008, 56(4), 238–245. DOI: 10.1111/j.1440-1835.2008.00505.x.
- Ling, A. L. M.; Yasir, S.; Matanjun, P.; Abu Bakar, M. F. Effect of Different Drying Techniques on the Phytochemical Content and Antioxidant Activity of Kappaphycus alvarezii. J. Appl. Phycol. 2015, 27(4), 1717–1723. DOI: 10.1007/s10811-014-0467-3.
- Neoh, Y. Y.; Matanjun, P.; Lee, J. S. Comparative Study of Drying Methods on Chemical Constituents of Malaysian Red Seaweed. Drying Technol. 2016, 34(14), 1745–1751. DOI: 10.1080/07373937.2016.1212207.
- Tello-Ireland, C.; Lemus-Mondaca, R.; Vega-Gálvez, A.; López, J.; DiScala, K. Influence of Hot-air Temperature on Drying Kinetics, Functional Properties, Colour, Phycobiliproteins, Antioxidant Capacity, Texture and Agar Yield of Alga Gracilaria chilensis. Lebensm Wiss Technol. 2011, 44(10), 2112–2118. DOI: 10.1016/j.lwt.2011.06.008.
- Vairappan, C. S.; Razalie, R.; Elias, U. M.; Ramachandram, T. Effects of Improved Post-harvest Handling on the Chemical Constituents and Quality of Carrageenan in Red Alga, Kappaphycus alvarezii Doty. J. Appl. Phycol. 2014, 26(2), 909–916. DOI: 10.1007/s10811-013-0117-1.
- Wong, K.; Cheung, P. C. Influence of Drying Treatment on Three Sargassum Species. J. Appl. Phycol. 2001, 13(1), 43–50. DOI: 10.1023/A:1008149215156.
- Sappati, P. K.; Nayak, B.; VanWalsum, G. P.; Mulrey, O. T. Combined Effects of Seasonal Variation and Drying Methods on the Physicochemical Properties and Antioxidant Activity of Sugar Kelp (Saccharina latissima). J. Appl. Phycol. 2019, 31(2), 1311–1332. DOI: 10.1007/s10811-018-1596-x.
- Boukouvalas, C. J.; Krokida, M. K.; Maroulis, Z. B.; Marinos-Kouris, D. Effect of Material Moisture Content and Temperature on the True Density of Foods. Int. J. Food Prop. 2006, 9(1), 109–125. DOI: 10.1080/10942910500473970.
- Boukouvalas, C. J.; Krokida, M. K.; Maroulis, Z. B.; Marinos-Kouris, D. Density and Porosity: Literature Data Compilation for Foodstuffs. Int. J. Food Prop. 2006, 9(4), 715–746. DOI: 10.1080/10942910600575690.
- Sablani, S. S.; Rahman, M. S. Pore Formation in Selected Foods as a Function of Shelf Temperature during Freeze Drying. Drying Technol. 2002, 20(7), 1379–1391. DOI: 10.1081/DRT-120005857.
- Rahman, M. S.;. A Theoretical Model to Predict the Formation of Pores in Foods during Drying. Int. J. Food Prop. 2003, 6(1), 61–72. DOI: 10.1081/JFP-120016624.
- Choi, Y.; Okos, M. R. Effects of Temperature and Composition on the Thermal Properties of Foods. In Journal of Food Process and Applications 1(1): 93-101. Elsevier Applied Science Publishers: London, 1986.
- Sablani, S. S.; Baik, O.; Marcotte, M. Neural Networks for Predicting Thermal Conductivity of Bakery Products. J. Food Eng. 2002, 52(3), 299–304. DOI: 10.1016/S0260-8774(01)00119-4.
- Hassan, H. F.; Ramaswamy, H. S. Measurement and Targeting of Thermophysical Properties of Carrot and Meat Based Alginate Particles for Thermal Processing Applications. J. Food Eng. 2011, 107(1), 117–126. DOI: 10.1016/j.jfoodeng.2011.05.028.
- Rahman, S.;. Food Properties Handbook, 2nd ed.; CRC Press: Boca Raton, 2009.
- Carslaw, H. S.; Jaeger, J. C. Conduction of Heat in Solids; Clarendon Press: Oxford, 1959.
- Sweat, V. E.;. Experimental Values of Thermal Conductivity of Selected Fruits and Vegetables. J. Food Sci. 1974, 39, 1080–1083. DOI: 10.1111/j.1365-2621.1974.tb07323.x.
- Coimbra, J. S. R.; Gabas, A. L.; Minim, L. A.; Garcia Rojas, E. E.; Telis, V. R. N.; Telis-Romero, J. Density, Heat Capacity and Thermal Conductivity of Liquid Egg Products. J. Food Eng. 2006, 74(2), 186–190. DOI: 10.1016/j.jfoodeng.2005.01.043.
- Rojas, E. E. G.; Coimbra, J. S. R.; Telis-Romero, J. Thermophysical Properties of Cotton, Canola, Sunflower and Soybean Oils as a Function of Temperature. Int. J. Food Prop. 2013, 16(7), 1620–1629. DOI: 10.1080/10942912.2011.604889.
- Phinney, D. M.; Frelka, J. C.; Heldman, D. R. Composition-based Prediction of Temperature-dependent Thermophysical Food Properties: Reevaluating Component Groups and Prediction Models: Predicting Thermophysical Properties of Foods. J. Food Sci. 2017, 82(1), 6–15. DOI: 10.1111/1750-3841.13564.
- Wang, N.; Brennan, J. G. Changes in Structure, Density and Porosity of Potato during Dehydration. J. Food Eng. 1995, 24(1), 61–76. DOI: 10.1016/0260-8774(94)P1608-Z.
- Murphy, R. Y.; Marks, B. P.; Marcy, J. A. Apparent Specific Heat of Chicken Breast Patties and Their Constituent Proteins by Differential Scanning Calorimetry. J. Food Sci. 1998, 63(1), 88–91. DOI: 10.1111/j.1365-2621.1998.tb15682.x.
- Tang, J.; Sokhansanj, S.; Sosulski, F. W.; Slinkard, A. E. Lentils Quality-effects of Artificial Drying and Six-month Storage. J. Inst. Can. Sci.Technol. 1991, 24(5), 283–286. DOI: 10.1016/S0315-5463(91)70166-1.
- Sopade, P. A.; Halley, P. J.; D’arcy, B. R. Specific Heat Capacity of Australian Honeys from 35 to 165 C as a Function of Composition Using Differential Scanning Calorimetry: Specific Heat Capacity of Honeys. J. Food Process. Preserv. 2006, 30(2), 99–109. DOI: 10.1111/j.1745-4549.2006.00051.x.
- Hua, C.; Huili, S.; Xiangxi, Y.; Xin, C. Artificial Neural Network in Food Processing. 30th Chinese Control Conference, 2687–2692, Yantai, China., July 22–24, 2011.
- Huang, Y.; Kangas, L. J.; Rasco, B. A. Applications of Artificial Neural Networks (ANNs) in Food Science. Crit. Rev. Food Sci. Nutr. 2007, 47(2), 113–126. DOI: 10.1080/10408390600626453.
- Topuz, A.;. Predicting Moisture Content of Agricultural Products Using Artificial Neural Networks. Adv. Eng. Softw. 2010, 41, 464–470. DOI: 10.1016/j.advengsoft.2009.10.003.
- Sappati, P. K.; Nayak, B.; van Walsum, G. P. Effect of Glass Transition on the Shrinkage of Sugar Kelp (Saccharina latissima) during Hot Air Convective Drying. J. Food Eng. 2017, 210, 50–61. DOI: 10.1016/j.jfoodeng.2017.04.018.
- AOAC. Official Methods of Analysis (Sixteenth ed.); Association of Official Analytical Chemists: Washington, DC, 1999.
- AOAC Method 993.13. Official Methods of Analysis (Fifteenth ed.); Association of Official Analytical Chemists: Washington, DC, 1990.
- Schiener, P.; Black, K. D.; Stanley, M. S.; Green, D. H. The Seasonal Variation in the Chemical Composition of the Kelp Species Laminaria digitata, Laminaria hyperborea, Saccharina latissima and Alaria esculenta. J. Appl. Phycol. 2015, 27(1), 363–373. DOI: 10.1007/s10811-014-0327-1.
- AOAC Method 948.15. Fat (Crude) in Seafood Acid Hydrolysis Method. In Official Methods of Analysis (Eighteenth ed.); Association of Analytical Communities International: Gaithersburg, MD, 2005.
- Merill, A. L.; Watt, B. K. Energy Values of Food: Basis and Derivation. In United States Department of Agriculture; Agriculture Handbook No 74, Agriculture Research Service: Washington, DC, 1973; Vol. 74, pp 2–3.
- Bailey, C. H.; Thomas, L. M. A Method for the Determination of the Specific Gravity of Wheat and Other Cereals. USDA Bureau of Plant Industry Circular No. 99; U.S. Department of Agriculture: Washington, D.C, 1912.
- Mohsenin, N. N.;. Physical Properties of Plant and Animal Materials; Gordon and Breach Science Publishers: New York, NY, 1986.
- Balingasa, C. R.; Elepaño, A. R. Studies on Engineering Properties of Red Seaweed (Kappaphycus spp.). Philippines J. Agr.Bios. Eng. 2009, 7, 59.
- Rao, M. A.;. Thermal Conductivity and Thermal Diffusivity of Process Variety Squash and White Potatoes. Trans. ASAE. 1975, 18(6), 1188–1192. DOI: 10.13031/2013.36767.
- Puttongsiri, T.; Choosakul, N.; Sakulwilaingam, D. Moisture Content and Physical Properties of Instant Mashed Potato. International Conference on Nutrition and Food Sciences IPCBEE0, Singapore, 39. 2012.
- Delgado, A. E.; Gallo, A.; De Piante, D.; Rubiolo, A. Thermal Conductivity of Unfrozen and Frozen Strawberry and Spinach. J. Food Eng. 1997, 31(2), 137–146. DOI: 10.1016/S0260-8774(96)00066-0.
- Muramatsu, Y.; Tagawa, A.; Kasai, T. Effective Thermal Conductivity of Rice Flour and Whole and Skim Milk Powder. J. Food Sci. 2005, 70, 279–287. DOI: 10.1111/j.1365-2621.2005.tb07184.x.
- Elansari, A. M.; Hobani, A. I. Effect of Temperature and Moisture Content on Thermal Conductivity of Four Types of Meat. Int. J. Food Prop. 2009, 12(2), 308–315. DOI: 10.1080/10942910701687519.
- Bennett, A. H.; Chace, W. G., Jr; Cubbedge, R. H. Heat Transfer Properties and Characteristics of Appalachian Area ‘red Delicious’ Apple. ASHRAE Trans. 1969, 75(2), 133.
- Minh, T. V.; Perry, J. S.; Bennett, A. H. Forced-air Precooling of White Potatoes in Bulk. ASHRAE Trans. 1969, 75(2), 87–94.
- Riedel, L.;. Measurements of Thermal Diffusivity on Foodstuffs Rich in Water. Kaltetechnik. 1969, 21(11), 315–316.
- Dickerson, R. W.; Read, R. B. Thermal Diffusivity of Meats. ASHRAE Trans. 1975, 81(1), 356.
- USDA. Nutrient Database for Standard Reference, Release; 11. U.S. Department of Agriculture: Washington, DC, 1996.
- Zabalaga, R. F.; La Fuente, C. I. A.; Tadini, C. C. Experimental Determination of Thermophysical Properties of Unripe Banana Slices (Musa cavendishii) during Convective Drying. J. Food Eng. 2016, 187, 62–69. DOI: 10.1016/j.jfoodeng.2016.04.020.
- Yan, Z.; Sousa-Gallagher, M. J.; Oliveira, F. A. R. Shrinkage and Porosity of Banana, Pineapple and Mango Slices during Air-drying. J. Food Eng. 2008, 84(3), 430–440. DOI: 10.1016/j.jfoodeng.2007.06.004.
- George, M.; Abraham, T. E. Polyionic Hydrocolloids for the Intestinal Delivery of Protein Drugs: Alginate and Chitosan - a Review. J. Control. Release. 2006, 114(1), 1–14. DOI: 10.1016/j.jconrel.2006.04.017.