
ABSTRACT
The chemical compounds and the antioxidant capacity in thinned young and ripe fruit of 7 Chinese peach and nectarine varieties were investigated. Neochlorogenic acid, catechin and chlorogenic acid were the dominant antioxidants in thinned young fruit, which were 6.4–20.7-fold, 3.3–14.2-fold, and 4.1–11.4-fold higher than ripe fruit, respectively. In addition, the sugar composition of the thinned young fruit was different from that of the ripe fruit. Sucrose displayed a markedly negative correlation with the antioxidant capacity, while glucose, fructose and sorbitol did not. Malic acid and quinic acid were the major organic acids in the thinned young fruit and were positively correlated with the antioxidant capacity. Aspartic acid and glutamic acid were the main amino acids in thinned and ripe fruit. Lysine, alanine, threonine, glycine, tyrosine, and serine were significantly correlated with the antioxidant capacities, and the correlations decreased in turn. While proline and histidine showed no marked correlation with the antioxidant capacity. The antioxidant capacity of the peaches and nectarines evaluated in terms of the DPPH and ABTS free radical scavenging activities and the ferric reducing antioxidant power (FRAP) were 1.3–11.2-fold higher in thinned young fruit than ripe fruit. In addition, the chemical composition, namely, the levels of polyphenols and sucrose, could distinguish the thinned young fruit from the ripe fruit for both peaches and nectarines.
Introduction
Peaches (Prunus persica L. Batsch) and nectarines (Prunus persica Var. Nectarica) are widely consumed and favored because of their good nutrition and flavor, which is attributed to their compositions and interrelationships of soluble sugars, organic acids, amino acids, and polyphenols. In addition, peaches and nectarines are rich in polyphenols, including chlorogenic acid, catechin, neochlorogenic acid and quercetin, indicating that they have good antioxidant capacity.[Citation1] Organic acids, amino acids and sugars also play crucial roles in the antioxidant properties of peaches and nectarines.[Citation2]
Thinned young peaches and nectarines come from the excessive thinning of fruitlets to avoid small sizes and the deformation of the fruit.[Citation3] Approximately 1.25 million tonnes of young peaches and nectarines are thinned in China every year, most of which are abandoned in the field.[Citation4] In fact, thinned young peaches and nectarines have long been underestimated as potential high value-added plant resources, and their physiochemical profile and bioactive capacity have not yet been clarified. TRipe fruit and hinned young fruit, such as apples, nectarines, apricot, plumcot, and pomegranate, have been comparatively studied based on their physicochemical profiles and antioxidative components.[Citation5–Citation7] Hereinto, thinned young fruits showed significantly higher antioxidant capacity than those of their ripe counterparts. This was mainly attributed to the 5–10 times higher total polyphenol contents found in thinned young fruit than in ripe fruit. Additionally, other components, including sugars, organic acids, and amino acids, were also found to be several-fold different in thinned young fruit comparing to ripe one. However, the correlations of sugars, organic acids and amino acids with antioxidant capacity are reported less in the literature.
The bioactive compounds found in thinned young fruit have been widely utilized in food preservation and as functional additives. Specifically, the polyphenols in thinned young apples could improve chitosan film properties,[Citation8] prolong the shelf life of grass carp[Citation9] and retard the digestion of starch by inhibiting alpha-amylase .[Citation10] In addition, thinned young nectarine extracts could prevent enzymatic browning in fresh-cut fruit.[Citation11] Therefore, it is necessary to clarify the chemical composition of peaches and nectarines with different physicochemical properties and evaluate their in vitro antioxidant capacities with various methods. The effective utilization of thinned young fruit is of great significance for health-promoting food development and upgrading their economic value.[Citation12]
In the present research, 7 different varieties of thinned young peaches and nectarines compared with their ripe counterparts on their physicochemical characteristics and the composition of polyphenols, sugar, organic acid, and amino acid contents were systematically studied. In vitro antioxidant capacity of the ripe and thinned young fruit of 7 peach and nectarine varieties were investigated and compared. Moreover, correlations of the contents of polyphenols, sugars, amino acids, and organic acids with the antioxidant capacity through DPPH and ABTS and FRAP assays were evaluated. The objectives of the present study were to clarify the chemical composition in thinned young peaches and nectarines and their ripe fruits, and analyze the relationship between these components and antioxidant capacity, to discover the value of thinned young peach and nectarine resources.
Materials and methods
Peach and nectarine collection
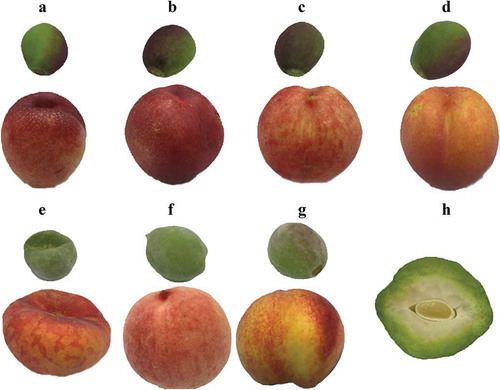
Three varieties of thinned young peaches (2000-7-1 east, Guibao98-6-48 and 94-2-12.) and four of thinned young nectarines (Xiazhizaohong, Ruiguang35, 98-6-54 and 98-6-21), as well as their ripe counterparts, were kindly provided by the Agricultural and Forestry Sciences Institute of Beijing Academy in China in 2017. These seven peach and nectarine varieties are newly cultivated in recent five years, aiming to cultivate new varieties with rich nutrition. Detailed information on the peaches and nectarines, including the morphology, appearance color, cultivar name, abbreviations, flesh color and harvest dates, is illustrated in and . The seven varieties of peaches and nectarines were planted in the same field with the same cultivation system. According to the cultivation practice of the orchard, thinned young fruit were picked 4–5 weeks after blossoming, and ripe fruit were picked at physiological maturity. The collected fruit were instantly frozen in liquid nitrogen and ground into powder. The powder was stored at −80°C until use.
Table 1. Fruit quality indices of peach and nectarine.
Figure 1. Appearance characteristics of thinned young and ripe fruit of 7 Chinese peaches and nectarines.
Chemicals and reagents
Analytical-grade methanol, sodium hydroxide, sodium carbonate, iron trichloride, sodium nitrite, aluminum nitrate, hydrochloric acid, sodium acetate, glacial acetic acid, and potassium persulfate were purchased from Innochem Science and Technology Co., Ltd. (Beijing, China). Folin-Ciocalteu reagent, TPTZ (tripyridyltriazine), DPPH (1,1-diphenyl-2-picrylhydrazyl), ABTS (2,2ʹ-azino-bis (3-ethylbenzothiazoline-6-sulfonic acid), Trolox, rutin, gallic acid, glucose, fructose, sucrose, sorbitol, malic acid, citric acid, oxalic acid, and quinic acid were purchased from Sigma-Aldrich Co., Ltd. (Steinheim, Germany).
Fruit quality indices
The fruit weight (g) and volume (mL) were measured by using the BL-500A electronic scale (SETRA, USA) and VolScan Profiler 300 automatic volume measuring instrument (Stable MicroSystem, Britain), respectively. The Fruit shape index (FSI) was obtained by measuring the maximum vertical and horizontal ratio of 10 randomly selected fruit with an 8014-digital calliper (SANTO, China). Fruit hardness, including peel hardness and flesh hardness, was determined by puncture tests using a TA-XT2i texture analyzer (Stable Micro System, Britain). Puncture tests were performed using a 2.0 mm cylindrical stainless-steel probe (P/2E) on the whole peach fruit with a penetration depth of 10 mm in 1 mm/s at 25°C.[Citation13,Citation14] The analysis parameters were set as 1 mm/s test speed at 25°C. The hardness of the peel and flesh were defined as the peak value and the mean force value within 4–10 millimeters of the stress curve, respectively. The hardness of the peel and flesh of intact fruit were tested ten times and expressed as newtons (N).
After peach and nectarine fruits were broken, the pulp was used to measure the pH, which was estimated by a PHS-3 C pH meter (Rex, China). Then, the pulp was filtered with 200 mesh nylon cloth, and the supernatant was used for the determination of SSC and TA. The SSC was tested with a WZB-45 portable refractometer (Jingke, China) and expressed as %. Titratable acidity (TA) was determined by diluting 2 mL of supernatant with 20 mL of deionized water and titrating to pH 8.1 with 0.1 M NaOH using monotonic titration[Citation15] adopting an automatic potentiometric titrator (Metrohm 907 Titrando, Nade, Switzerland). All samples were analyzed in triplicate.
Antioxidant capacity
Five grams of frozen powder was added to 20 mL of distilled water and homogenized ultrasonically (40 kHz, 30 min). Aqueous extracts of the samples were centrifuged at 1,000 g for 20 min. The supernatants were collected and stored at −40°C for further analysis. DPPH radical scavenging activity (DPPH) was determined according to the established method[Citation16] with some modifications. Two milliliters of samples were added to 4.0 mL of a methanolic DPPH solution (0.14 mM). The samples were kept in the dark for 30 min at room temperature (25 ± 1°C) before measuring the absorption decrease at a wavelength of 517 nm. The ferric reducing antioxidant power (FRAP) presents the reducing potential of antioxidants, which was performed using a TPTZ (2,4,6-tripyridylS-triazine) solution according to the methods optimized by Mokrani and Madani.[Citation17] The ABTS radical scavenging activity (ABTS) was determined based on a previous method[Citation6] with some modifications. Briefly, 2.45 mM potassium persulfate solution was mixed with 7 mM ABTS (1:1, v/v) and kept for 14 h at room temperature (25 ± 1°C) in the dark to prepare the ABTS solution. An ABTS solution diluted with aqueous methanol (80%, v/v) was used to maintain an absorbance less than 0.70 at 734 nm. Triplicate DPPH, FRAP and ABTS analyses were conducted for each sample. The antioxidant capacity was expressed as mmol Trolox/kg on a fresh weight basis.
Total polyphenol and flavonoid content
Polyphenols in the peach and nectarine fruit were extracted according to a previous method established by Mokrani and Madani .[Citation17] Five grams of a representative sample was homogenized and ultrasonically (40 kHz, 30 min) extracted with 20 mL of aqueous methanol (80%, v/v) three times. The supernatants were mixed and stored at −20°C for further analysis. The total polyphenol content (TPC) was determined spectrophotometrically by using the Folin–Ciocalteu method.[Citation17] Gallic acid was the standard compound. The TPC was expressed as gallic acid equivalents (mg) per kilogram on a fresh weight basis (mg GAE/kg). The total flavonoid content (TFC) was measured by a method described previously,[Citation16] and the results were expressed as rutin equivalents (mg) per kilogram fresh fruit sample (mg RE/kg). The determinations were performed in triplicate.
Individual polyphenol
The extracts were filtered through a 0.22 μm pore size filter (HWRK, China) and analyzed by using a Waters-1525 high-performance liquid chromatography (HPLC) system (Waters, USA) equipped with a Waters-2998 photodiode array detector (PDA) (Waters, USA), a D145CH-721 G column oven (Waters, USA) and an Eclipse-XDB-C18 chromatographic column (5 µm, 4.6 mm×250 mm, Agilent, USA). The analysis was performed with a flow rate of 1.00 mL/min. The eluent consisted of eluent A (Milli Q water, 2% acetic acid) and eluent B (pure methanol); the gradient programme was 95:5 V(A)/V(B) at 0 min, 75:25 V(A)/V(B) at 20.0 min, 60:40 V(A)/V(B) at 35.0 min, 5:95 V(A)/V(B) at 45 min, and 95:5 V(A)/V(B) at 50.0 min. The column temperature was maintained at 40°C. The injection volume of each sample was 10 μL, and each sample was analyzed in triplicate. Individual polyphenols were quantified by using the calibration curve of external standards. The assays were performed in triplicate, and the results are presented as the means ± standard deviation mg/kg.
Soluble sugar content
The soluble sugar content was determined based on a validated method[Citation18] with some modifications. Approximately 1.0 g of peach and nectarine fruit pulp homogenates were extracted with 50 mL ultrapure water in an ultrasonic bath (40 kHz) for 30 min. The extract was then centrifuged at 1,000 g for 15 min, and the supernatant was collected and filtered through a 0.45 μm filter. The analyses were performed on a Dionex ICS-3000 system (Diane, USA) equipped with a Carbo Pac™ PA20 column (3 mm×150 mm). The injection volume was 10 μL. The mobile phases were Milli Q water (A) and 250 mM NaOH (B), and the flow rate was 0.5 mL/min. The elution gradient conditions were as follows: 0–20 min, 94% A and 6% B; 20.1–30 min, 20% A and 80% B; 30.1–40 min, 94% A and 6% B. The data acquisition time was 0–20 min, and the time from min 20 to 40 was for column flushing and equilibration. The sugar levels were expressed as mg/g (fresh weight).
Organic acid content
The organic acid content was analyzed by ISC-3000 ion chromatography (Diane, USA) with an IonPac AS11-HC column (4 mm×250 mm), and the column temperature was 30°C. The mobile phase was KOH and Milli-Q water, the flow velocity was 1.00 mL/min, and the elution gradient was 6.00 mM KOH (5 min), 35 mM KOH (50 min), 35 mM KOH (59 min) and 6 mM KOH (60 min). Three replicates were performed for each sample. The organic acid concentration was presented as mg/g (fresh weight).
Amino acid content determination
Amino acids were extracted according to an established method[Citation19] with some modifications. One gram of peach/nectarine pulp powder was mixed with 10 mL hydrochloric acid (6.00 M) in a digestive tube before purging with nitrogen for 1 min. The hydrolyzed solution was fully vortexed and filtered after incubation at 110°C for 24 h to obtain the digested sample, which was then brought to a volume of 50 mL with Milli Q water. One milliliter of the diluted, hydrolyzed sample was added to a headspace vial and totally dried before being dissolved in one milliliter of hydrochloric acid (0.02 M). Finally, the sample was filtered through a 0.22 μm nylon membrane filter and analyzed on an L-8900 automatic amino acid analyzer (Hitachi, Japan). The flow rate of four lithium citrate buffers (pH 2.2, 2.8, 3.3 and 3.7) and ninhydrin was 0.2 mL/min. The temperature of the ion exchange column (4.6 mm×60 mm, 3 μm) was less than 135°C. The pump pressure was 0–20 KPa, and the injection volume of each sample was 20 μL. All determinations were performed in triplicate. The results were expressed as g/kg (fresh weight).
Statistical analyses
Data are presented as the means ± standard deviations of triplicate measurements, and significant differences (*P < .05) were determined by Tukey’s test using SPSS 21.0 Statistics (SPSS Inc., USA). A heat map was generated by Heml 1.0 software. Principal component analysis (PCA) and orthogonal projections to latent structures-discriminant analysis (OPLS-DA) were conducted by SIMCA14.1-P+ data processing software (Umetrics, Sweden).
Results and discussion
Fruit quality indices
The morphology and appearance of 7 varieties of Chinese thinned young peaches and nectarines showed no significance difference, while their ripe counterparts were notably different (). As shown in , the fruit weight and volume of the ripe peaches and nectarines were 8.7–27.7 and 6.3–20.2 times higher than those of their thinned young counterparts, respectively. Fruit hardness, which included the peel hardness and flesh hardness, of the peaches and nectarines was approximately 1.6–3.6-fold and 2.5–17.3-fold less than those of the thinned young fruit. The main reason is pectinase activation during fruit ripening, which causes pectin degradation and fruit softening.[Citation20,Citation21] The SSC of the ripe peaches and nectarines was significantly higher than that of their thinned young counterparts. The reason might involve the hydrolysis of the polysaccharide component during fruit ripening.[Citation22] The pH values of the ripe peaches and nectarines were notably higher than those of the thinned young fruit. Accordingly, the TA was 12%-51% in ripe peaches and nectarines and 53%-84% in thinned young peaches and nectarines. The results were in line with the TA content of unripe peach being 34% higher than that of ripe peaches.[Citation23] The explanation for the variation in pH and TA among different peaches and nectarines is closely related to cultivars and harvest time.[Citation24] The ranges of SSC/TA were 17.7–77.9 in ripe fruit and 11.3–17.3 in thinned young fruit, indicating that the SSC/TA of ripe peaches and nectarines possessed high variation among different varieties compared to that of the thinned young fruit.
Table 2. Individual polyphenols in thinned and ripe peach and nectarine (mg/kg).
Antioxidant capacity
The total antioxidant capacity of the 7 varieties of ripe and thinned young peaches and nectarines was assessed by using DPPH, FRAP and ABTS antioxidant evaluation methods, as shown in . The DPPH, FRAP and ABTS antioxidant capacities of the ripe peach and nectarine extracts were 1.0, 3.4 and 0.7 mmol Trolox/kg on average, while those of the thinned young fruit were 6.7, 15.1 and 1.5 mmol Trolox/kg, respectively. This was consistent with previous research highlighting that the antioxidant capacity (DPPH, FRAP and ABTS) of thinned young Spanish pomegranates was 2–6 times higher than that of ripe fruit.[Citation6]
Figure 2. Antioxidant capacity and polyphenol content of peaches and nectarines.
Specifically, the DPPH radical scavenging capacity of thinned young peaches was in the range of 4.5–11.3 mmol Trolox/kg, which was 4.6–11.2 times higher than that of the ripe fruit (0.8–1.3 mmol Trolox/kg). The ratios were 2–5 times higher than those found in Brazilian cherries, in which the thinned young cherries possessed an approximately 2-fold higher DPPH radical scavenging capacity than that of the corresponding ripe cherries.[Citation25] In addition, the FRAP of the thinned young peaches and nectarines was 2.3–8.2-fold higher than that of their ripe counterparts. In the thinned young fruit, the 4 nectarine varieties possessed higher levels of FRAP than those of the three thinned young peach varieties, which was in line with previous research.[Citation26] Moreover, the ABTS scavenging capacity of the thinned young peaches and nectarines was 1.3–4.0-fold higher than that of the ripe peaches and nectarines, but the difference was not as large as that of the DPPH and FRAP assays.
Specifically, the thinned young 98-6-54 variety showed the strongest antioxidant capacity. The three thinned young peach varieties showed lower antioxidant capacity than those four thinned young nectarine varieties. However, there was no significant difference in the DPPH antioxidant capacity of the 7 ripe fruit varieties. In terms of both the FRAP and ABTS antioxidant capacities, no significant differences were observed among the four nectarine varieties. Nonetheless, the FRAP and ABTS antioxidant capacities of the ripe peaches displayed marked differences in the 94-2-12, Guibao98-6-48 and 2000-7-1 varieties, with successive decreases in antioxidant levels.
The antioxidant capacity of the peaches and nectarines was largely contributed to the presences of primary and secondary metabolites that were determined by planting practice, cultivar and genotype.[Citation26–Citation29] On this basis, secondary metabolites, mainly polyphenols, and primary metabolites, including sugars, organic acids and amino acids, should be considered to determine whether they influence the antioxidant performance of peaches and nectarines of different varieties.
Total polyphenol and flavonoid
The total polyphenol content (TPC) and total flavonoid content (TFC) of thinned young and ripe fruit of 7 different Chinese varieties of peaches and nectarines were comparatively studied (). The TPC of the ripe peaches and nectarines varied from 340.1 to 820.3 mg GAE/kg, and their TFC varied from 114.3 to 300.1 mg RE/kg. The TPC and TFC of the thinned young fruit ranged from 1986.9 to 2900.1 mg GAE/kg and 573.8 to 743.0 mg RE/kg, respectively, which were 2.6–8.1-fold and 2.0–6.2-fold higher than those of the ripe fruit, respectively. These results were in accordance with a previous work[Citation6] that reported that the main polyphenol content of thinned young pomegranates was 5.8–6.3-fold higher than that of the ripe fruit. Moreover, the TPC and TFC of young Fuji apples (25 days after full bloom) were approximately 10-fold higher than those of ripe apples.[Citation16] Several studies have confirmed that polyphenol levels in young fruit are higher than those in ripe fruit.[Citation30]
Among the ripe fruit, two peach varieties (Guibao98-6-48 and 94-2-12) displayed a higher TPC and TFC than the those of the four nectarine varieties. The TPC and TFC of the flat peach variety (2000-7-1east) were found to be the lowest. In the thinned young fruit, the TPC and TFC of the 4 nectarine varieties were higher than those of the peaches (2000-7-1east, Guibao98-6-48), except for the 94-2-12 variety, which had yellow flesh and possessed a higher TPC and TFC.
Furthermore, the dominant phenolic compounds of the 7 peach and nectarine varieties, including neochlorogenic acid, catechin, chlorogenic acid, quercitrin, hyperoside and rutin, were quantified and compared (). The main phenolic compounds in the ripe peaches and nectarines were neochlorogenic acid, catechin and chlorogenic acid, the concentrations of which varied in the range of 18.3–82.1, 27.6–98.0 and 23.0–77.0 mg/kg, respectively. The three phenolic components constituted more than 76–89% of the total polyphenol content in all varieties, and their relative compositions were variety-dependent. The result was in line with the previous study[Citation31] that chlorogenic acid, neochlorogenic acid, procyanidin dimer, and catechin were the main polyphenols in 7 peach varieties in Algeria, accounting for 51–80% of the total phenolic content. Specifically, except for the two ripe nectarine varieties (Xiazhizaohong and Ruiguang35), in which the highest phenolic components were chlorogenic acid and neochlorogenic acid, the other five peach and nectarine varieties exhibited catechin as their most abundant polyphenol, followed by neochlorogenic acid and chlorogenic acid. In the thinned young peaches and nectarines, neochlorogenic acid, chlorogenic acid and catechin were the dominant phenolic compounds in descending order, accounting for more than 90% of the total polyphenol content.
Table 3. Correlation coefficients between polyphenol, sugar, organic acid, amino acid levels and TPC, TFC and antioxidant capacity.
The correlation of the polyphenol compound content with the antioxidant capacity of the 7 peach and nectarine varieties is shown in . The average correlation coefficients of neochlorogenic acid, chlorogenic acid, catechin, hyperoside, quercitrin, and rutin with antioxidant capacity were, in descending order, 0.937, 0.860, 0.842, 0.795, 0.643 and 0.485, respectively. In addition, the changes in the rutin level did not significantly correlate with the results of the three antioxidant capacity evaluation methods, and the other five phenolic compounds all displayed significant correlations.
Soluble sugar composition
The major sugar components of the peach and nectarine fruit, including sorbitol, glucose, fructose and sucrose, were further investigated to determine how they correlated with antioxidant capacity.[Citation28,Citation32] The total sugar contents of the ripe peaches and nectarines were in the range of 52.0–101.4 g/kg, while in the thinned young peaches and nectarines, the total sugar contents ranged from 21.8 to 30.7 g/kg (). Specifically, glucose and fructose accounted for 19.1–38.7% of the total sugar content in the ripe fruit and 74.0–81.4% in the thinned young fruit. Sucrose contributed to 59.6–77.9% of the total sugar content in the ripe fruit, which was approximately 3.7–6.0-fold higher than that of the thinned young fruit. These results were comparable to those of a previous work[Citation33] that reported a 10-fold lower sucrose content in unmatured peaches than that in ripe peaches. These differences were mainly caused by sucrose synthase enabling reversible sucrose synthesis by using fructose and glucose as substrates during the maturation process.[Citation34] In addition, sorbitol accounted for approximately 1.5–8.5% of the total soluble sugar content in the ripe peaches and nectarines and 4.9–10.2% in the thinned young fruit.
Figure 3. Heat map visualization of soluble sugar, organic acid and amino acid levels in 7 peach and nectarine varieties.
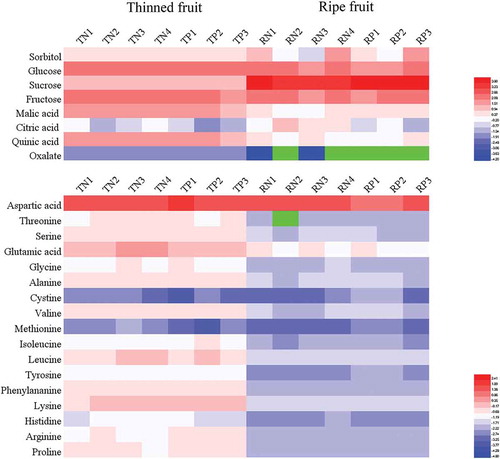
In the case of the contribution to antioxidant capacity, the total sugar content showed a significant, negative relationship with all three antioxidant evaluation indices. Moreover, sucrose displayed a markedly negative correlation, which was in agreement with other studies,[Citation28,Citation32] the sorbitol, glucose and fructose showed no correlation at all. This could be explained by the fact that, at the metabolic level, increased sucrose accumulation leads to a decreased amount of reducing substances and, thus, a lower antioxidant capacity.
Organic acid composition
Organic acids, including malic acid, citric acid, quinic acid and oxalic acid, in both the ripe and thinned young fruit were quantified, and their relationship with the antioxidant capacity was evaluated. (). The total organic acid level in the ripe fruit was in the range of 3.8–6.7 g/kg, which was significantly lower than that in the thinned young fruit (9.2–14.2 g/kg). Malic acid and quinic acid were the dominant organic acids in the thinned young peaches and nectarines. Specifically, the levels of malic, quinic, citric and oxalic acid in the thinned young fruit were 4.3–6.8, 4.5–6.0, 0.2–1.2 and 0.17–0.23 g/kg, respectively. The malic and quinic acid contents of the thinned young fruit were 1.2–4.7-fold and 2.1–4.5-fold higher than those of their ripe counterparts, respectively, which agreed with previously reported results that malic and quinic acid concentrations in young fruit were higher than those in mature fruit.[Citation35] In addition, the citric acid level was lower than the malic acid level in the thinned young fruit but not always in the ripe fruit because the accumulation of malic acid is of a higher priority than that of citric acid. This could be explained by changes in the efficiency of the tricarboxylic acid cycle and differential expression of the corresponding enzymes involved in malic and citric acid synthesis in thinned young and ripe fruit.[Citation33,Citation36]
Regarding the relationship between organic acids and antioxidant capacity, notable correlation was observed for the quinic acid, malic acid, and oxalic acid contents. The citric acid content showed no correlation with antioxidant capacity in agreement with other peach cultivars study.[Citation28] Moreover, the correlation of the total organic acid content with antioxidant capacity was lower than that of each organic acid alone, indicating that the interaction of different organic acids weakened the total antioxidant effect.
Amino acid composition
Amino acids in peaches and nectarines are generally in free or bound forms, providing unique flavors of sweetness (serine, glycine, proline, methionine, and alanine), bitterness (leucine, isoleucine, valine, phenylalanine, tyrosine, histidine and arginine) and sourness (aspartic acid and glutamic acid).[Citation19,Citation37] The total amino acid contents of the ripe fruit of the 7 varieties were in the range of 5.5–8.5 g/kg, while they ranged from 14.4 to 17.0 g/kg in the thinned young fruit (). Specifically, seventeen amino acids were identified and quantified in both the thinned young and ripe fruit. The contents of aspartic acid and glutamic acid in the thinned young fruit ranged from 5.0 to 7.6 g/kg and 1.2 to 1.5 g/kg, accounting for 35.0%-44.7% and 8.2%-10.5% of the total amino acid content, respectively. However, their contents varied from 2.7 to 5.7 g/kg and 0.4 to 0.5 g/kg in the ripe fruit, contributing to approximately 49.6%-66.7% and 5.5%-8.5% of the total amino acid content, respectively. This result indicated that the amino acid composition was prone to aspartic acid accumulation and glutamic acid elimination during the maturation process. In addition, the serine, proline, alanine, glycine, leucine, isoleucine, valine, phenylalanine, tyrosine, histidine, arginine, threonine, and lysine levels were also higher in the thinned young fruit than in the ripe fruit. The results revealed that the thinned young peaches and nectarines were superior to their ripe counterparts in terms of both the total amino acid content and amino acid diversity.
There was a significant correlation of lysine, alanine, threonine, glycine, tyrosine and serine with the antioxidant capacity, and the average correlation coefficients were 0.904, 901, 0.893, 0.889, 0.884 and 0.881, respectively. Proline and histidine showed no significant correlation with the antioxidant capacity.
Multivariate PCA and OPLS-DA analyses
Multivariate data analysis (PCA and OPLS-DA) was applied to graphically evaluate the clustering of the thinned young and ripe peaches and nectarines (score plot) according to their chemical components (loading plot), as well as to determine the correlation degree of each component with the three antioxidant capacity indices ().
Figure 4. Multivariate OPLS-DA and PCA of the physicochemical characteristics of thinned and ripe fruit of 7 Chinese peach and nectarine varieties.
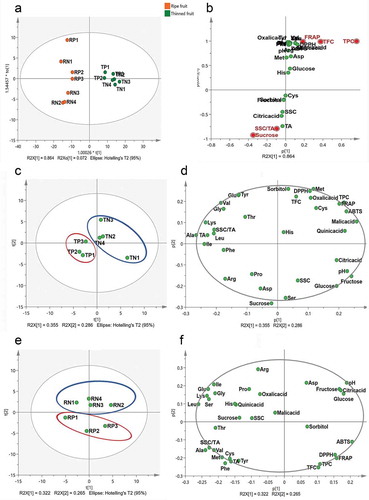
The samples were separated into two classes: thinned young and ripe fruit (*P < .05), which accounted for 75.7% of the variance in OPLS-DA (). The S-plot further illustrated that the neochlorogenic acid, catechin, chlorogenic acid, TPC, TFC and sucrose levels (VIP>1) were distinctive variables between the thinned young and ripe fruit (). Specifically, the neochlorogenic acid, catechin, chlorogenic acid, TPC and TFC levels were the representational indicators in the thinned young fruit, while the sucrose level was the characteristic indicator in the ripe fruit.
PCA analyses established two principal components (PC1/PC2) from the physiochemical parameters of the thinned young fruit, explaining 37.2% and 28.3% of the sample variance, respectively (). The two principle components found for the ripe fruit explained 30.1% and 24.6% of the variance, respectively (). Overall, the score plots of thinned young and ripe fruit were significantly different. For the thinned young fruit, the 4 nectarine varieties could be distinguished from the three peach varieties (). The notable correlated factors in the thinned nectarines were the antioxidant capacity, the contents of all polyphenols excluding quercitrin, the contents of all organic acids, the sorbitol, fructose, glucose, histidine, cystine, and methionine contents and the TA, while the sucrose content, SSC, SSC/TA, pH, the quercitrin content and the contents of 14 amino acids were observably correlated with the thinned young fruit of the three peach varieties. Furthermore, the hyperoside, rutin, citric acid, quinic acid, malic acid, glucose, and fructose contents and the TA were the characteristic factors that distinguished the early-maturing Xiazhizaohong nectarine variety from the other three varieties (). With respect to the ripe fruit, the peaches and nectarines could also be clearly grouped (). The loading plot of the ripe fruit () showed that the antioxidant capacity, the contents of all polyphenols excluding rutin, the sorbitol content, SSC/TA, pH and the contents of 7 amino acids were the characteristic factors in the ripe peaches, which differentiated from the ripe nectarines. Moreover, the late-maturing Guibao98-6-48 and 94-2-12 peach varieties were different from the other variety in terms of the antioxidant capacity, TPC, TFC, neochlorogenic acid content, catechin content and sorbitol content.
Conclusion
This study aimed to explore the relationships between chemical components and antioxidant capacity in the peaches and nectarines. The antioxidant capacity was evaluated with DPPH, FRAP and ABTS assays and was 4.55–11.19-fold, 2.30–8.15-fold and 1.34–3.95-fold higher, respectively, in the thinned young fruit than in the ripe fruit. Notable correlations with antioxidant capacity were observed for the of 5 polyphenols, 3 organic acids, and 6 amino acids contents. Sucrose displayed markedly negative correlation with the antioxidant capacity. In addition, the neochlorogenic acid, catechin, and chlorogenic acid contents, TPC, TFC and the sucrose level were the characteristic variables that distinguished the thinned young fruit from the ripe fruit.
Disclosure statement
There are no conflicts to declare.
Additional information
Funding
References
- Liao, X.; Greenspan, P.; Pegg, R. B. Characterizing the Phenolic Constituents and Antioxidant Capacity of Georgia Peaches. Food Chem. 2019, 271, 345–353. DOI: 10.1016/j.foodchem.2018.07.163.
- Kim, H.-R.; Kim, I.-D.; Dhungana, S. K.; Kim, M.-O.; Shin, D.-H. Comparative Assessment of Physicochemical Properties of Unripe Peach (Prunus Persica) and Japanese Apricot (Prunus mume). Asian Pac. J. Trop. Biomed. 2014, 4, 97–103. DOI: 10.1016/s2221-1691(14)60216-1.
- Martin-Gorriz, B.; Torregrosa, A.; García Brunton, J. Post-bloom Mechanical Thinning for Can Peaches Using a Hand-held Electrical Device. Sci. Hortic. 2012, 144, 179–186. DOI: 10.1016/j.scienta.2012.07.003.
- Hong, C.; Holtz, B. A.; Morgan, D. P.; Michailides, T. J. Significance of Thinned Fruit as a Source of the Secondary Inoculum of Monilinia Fructicola in California Nectarine Orchards. Plant Dis. 1997, 81, 519–524. DOI: 10.1094/PDIS.1997.81.5.519.
- Chen, W.; Guo, Y.; Zhang, J.; Zhang, X.; Meng, Y. Effect of Different Drying Processes on the Physicochemical and Antioxidant Properties of Thinned Young Apple. Int. J. Food Eng. 2015, 11, 207–219. DOI: 10.1515/ijfe-2014-0211.
- Nuncio-Jáuregui, N.; Nowicka, P.; Munera-Picazo, S.; Hernández, F.; Carbonell-Barrachina, Á. A.; Wojdyło, A. Identification and Quantification of Major Derivatives of Ellagic Acid and Antioxidant Properties of Thinning and Ripe Spanish Pomegranates. J. Funct. Foods. 2015, 12, 354–364. DOI: 10.1016/j.jff.2014.11.007.
- Bae, H.; Yun, S. K.; Jun, J. H.; Yoon, I. K.; Nam, E. Y.; Kwon, J. H. Assessment of Organic Acid and Sugar Composition in Apricot, Plumcot, Plum,and Peach during Fruit Development. J. Appl. Bot. Food Qual. 2014, 87, 24–29. DOI: 10.5073/JABFQ.2014.087.004.
- Sun, L.; Sun, J.; Chen, L.; Niu, P.; Yang, X.; Guo, Y. Preparation and Characterization of Chitosan Film Incorporated with Thinned Young Apple Polyphenols as an Active Packaging Material. Carbohydr. Polym. 2017, 163, 81–91. DOI: 10.1016/j.carbpol.2017.01.016.
- Sun, L.; Sun, J.; Thavaraj, P.; Yang, X.; Guo, Y. Effects of Thinned Young Apple Polyphenols on the Quality of Grass Carp (Ctenopharyngodon idellus) Surimi during Cold Storage. Food Chem. 2017, 224, 372–381. DOI: 10.1016/j.foodchem.2016.12.097.
- Sun, L.; Chen, W.; Meng, Y.; Yang, X.; Yuan, L.; Guo, Y.; Gidley, M. J. Interactions between Polyphenols in Thinned Young Apples and Porcine Pancreatic Alpha-amylase: Inhibition, Detailed Kinetics and Fluorescence Quenching. Food Chem. 2016, 208, 51–60. DOI: 10.1016/j.foodchem.2016.03.093.
- Redondo, D.; Venturini, M. E.; Oria, R.; Arias, E. Inhibitory Effect of Microwaved Thinned Nectarine Extracts on Polyphenol Oxidase Activity. Food Chem. 2016, 197, 603–610. DOI: 10.1016/j.foodchem.2015.11.009.
- Rossato, S. B.; Haas, C.; Raseira, M. C.; Moreira, J. C.; Zuanazzi, J. A. Antioxidant Potential of Peels and Fleshes of Peaches from Different Cultivars. J. Med. Food. 2009, 12, 1119–1126. DOI: 10.1089/jmf.2008.0267.
- Nunes, C.; Santos, C.; Pinto, G.; Silva, S.; Lopesdasilva, J. A.; Saraiva, J. A.; Coimbra, M. A. Effects of Ripening on Microstructure and Texture of “Ameixa d’Elvas” Candied Plums. Food Chem. 2009, 115, 1094–1101. DOI: 10.1016/j.foodchem.2008.12.089.
- Cao, X.; Islam, M. N.; Chitrakar, B.; Duan, Z.; Xu, W.; Zhong, S. Effect of Combined Chlorogenic Acid and Chitosan Coating on Antioxidant, Antimicrobial, and Sensory Properties of Snakehead Fish in Cold Storage. Food Sci. Nutr. 2019, 00, 1–9. DOI: 10.1002/fsn3.1378.
- Raiola, A.; Pizzolongo, F.; Manzo, N.; Montefusco, I.; Spigno, P.; Romano, R.; Barone, A. A Comparative Study of the Physico-chemical Properties Affecting the Organoleptic Quality of Fresh and Thermally Treated Yellow Tomato Ecotype Fruit. Int. J. Food Sci. Technol. 2018, 53, 1219–1226. DOI: 10.1111/ijfs.13700.
- Zheng, H.-Z.; Kim, Y.-I.; Chung, S.-K. A Profile of Physicochemical and Antioxidant Changes during Fruit Growth for the Utilisation of Unripe Apples. Food Chem. 2012, 131, 106–110. DOI: 10.1016/j.foodchem.2011.08.038.
- Mokrani, A.; Madani, K. Effect of Solvent, Time and Temperature on the Extraction of Phenolic Compounds and Antioxidant Capacity of Peach (Prunus persica L.) Fruit. Sep. Purif. Technol. 2016, 162, 68–76. DOI: 10.1016/j.seppur.2016.01.043.
- Song, J.; Bi, J.; Chen, Q.; Wu, X.; Lyu, Y.; Meng, X. Assessment of Sugar Content, Fatty Acids, Free Amino Acids, and Volatile Profiles in Jujube Fruits at Different Ripening Stages. Food Chem. 2019, 270, 344–352. DOI: 10.1016/j.foodchem.2018.07.102.
- Sochor, J.; Skutkova, H.; Babula, P.; Zitka, O.; Cernei, N.; Rop, O.; Kizek, R. Mathematical Evaluation of the Amino Acid and Polyphenol Content and Antioxidant Activities of Fruits from Different Apricot Cultivars. Molecules. 2011, 16, 7428–7457. DOI: 10.3390/molecules16097428.
- Brummell, D. A. Cell Wall Disassembly in Ripening Fruit. Funct. Plant Biol. 2006, 33, 103. DOI: 10.1071/fp05234.
- Prasanna, V.; Prabha, T. N.; Tharanathan, R. N. Fruit Ripening Phenomena–an Overview. Crit. Rev. Food Sci. Nutr. 2007, 47, 1–19. DOI: 10.1080/10408390600976841.
- Bowen, J. H.; Watkins, C. B. Fruit Maturity, Carbohydrate and Mineral Content Relationships with Watercore in ‘Fuji’ Apples. Postharvest Biol. Technol. 1997, 11, 31–38. DOI: 10.1016/S0925-5214(97)01409-9.
- Prinsi, B.; Negri, A. S.; Fedeli, C.; Morgutti, S.; Negrini, N.; Cocucci, M.; Espen, L. Peach Fruit Ripening: A Proteomic Comparative Analysis of the Mesocarp of Two Cultivars with Different Flesh Firmness at Two Ripening Stages. Phytochemistry. 2011, 72, 1251–1262. DOI: 10.1016/j.phytochem.2011.01.012.
- Gelly, M.; Recasens, I.; Girona, J.; Mata, M.; Arbones, A.; Rufat, J.; Marsal, J. Effects of Stage II and Postharvest Deficit Irrigation on Peach Quality during Maturation and after Cold Storage. J. Sci. Food Agric. 2004, 84, 561–568. DOI: 10.1002/jsfa.1686.
- Celli, G. B.; Pereira-Netto, A. B.; Beta, T. Comparative Analysis of Total Phenolic Content, Antioxidant Activity, and Flavonoids Profile of Fruits from Two Varieties of Brazilian Cherry (Eugenia uniflora L.) Throughout the Fruit Developmental Stages. Food Res. Int. 2011, 44, 2442–2451. DOI: 10.1016/j.foodres.2010.12.036.
- Redondo, D.; Arias, E.; Oria, R.; Venturini, M. E. Thinned Stone Fruits are a Source of Polyphenols and Antioxidant Compounds. J. Sci. Food Agric. 2017, 97, 902–910. DOI: 10.1002/jsfa.7813.
- Cantin, C. M.; Moreno, M. A.; Gogorcena, Y. Evaluation of the Antioxidant Capacity, Phenolic Compounds, and Vitamin C Content of Different Peach and Nectarine [Prunus persica (L.) Batsch] Breeding Progenies. J. Agric. Food Chem. 2009, 57, 4586–4592. DOI: 10.1021/jf900385a.
- Reig, G.; Iglesias, I.; Gatius, F.; Alegre, S. Antioxidant Capacity, Quality, and Anthocyanin and Nutrient Contents of Several Peach Cultivars [Prunus persica (L.) Batsch] Grown in Spain. J. Agric. Food Chem. 2013, 61, 6344–6357. DOI: 10.1021/jf401183d.
- Font I Forcada, C.; Gradziel, T. M.; Gogorcena, Y.; Moreno, M. Á. Phenotypic Diversity among Local Spanish and Foreign Peach and Nectarine [Prunus persica (L.) Batsch] Accessions. Euphytica. 2014, 197, 261–277. DOI: 10.1007/s10681-014-1065-9.
- Petersen, M.; Hans, J.; Matern, U. Biosynthesis of Phenylpropanoids and Related Compounds. Annu. Plant Rev. 2010, 40, 182–257. DOI: 10.1002/9781444320503.ch4.
- Mokrani, A.; Krisa, S.; Cluzet, S.; Da Costa, G.; Temsamani, H.; Renouf, E.; Richard, T. Phenolic Contents and Bioactive Potential of Peach Fruit Extracts. Food Chem. 2016, 202, 212–220. DOI: 10.1016/j.foodchem.2015.12.026.
- Cantín, C. M.; Gogorcena, Y.; Moreno, M. Á. Analysis of Phenotypic Variation of Sugar Profile in Different Peach and Nectarine [Prunus persica(L.) Batsch] Breeding Progenies. J. Sci. Food Agric. 2009, 89, 1909–1917. DOI: 10.1002/jsfa.3672.
- Jiang, F.; Wang, Y.; Sun, H.; Yang, L.; Zhang, J.; Ma, L. Intracellular Compartmentation and Membrane Permeability to Sugars and Acids at Different Growth Stages of Peach. Sci. Hortic. 2013, 161, 210–215. DOI: 10.1016/j.scienta.2013.06.037.
- Ruan, Y. L. Sucrose Metabolism: Gateway to Diverse Carbon Use and Sugar Signaling. Annu. Rev. Plant Biol. 2014, 65, 33–67. DOI: 10.1146/annurev-arplant-050213-040251.
- Wu, B. H.; Quilot, B.; Génard, M.; Kervella, J.; Li, S. H. Changes in Sugar and Organic Acid Concentrations during Fruit Maturation in Peaches, P. Davidiana and Hybrids as Analyzed by Principal Component Analysis. Sci. Hortic. 2005, 103, 429–439. DOI: 10.1016/j.scienta.2004.08.003.
- Etienne, A.; Génard, M.; Lobit, P.; Mbeguié-A-Mbéguié, D.; Bugaud, C. What Controls Fleshy Fruit Acidity? A Review of Malate and Citrate Accumulation in Fruit Cells. J. Exp. Bot. 2013, 64, 1451–1469. DOI: 10.1093/jxb/ert035.
- Košir, I. J.; Kidrič, J. Identification of Amino Acids in Wines by One- and Two-Dimensional Nuclear Magnetic Resonance Spectroscopy. J. Agric. Food Chem. 2001, 49, 50–56. DOI: 10.1021/jf0008137.