
ABSTRACT
This study investigated the impact of added white oat flour on structure, and acceptability of goat milk yogurt (GMY) as well as antioxidant activity during in vitro digestion. The four GMY formulations prepared were Y0, Y1, Y2, and Y3 that contain 0, 1, 2, 3 g of oat flour/100 g, respectively. There were significant changes in viable counts, pH, and syneresis values for all GMY during storage. All samples retain viable counts above therapeutic level (106 CFU/g) during storage. Antioxidant activity increased at 7 days and after in vitro digestion. Y2 and Y3 displayed the preferable texture and the highest acceptability by diminishing goaty flavor.
Introduction
Currently, there is increasing awareness related to goat milk importance due to its unique characteristics including higher digestibility, [Citation1] hypoallergenicity, [Citation2] and probiotics delivery .[Citation3] However, the production of fermented goat milk products faces technological problems, particularly fragile coagula, alongside their unpleasant goaty flavor .[Citation4] The less firmness described for goat milk products is associated with lower amounts of α-S1-casein, greater micellar dispersion, and larger amounts of colloidal calcium among others .[Citation5] Thus, the coagulum of GMY tends to be soft and less viscous showing a high level of syneresis and a weaker gel .[Citation6] Moreover, the goaty flavor is another problem that resulted from the high content of free octanoic acids present in goat milk, [Citation7] which may reduce its acceptance by certain consumers .[Citation8]
To overcome these defects, various approaches have been evaluated to improve GMY texture such as membrane concentrate, enzymatic cross-linking of milk proteins, high-pressure homogenization, and use of in situ exopolysaccharides producing cultures .[Citation9] However, the traditional ways such as increasing total solid content and adding various stabilizers remain the most commonly used techniques in modifying GMY texture. On the other hand, β-cyclodextrin[Citation7,Citation10] and fruit juices[Citation11,Citation12] were successfully applied to mask the goaty flavor in goat yogurt and cheese.
Like other cereals, oat is a natural promising ingredient and was commonly used as a fat substitute, and texture modifier in yogurt and therefore the product sensory perception could be changed .[Citation13] Its benefits resulted from the presence of a considerable amount of β-glucan, [Citation14] which improved the probiotic survival, and water-holding capacity .[Citation15] Thus, several benefits associated with texture, sensory acceptance, and probiotic viability have been reported for oat flour.
The impact of oat flour on quality attributes of cow yogurt formulations has been widely investigated. However, no extensive studies about its impact on GMY characteristics including structure, microstructure, probiotic viability, and sensory properties are found. To the best of our knowledge, there is only one study conducted by[Citation16] regarding the impact of some flours, including oat flour, on GMY structure. Therefore, the main objective of the current research is to study the effect of incorporation of oat flour on quality attributes (structure, and sensory properties), probiotic survivability, and assessing the behavior of polyphenols antioxidant during in vitro digestion of GMY samples.
Materials and methods
Materials, culture, and chemicals
White oat flour (Avena sativa) was purchased from a local market in Giza, Egypt. ABT-5 lyophilized starter culture composed of mixed strains of S. thermophilus (as a sole fermenting organism) and Lactobacillus acidophilus + Bifidobacterium bifidum (as probiotic organisms) was purchased from Chr. Hansen (Copenhagen, Horsholm, Denmark). Folin-Ciocalteu’s phenol reagent and gallic acid monohydrate were purchased from Fluka (Madrid, Spain), while 2, 2-diphenyl-1-picrylhydrazyl (DPPH) was attained from Sigma Aldrich (Steinheim, Germany). Enzymes and bile salts were purchased from Sigma Chemical Co. (St. Louis MO, USA): Pepsin (Porcine: cat. no. P-7000), Pancreatin (Porcine: cat. no. B-8756), and bile salt (Porcine: cat. no. P-1750). All other solvents, chemicals, and culture media (MRS and M17) were of analytical grade.
Manufacturing of GMY
Fresh goat’s milk was obtained from El-Serw Animal Production Research Station, Animal Production Research Institute, Agricultural Research Center, Egypt in February of 2019. Goat milk was divided into four portions: the first portion represents oat flour-free GMY and named Y0, the second portion was supplemented with 1% oat flour and named Y1, the third portion was supplemented with 2% oat flour and named Y2, and the fourth portion was supplemented with 3% oat flour and named Y3. Goat milk samples were thermally treated at 80 °C for 5 min with continuous stirring and cooled to 42 °C. Then, they were inoculated with ABT-5 lyophilized culture (2%). The fermentation was allowed to be carried out at 41 ± 1°C. After achieving a pH of 4.6, yogurt samples were stored at 5 °C for 14 days. The viable bacterial counts, pH changes, whey syneresis, and polyphenols stability [total phenolic content (TPC), and DPPH• inhibition %] during in vitro digestion of GMY samples were estimated at 1, 7, and 14 days of cold storage while texture profile analysis, and sensory evaluation, were analyzed on the first day of cold storage. On the day of the experiment, pH changes were monitored in separate vessels during 270 min of fermentation at 30 min intervals.
Analytical determination
All analytical determinations were performed in triplicate. The values of different parameters were expressed as mean ± SD.
Composition analysis of oat flour and goat milk
The proximate analysis has been determined in oat flour and goat milk according to the methods described in AOAC .[Citation17] The contents of moisture, fat, ash and total dietary fiber have been estimated by the gravimetric method (AOAC 934.01), soxhlet method (AOAC 954.02), dry incineration in a muffle furnace (AOAC 942.05), and Enzymatic-Gravimetric Method (985.29), respectively. For protein determination, the Kjeldahl method (AOAC 976.05) has been employed, and the obtained data expressed the total nitrogen that was multiplied with factor 6.38, and 6.25 to obtain the total protein content in goat yogurt, and oat flour, respectively. pH was estimated according to .[Citation17] Total carbohydrate (TC) was calculated by difference (TC % = 100–(Moisture + protein + fat + ash).
Changes in pH during GMY fermentation, and cold storage
During fermentation, pH changes were monitored in separate vessels and recorded at 30-min intervals along 270 min. Changes in pH of GMY samples at 1, 7, and 14 days of storage were also monitored and recorded using a glass electrode pH meter (Hanna Instruments, Barcelona, Spain).
Spontaneous whey separation of GMY
The spontaneous whey separation (SWS) of GMY was determined by the drainage method under refrigeration temperature according to[Citation18] using the following equation:
SWS (%) = V1/V2 × 100
where V1: volume of expelled whey collected after draining and V2: volume of yogurt sample.
Viable counts of lactic acid bacteria of GMY
The prepared goat yogurt samples were checked for the microbiological quality standards at 1, 7, and 14 days of storage for coliforms, molds, and yeasts to see if adequate sanitation was followed during product processing and storage. The viable counts of lactic acid bacteria (LAB): S. thermophilus, L. acidophilus, and B. bifidum, were enumerated by using the standard plate count method according to .[Citation19] The results were expressed as a log number of colony-forming units per g (log CFU/g).
Instrumental texture properties analysis of GMY
Texture profile analysis of yogurt samples was measured according to[Citation20] using QTS 20 texture analyzer (model QTS20, Brookfield Instruments, Harlow, UK) equipped with a 5-kg load cell. Texture profile analysis was carried out by a compression test that generated the plot of force (g) versus time (s). A 25-mm-diameter perplex cylindrical probe was used to measure the textural profile of the yogurt samples at 10 ± 0.5°C. In the first stage, the samples were compressed to 10 mm depth and the speed of the probe was fixed at 30 mm/min during the pretest, compression, and relaxation of the samples. The typical textural profile (force-time) curve was obtained with one complete run. Hardness, gumminess, adhesiveness, cohesiveness, and springiness of yogurt samples were calculated by the software program (Texture Pro software, Brookfield Instruments, UK).
Polyphenols compounds and antioxidant activity of GMY after in vitro digestion
All samples (5 g of yogurt mixed with 20 mL of bidistilled deionized water) were digested at 37 C according to the digestion method described by[Citation21] which consists of gastric and intestinal phases. At the end of the intestinal phase, aliquots of 25 g of sample were transferred to polypropylene centrifuge tubes (50 ml, Costar, New York, USA) and centrifuged at 3500 g for 1 h at 4 C. The supernatants (soluble fractions) were used to determine the total phenolic content and antioxidant activity. The working preparations of these enzymes were made immediately before use because the enzyme’s activity may decrease over time according to .[Citation22] Pepsin solution was prepared by dissolving 1.6 g of pepsin in 10 mL of 0.1 M HCl while the pancreatin/bile salt solution was prepared by dissolving 0.2 g of pancreatin and 1.25 g of bile salt in 50 mL of 0.1 M NaHCO3.
Extraction for TPC, and DPPH inhibition estimation
Regarding the preparation of the methanolic extracts of GMY samples, it has been prepared according to[Citation23] by mixing a specific weight of GMY (10 g) with an aqueous methanolic solution (25 mL, 75%), then well-homogenized by vortex and centrifuged at 4402 g for 10 min at 4 °C. The supernatants obtained have been filtered by Whatman No. 1 and the obtained filtrates were maintained at 4 °C.
These filtrates, as well as the soluble fractions of GMY samples obtained after in vitro digestion of GMY, have been used to estimate TPC and antioxidant activity as DPPH• inhibition (%) using Folin-Ciocalteu assay and DPPH assay according to, [Citation24,Citation25] respectively. The results have been expressed as mg GAE/g and DPPH• inhibition (%), respectively.
Sensory evaluation of GMY
GMY samples were sensory evaluated according to the method of[Citation26] modified by[Citation27] for sensory properties (color, texture, flavor, and overall acceptability) using a 5-point hedonic scale, (1 = extremely dislike to 5 = extremely like). Ten expert panelists of Food Technology Research Institute members were recruited to make the sensory evaluation. All those trained panelists were food technologist experts and were chosen based on their desire to participate and their knowledge about dairy products. Also, they were frequent yogurt consumers and did not have any allergies to it. In the training sessions, the panelists studied and discussed the determined sensory attributes including color changes, texture, as well as goaty, and beany flavors. The four GMY samples (Y0, Y1, Y2, and Y3) were presented to the panelists at room temperature (25 °C) in white randomly coded-polystyrene cups (50 g in 100 mL cup). The sensory evaluation of the different descriptors based on the pre-selected descriptors: appearance and color (wheying-off, white color, color changes), body and texture (absence of curd homogeneity, lumps, bubbles), flavor (goaty, and beany flavors), and overall acceptability (the sum of all the character’s results). Usually, after each sample, water was given for cleaning. The sensory evaluation was conducted using a comparative test and fresh yogurt as a reference sample. The data were collected in specifically designed ballots.
Statistical analysis
All data were expressed as mean ± standard deviation of three replicates. Except for the data of texture and sensory evaluation which were analyzed using one-way ANOVA, the other obtained data were statistically analyzed by SPSS statistics 22.0 using two-way ANOVA to assess the significant differences between the means of samples and storage period. The means of results were compared by the Tukey test at a significance level of 5% (p < 0.05).
Results and discussion
Physicochemical characterization of oat flour and goat milk
The mean values of the physicochemical parameters of goat milk and oat flour are shown in . The results indicate that goat milk and oat flour complied with the current standards for pasteurized milk and oat flour. The current findings revealed that goat milk has 12.07% TS, 3.19% protein, 3.11% fat, 0.70% ash, and its pH value was 6.72. These results are similar to those found by[Citation28] and in general agreement with those reported by .[Citation29] Regarding the physicochemical parameters of oat flour, the results displayed that oat flour contained 5.68% moisture (94.32% TS), 3.19% protein, 6.57% fat, 1.93% ash, 5.64% fiber, and 74.19% TC. These findings are in general agreement with the results reported by .[Citation30,Citation31] The slight differences in some parameters could be attributed to the difference in oat flour variety. Oat flour had 115.68 mg GAE/g of TPC and 39.20% of DPPH• inhibition %.
Table 1. Physicochemical parameters of goat milk and oat flour used in goat milk yogurt formulations
pH profile during GMY fermentation; and pH changes during storage
Regarding the curve shape, pH changes during 270 min of GMY processing for the four formulations were somewhat similar particularly for Y1, Y2, and Y3 treatments. pH profile can be divided into four phases (). The induction period represents the first phase which is located in the initial 90 min and it is consistent with that reported by .[Citation32] During this phase, no notable changes were observed in pH values due to that microorganisms are adapting to the substrates. At the second phase of fermentation (between 90 min to 120 min approximately), it was noted a reduction in pH resulted from the beginning of lactose degradation by lactic acid bacteria. It serves as preparation for the next phase, between 120 and 210 min, where pH falls quickly, displaying higher activity of lactic acid bacteria. According to, [Citation32] the flocculation phase coincides with peak viscosity variation in the product. Finally, pH continues to decrease in the last 60 min, but at a lower rate. Similar results were obtained by[Citation33] who exhibited a similar pH profile in yogurts prepared from mixtures of goat and buffalo milks.
Figure 1. pH profile during fermentation of goat milk yogurt with added oat flour. Y0, Y1, Y2, and Y3: goat milk yogurt with 0, 1, 2, and 3% oat flour added
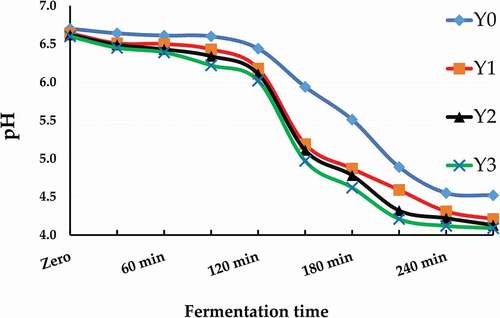
Generally, it was noted that the addition of oat flour led to decrease pH values as compared to oat free-GMY. The higher oat flour added, the lower pH values obtained. The changes in pH values during the storage of GMY are shown in . Generally, pH values gradually decreased along the cold storage period and ranged between 4.62 and 4.08. Y0 displayed the highest pH value at 1, 7, and 14 days while Y3 displayed the lowest pH values at 1, 7, and 14 days of cold storage. The added amounts of oat flour led to a significant reduction (p < .05) in pH values. This reduction in pH could be attributed to the presence of β-glucan[Citation14] which can be metabolized by lactic acid bacteria. Thus, the arising of acidity and reduction of pH were noticed .[Citation34] Similar pH changes in bio-yogurt fortified with oat or barley β-glucan have been obtained by .[Citation35] In contrast, higher pH values in low-fat cow yogurt containing 8, 12, and 16% of oat flour have been reported by .[Citation30] The author attributed this trend to the higher buffering capacity due to higher TS and protein content compared to plain yogurt. On the other, the lower amounts of oat flour used in the current study (ranged between 1–3%) may not have a significant impact on the buffering capacity which is mainly influenced by TS content. The data displayed in support this hypothesis since there is no big difference in TS content between the various formulations.[Citation36] reported also the association between TS content and buffering capacity. Consequently, the viable counts of lactic acid bacteria in all formulations of GMY might be impacted. Thus, its viability has been monitored along the cold storage time.
Table 2. pH values and viable cell counts (log CFU/g) of lactic acid bacteria in goat milk yogurt with added oat flour
Viable counts of LAB in GMY during storage
The results of the microbiological quality analysis achieved satisfactory quality since coliform, mold & yeast were not detected in yogurt treatments along the storage period due to the good hygienic conditions followed during manufacturing and storage (data not shown). The viable cell counts of S. thermophilus, B. bifidum, and L. acidophilus in GMY formulations during storage are displayed in .
Probiotics counts remained above the therapeutic level of 106 CFU/g over the two weeks of storage for all GMY formulations. The addition of oat flour resulted in higher (p < 0.05) viable counts during cold storage. However, probiotics viability during cold storage was almost time-dependent and strain-dependent (p < 0.05). This was expected especially at 14 days due to nutrient depletion, metabolites, and organic acids accumulation as well as H2O2 production, oxygen content, environmental stresses, such as increased acidity and decreased pH. Although probiotic’s survival was time-dependent, their average viable counts remained considerably above the therapeutic threshold, and so, this time dependency is not of practical importance.
Generally, the viable counts significantly increased (p < 0.05) at 7 days and then declined at 14 days. S. thermophilus showed higher viable counts than B. bifidum and L. acidophilus in all GMY samples over the cold storage. The current data are very consistent with those reported by[Citation35] who attributed the decreased growth of lactobacillus to its sensitivity toward high acidity and refrigerated temperature. On the other hand, the high survival of S. thermophilus is mainly resulted from its capability to survive at lower pH over cold storage.
As can be seen in , the inclusion of oat flour improved probiotics viability, and the viable counts are positively correlated with the added amount of oat flour.
This phenomenon could be mainly explained by the presence of oat β-glucan and also the increasing of some available nutrients content, such as carbon and nitrogen sources[Citation37] which together improved bacterial survivability in the final product. Regarding oat β-glucan, it plays a vital role in protecting the probiotics and yogurt culture in yogurt under low temperature and reduced pH[Citation38] leading to improve survival. Similar data were obtained by[Citation35] about increasing probiotics viability in cow yogurt supplemented with oat β-glucan. Thus, it is assumed that such fermented milk products fortified with oat flour can provide satisfactory health benefits due to its high viable counts of probiotic bacteria throughout their shelf-life.
Changes of spontaneous syneresis
Whey separation or syneresis is one of the most important factors that determine yogurt quality and it is well-known as a major defect in yogurt which increased with the progress of storage time. In this process, water is released or extracted from a gel due to gel shrinkage .[Citation39] As can be seen in , Y0 displayed a significant (p ≤ 0.05) higher value of syneresis compared to Y1, Y2, and Y3 along storage time. Generally, syneresis values increased with the progress in storage time but its rate of increase was lower for Y1, Y2, and Y3 formulations. Syneresis values were ranged between 33.5–47.62% for Y0, 29.8–38.12% for Y1, 13.5–22.43% for Y2 and 6.05–13.35% for Y3.
Figure 2. Syneresis values (%) of goat milk yogurt with added oat flour during cold storage. Y0, Y1, Y2, and Y3: goat milk yogurt with 0, 1, 2, and 3% oat flour added. Values are mean ± SD of three independent replicates. Column charts with different letters are significantly different (p < 0.05)
Thus, the increased added amount of oat flour, the decreased syneresis value obtained. Remarkably, the most pronounced reduction of syneresis was obtained for Y3. This reduction is mainly linked with the increased TS, [Citation40] and also some oat flour ingredients including polyphenols and β-glucan. In this sense, plant polyphenols could interact with milk casein resulting in increased stability of casein networks and water retention capability and consequently lower syneresis obtained .[Citation41]
Moreover, oat β-glucan can provide yogurt with desirable texture properties thanks to its remarkable high viscosity and its high gelling and thickening properties .[Citation42] Our results are in general agreement with the work performed by[Citation34] who studied the impact of roasted date seeds powder on the quality characteristics of fermented milk beverages.
Texture characteristics of GMY
The texture properties are considered one of the most important factors that determine yogurt quality and comprise several physical properties such as hardness, cohesiveness, springiness, chewiness, and adhesiveness. These properties represent an important quality determinant of fermented dairy products, particularly yogurt. As can be seen in , hardness, cohesiveness, springiness, and chewiness values were significantly different and increased in response to the added amount of oat flour in the following order: Y3 > Y2 > Y1 > Y0. Y0 presented the lowest values of hardness, cohesiveness, springiness, and chewiness while Y3 presented the highest values of these parameters. Regarding adhesiveness, Y0 had the highest value of adhesiveness while Y3 had the lowest value.
Table 3. Texture properties of goat milk yogurt with added oat flour
Structurally, goat milk often provides yogurt with a less firm texture and weaker coagulum, [Citation43] which resulted from its lack of αs1-casein, [Citation44] lower content of casein, and its smaller micelles .[Citation45] Thus, goat milk texture, alongside the goaty flavor, represents the main defect that negatively influences its production and consumption. To overcome the less firm texture of GMY, increasing total solids, adding stabilizers such as pectin, [Citation46] polymerized whey protein, Beta-cyclodextrin, [Citation27] and microbial transglutaminase[Citation9] were evaluated. Moreover, flours derived from the food of plant origin were added into goat milk to improve the microstructure and texture of its yogurt.
The improved texture was reported for GMY fortified with six types of flours including oat flour. The impact of oat flour on modifying GMY texture could be attributed to its role in increasing the total solids and total protein contents. Also, its content of dietary fiber including Β-glucan has a desirable impact on yogurt body and texture, and viscosity, and consistency .[Citation16] These improved texture properties could be probably explained by oat β-glucan interaction with casein that could stabilize its protein network.
Polyphenols stability of GMY after in vitro digestion
The phenolic profile estimated as TPC (mg GAE/g) of GMY samples before and after in vitro digestion is presented in . These results exhibited that TPC values gradually increased with the progress of cold storage until 7 days then slightly declined at 14 days. Also, plain GMY (Y0) had the lowest values of TPC. Generally, milk and its products are not considered a source of polyphenols. However, TPC values in plain yogurt (Y0) refer to the phenolic compounds associated with the breakdown of milk proteins.
Table 4. Total phenolic content (TPC, mg GAE/g) in undigested and digested goat milk yogurt with added oat flour
Since some amino acids containing phenolic side chain, such as tyrosine, increased TPC reading measured by the Folin-Ciocalteu assay .[Citation47] As can be seen in , adding oat flour proportionally raised TPC values.
This observation is in general agreement with the findings reported by[Citation48] who reported that herbal-yogurt showed higher TPC values than plain yogurt and attributed this observation to the polyphenols constitutes presented in the herbs.
Moreover, the current results displayed that higher TPC values have been obtained for the digested GMY samples as compared to undigested GMY samples. The highest TPC values have been recorded for Y3 followed by Y2˂Y1˂Y0 at 1, 7, and 14 days of cold storage. These results proposed that in vitro digestion improves the liberation of polyphenols from the food matrix by the action of digestive enzymes and pH. Thus, the phenols attached to the macromolecules, such as carbohydrates and proteins, are released[Citation49] and hence increased its concentration. Additionally, the simple form of polyphenols (monomeric ones) is formed from the degradation of the complex form of polyphenols (polymeric ones) under the simulated in vitro digestion .[Citation50]
Similarly,[Citation51] obtained higher values of TPC in whole grains, including oat, subjected to in vitro digestion, and attributed this impact to the release of phenolic acids bound to proteins. Besides, the release of large amounts of peptides with aminophenol amino acid (tyrosine, tryptophan) and/or sulfur amino acid (cysteine), which could react with the Folin-Ciocalteu’s reagent, may participate in obtaining higher values of TPC. This former observation can be considered another explanation for increasing TPC values in yogurt and fermented dairy products as these products represent a good source of proteins and their derived peptides through the fermentation and digestion processes. For these reasons, the TPC values were higher in the digested yogurt samples than in undigested yogurt samples.
Antioxidant activity of GMY after in vitro digestion
The antioxidant activity measured as DPPH• inhibition (%) is shown in . These findings displayed a positive association between the content of total phenols and the antioxidant activity. Increased TPC values are accompanied by increased DPPH• inhibition (%). The data exhibited that DPPH inhibition increased with adding oat flour and also after digestion. The highest values of DPPH• inhibition were recorded for Y3 followed by Y2˂Y1˂Y0 at 1, 7, and 14 days of cold storage. A slight decrease in antioxidant activity was observed at 14 days as compared to 7 days. The higher antioxidant activity of oat flour containing-GMY samples may be associated with the polyphenols presented in oat flour. The activity and growth of yogurt bacteria may contribute to the highest inhibition of DPPH• oxidation at 7 days of cold storage[Citation52] by modifying some phenolic compounds and therefore their antioxidant activities .[Citation53] Degradation of polyphenols at the final storage time[Citation54] along with increased milk protein-polyphenols interaction[Citation55] may participate in the reduction that occurred in antioxidant activity.
Table 5. DPPH• inhibition (%) in undigested and digested goat milk yogurt with added oat flour
The increase in DPPH• inhibition in the digested yogurt samples could be associated with the increase in phenolic compounds following the in vitro digestion, proposing that digestion conditions could improve the liberation of antioxidants from the food matrix.[Citation56] reported a considerable increment in antioxidant activity and attributed this phenomenon to the changes of composition, activity, and structure of water-soluble, low-molecular-weight antioxidants that occurred by the actions of digestive enzymes and pH. In light of these results, it is preferable to consume yogurt during the first seven days after processing as it contains a large number of viable bacteria and has high antioxidant activity.
Sensory evaluation
The sensory properties of food products strongly impact consumer acceptance. Accordingly, the lower acceptance of goat dairy products could be attributed to their sharp unpleasant goaty flavor. So, several studies aimed at overcoming this limitation and improving GMY flavor by adding plant- or fruit-based materials .[Citation57] The average scores of all sensorial attributes of GMY samples are presented in . Regarding the color descriptor, all formulations had almost similar scores (their values ranged between 4.5–5.0) and insignificant changes (p < 0.05) have been observed.
Table 6. Sensory properties of goat milk yogurt with added oat flour
Also, Y0 received the lowest scores (p < 0.05) of texture, flavor, and overall acceptability (2.0, 1.0, and 1.0, respectively). This can be mainly attributed to the sharp goaty flavor and the semi-liquid state described for Y0. In the same context, the flavor had a significant influence (p < 0.05) on the overall acceptability of yogurt .[Citation58] Besides, texture also has a considerable impact on consumer acceptance, especially in products derived from goat milk. Increasing added levels of oat flour significantly improved the texture and consistency of GMY due to its ability to reduce the whey separation thanks to the presence of dietary fiber.
Thus, strong curds integrity without any sign of shrinkage, the disintegration into lumps, and syneresis were obtained, especially for Y2 and Y3 without significant difference observed (p < 0.05). The panelists showed that Y2 and Y3 had pronounced harder texture while Y0 and Y1 had softer structure. Regarding the flavor, Y0 had a specific and typical flavor described for GMY representing its main defect while Y1 had a somewhat mild goaty flavor; Y2 had no goaty flavor and gained the highest score, and Y3 had somewhat mild beany flavor, the flavor associated with legumes. Thus, oat flour is useful in masking the goaty flavor, especially upon using 2% oat flour. Remarkably, Y3 had the highest score of texture (4.5) and the second-highest score of flavor (4.0) while Y2 had the highest score of flavor (5.0) and the second-highest score of texture (4.5). Hence, the highest overall acceptability was obtained for Y2 (4.5) followed by Y3 (4.0) without a significant difference.
Conclusion
The findings of the current study revealed that oat flour represents a prominent natural ingredient in improving probiotics survivability, providing the desirable texture, and weakening the goaty flavor. It also reduced the syneresis and improved GMY texture. Besides, oat flour also improved the phenolic content and antioxidant activity of the resultant GMY and this improvement was higher after in vitro digestion. Thus, oat flour can be successfully used in developing GMY with desirable quality attributes and higher antioxidant activity.
Additional information
Funding
References
- Schorsch, B. C.; Wilkins, D. K.; Jones, M. G.; Norton, I. T. Gelation of Casein-whey Mixtures: Effects of Heating Whey Proteins Alone or in the Presence of Casein Micelles. J. Dairy Res. 2001, 68(3), 471–481. DOI: https://doi.org/10.1017/S0022029901004915.
- Ranadheera, S. C.; Evans, C. A.; Adams, M. C.; Baines, S. K. Probiotic Viability and Physico-chemical and Sensory Properties of Plain and Stirred Fruit Yogurts Made from Goat’s Milk. Food Chem. 2012, 135(3), 1411–1418. DOI: https://doi.org/10.1016/j.foodchem.2012.06.025.
- Paz, N. F.; Oliveira, E. G. D.; Kairuz, M. S. N. D.; Ramón, A. N. Characterization of Goat Milk and Potentially Symbiotic Non-fat Yogurt. Food Sci. Technol. 2014, 34(3), 629–635. DOI: https://doi.org/10.1590/1678-457x.6409.
- Tamime, A.; Wszolek, M.; BozaniI, R.; Ozer, B. Popular Ovine and Caprine Fermented Milks. Small Ruminant Res. 2011, 101(1–3), 2–16. DOI: https://doi.org/10.1016/j.smallrumres.2011.09.021.
- Park, Y.; Juarez, M.; Ramos, M.; Haenlein, G. Physico-chemical Characteristics of Goat and Sheep Milk. Small Ruminant Res. 2007, 68(1–2), 88–113. DOI: https://doi.org/10.1016/j.smallrumres.2006.09.013.
- Madhubasani, G. B. L.; Prasanna, P. H. P.; Chandrasekara, A.; Gunasekara, D. C. S.; Senadeera, P.; Chandramali, D. V. P.; Vidanarachchi, J. K. Exopolysaccharide Producing Starter Cultures Positively Influence on Microbiological, Physicochemical, and Sensory Properties of Probiotic Goats’ Milk Set‐yoghurt. J. Food Process. Pres. 2020, 44(3), 1–8. DOI: https://doi.org/10.1111/jfpp.14361.
- Young, O. A.; Gupta, R. B.; Sadooghy-Saraby, S. Effects of Cyclodextrins on the Flavor of Goat Milk and Its Yogurt. J. Food Sci. 2012, 77(2), S122–S127. DOI: https://doi.org/10.1111/j.1750-3841.2011.02557.x.
- Haenlein, G.;. Goat Milk in Human Nutrition. Small Ruminant Res. 2004, 51(2), 155–161. DOI: https://doi.org/10.1016/j.smallrumres.2003.08.010.
- Farnsworth, J. P.; Li, J.; Hendricks, G. M.; Guo, M. R. Effects of Transglutaminase Treatment on Functional Properties and Probiotic Culture Survivability of Goat Milk Yogurt. Small Ruminant Res. 2006, 65(1–2), 113–121. DOI: https://doi.org/10.1016/j.smallrumres.2005.05.036.
- Sakr, S. S.;. Reducing Goat Milk Flavor by Beta–cyclodextrin (β-cd) and Its Effect on Texture and Microstructure in Soft Goat Cheese. J. Food Dairy Sci. 2017, 8(4), 179–183. DOI: https://doi.org/10.21608/jfds.2017.38197.
- Temiz, H.;. Arakcı, Z.T.; Arilgac, T.Y.; Dağ, B. Some Physicochemical Properties and Mineral Contents of Stirred Yoghurts Containing Different Fruit Marmalades. Int. J. Dairy Technol. 2018, 71(1), 264–268. DOI: https://doi.org/10.1111/1471-0307.12420.
- Wang, H.; Wang, C. N.; Guo, M. R. Effects of Addition of Strawberry Juice Pre-or Post-fermentation on Physicochemical and Sensory Properties of Fermented Goat Milk. J. Dairy Sci. 2019, 102(6), 4978–4988. DOI: https://doi.org/10.3168/jds.2018-15750.
- Guggisberg, D.; Cuthbert-Steven, J.; Piccinali, P.; Bütikofer, U.; Eberhard, P. Rheological, Microstructural and Sensory Characterization of Low-fat and Whole Milk Set Yoghurt as Influenced by Inulin Addition. Int. Dairy J. 2009, 19(2), 107–115. DOI: https://doi.org/10.1016/j.idairyj.2008.07.009.
- Rasane, P.; Jha, A.; Kumar, N.; Sharma, N. Reduction in Phytic Acid Content and Enhancement of Antioxidant Properties of Nutri-cereals by Processing for Developing Fermented Baby Food. J. Food Sci. Technol. 2015, 52(6), 3219–3234. DOI: https://doi.org/10.1007/s13197-014-1375-x.
- Frey, K.;. Genetic Responses of Oats Genotypes to Environmental Factors. Field Crops. Res. 1998, 56(1–2), 183–185. DOI: https://doi.org/10.1016/S0378-4290(97)00128-7.
- Nakthong, S.;. Effect of Flour on the Microstructure of Goat Milk Yoghurt. J. Anim. Vet. Adv. 2012, 11(23), 4413–4416.
- AOAC. Official Methods of Analysis. Association of Official Analytical Chemists (19ed.), 2012, Gaithersburg (Maryland): AOAC International, Washington, D.C.
- Isanga, J.; Zhang, G. Production and Evaluation of Some Physicochemical Parameters of Peanut Milk Yoghurt. LWT– Food Sci. Technol. 2009, 42(6), 1132–1138. DOI: https://doi.org/10.1016/j.lwt.2009.01.014.
- Najgebauer-Lejko, D.;. Effect of Green Tea Supplementation on the Microbiological, Antioxidant, and Sensory Properties of Probiotic Milks. Dairy Sci. Technol. 2014, 94(4), 327–339. DOI: https://doi.org/10.1007/s13594-014-0165-6.
- Hashim, I. B.; Khalil, A. H.; Afifi, H. S. Quality Characteristics and Consumer Acceptance of Yogurt Fortified with Date Fiber. J. Dairy Sci. 2009, 92(11), 5403–5407. DOI: https://doi.org/10.3168/jds.2009-2234.
- Perales, S.; Barberá, R.; Lagarda, M. J.; Farré, R. Availability of Iron from Milk-based Formulas and Fruit Juices Containing Milk and Cereals Estimated by in Vitro Methods (Solubility, Dialysability) and Uptake and Transport by Caco-2 Cells. Food Chem. 2007, 102(4), 1296–1303. DOI: https://doi.org/10.1016/j.foodchem.2006.07.019.
- Aly, E.; López-Nicolás, R.; Darwish, A. A.; Frontela-Saseta, C.; Ros-Berruezo, G. Supplementation of Infant Formulas with Recombinant Human Lactoferrin And/or Galactooligosaccharides Increases Iron Bioaccessibility as Measured by Ferritin Formed in Caco-2 Cell Model. Food Res. Inter. 2016, 89, 1048–1055. DOI: https://doi.org/10.1016/j.foodres.2016.08.030.
- Ozturk, H. I.; Aydına, S.; So¨zerib, D.; Demircia, T.; Sertc, T.; Akın, N. Fortification of Set-type Yoghurts with Elaeagnus Angustifolia L. Flours: Effects on Physicochemical, Textural, and Microstructural Characteristics. LWT-Food Sci. Technol. 2018, 90, 620–626. DOI: https://doi.org/10.1016/j.lwt.2018.01.012.
- Arnous, A.; Makris, D. P.; Kefalas, P. Correlation of Pigment and Flavanol Content with Antioxidant Properties in Selected Aged Regional Wines from Greece. J. Food Compos. Anal. 2002, 15(6), 655–665. DOI: https://doi.org/10.1006/jfca.2002.1070.
- Jung, J.; Paik, H. D.; Yoon, H. J.; Jang, H. J.; Jeewanthi, R. K. C.; Jee, H. S.; Li, X.; Lee, N. K.; Lee, S. K. Physicochemical Characteristics and Antioxidant Capacity in Yogurt Fortified with Red Ginseng Extract. Korean J. Food Sci. Anim. Resour. 2016, 36(3), 412–420. DOI: https://doi.org/10.5851/kosfa.2016.36.3.412.
- Wang, C.; Gao, F.; Zhang, T.; Wang, Y.; Guo, M. Physiochemical, Textural, Sensory Properties and Probiotic Survivability of Chinese Laosuan Nai (Protein-fortified Set Yoghurt) Using Polymerized Whey Protein as a Co-thickening Agent. Int. J. Dairy Technol. 2015, 68(2), 261–269. DOI: https://doi.org/10.1111/1471-0307.12186.
- Wang, C.; Wang, C.; Gao, F.; Xu, Y.; Guo, M. Effects of Polymerized Whey Protein on Goaty Flavor and Texture Properties of Fermented Goat Milk in Comparison with β-cyclodextrin. J. Dairy Res. 2018, 85(4), 465–471. DOI: https://doi.org/10.1017/S0022029918000742.
- Silva, F. A.; De Oliveira, M. E. G.; De Figueirêdo, R. M. F.; Sampaio, K. B.; De Souza, E. L.; De Oliveira, C. E. V.; Ointado, M. M. E. Do Egypto, R.D.C.R. The Effect of Isabel Grape Addition on the Physicochemical, Microbiological and Sensory Characteristics of Probiotic Goat Milk Yogurt. Food Funct. 2017, 8(6), 2121–2132. DOI: https://doi.org/10.1039/C6FO01795A.
- Hamad, M. N. E. F.; Ismail, M. M.; Elraghy, E. M. Impact of Addition Tamr and Honey on Chemical Composition, Starter Activity and Rheological Properties of Goat’s Milk. Amer. J. Food Sci. Nutr. 2017, 4(3), 17–22.
- Tesfaye, Y.; Effect of Oat Flour Addition on the Physico-chemical and Microbiological Quality of Probiotic Bio-yoghurt. Doctoral dissertation, Addis Ababa University, Addis Ababa, Ethiopia, 2013
- Kudake, D. C.; Pawar, A. V.; Muley, A. B.; Parate, V. R.; Talib, M. I. Enrichment of Wheat Flour Noodles with Oat Flour: Effect on Physical, Nutritional, Antioxidant and Sensory Properties. Int. J. Curr. Microbiol. Appl. Sci. 2017, 6(12), 204–213. DOI: https://doi.org/10.20546/ijcmas.2017.612.026.
- Hassan, A.; Frank, J.; Farmer, M.; Schmidt, K.; Shalabi, S. Formation of Yoghurt Microstructure and Three-dimensional Visualization as Determined by Confocal Scanning Laser Microscopy. J. Dairy Sci. 1995, 78, 2629–2636. DOI: https://doi.org/10.3168/jds.S0022-0302(95)76892-8.
- Bezerra, M. F.; Souza, D. F. P.; Correia, R. T. Acidification Kinetics, Physicochemical Properties and Sensory Attributes of Yoghurts Prepared from Mixtures of Goat and Buffalo Milks. Int. J. Dairy Technol. 2012, 65(3), 437–443. DOI: https://doi.org/10.1111/j.1471-0307.2012.00845.x.
- Darwish, A. A.; El-Deeb, A. M.; Elgindy, A. A. Viability of Probiotic Bacteria in Fermented Milk Beverages Containing Roasted Date Palm Kernel. Middle East J. Appl. Sci. 2018, 8(4), 1273–1289.
- Elsanhoty, R. M.; Ramadan, M. F. Changes in the Physicochemical and Microbiological Properties of Probiotic-fermented Low-fat Yoghurt Enriched with Barley β-glucan during Cold Storage. J. Dairy Prod. Proc. Imp. 2018, 68(4), 295–309.
- Kristo, E.; Biliaderis, C.; Tzanetakis, N. Modelling of Rheological, Microbiological and Acidification Properties of a Fermented Milk Product Containing a Probiotic Strain of Lactobacillus Paracasei. Int. Dairy J. 2003, 13(7), 517–552. DOI: https://doi.org/10.1016/S0958-6946(03)00074-8.
- Souza, R. P.; Perego, P.; Oliveira, M. N.; Converti., A. Effect of Inulin as Prebiotic and Synbiotic Interactions between Probiotics to Improve Fermented Milk Firmness. J. Food Eng. 2011, 107(1), 36–40. DOI: https://doi.org/10.1016/j.jfoodeng.2011.06.005.
- Lazaridou, A.; Serafeimidou, A.; Biliaderis, C. G.; Moschakis, T.; Tzanetakis, N. Structure Development and Acidification Kinetics in Fermented Milk Containing Oat β-glucan, a Yogurt Culture and a Probiotic Strain. Food Hydrocoll. 2014, 39, 204–214. DOI: https://doi.org/10.1016/j.foodhyd.2014.01.015.
- García-Pérez, F. J.; Lario, Y.; Fernandez-Lopez, J.; Sayas, E.; Pérez-Alverez, J. A.; Sendra, E. Effect of Orange Fiber Addition on Yoghurt Color during Fermentation and Cold Storage. Ind. Appl. 2005, 30, 457–463.
- Mahdian, E.; Tehrani, M. M. Evaluation of the Effect of Milk Total Solids on the Relationship between Growth and Activity of Starter Cultures and Quality of Concentrated Yoghurt. Eur. J. Agric. Environ. Sci. 2007, 2(5), 587–592.
- Oliveira, A.; Alexandre, E. M. C.; Coelho, M.; Lopes, C.; Almeida, D. P. F.; Pintado, M. Incorporation of Strawberries Preparation in Yoghurt: Impact on Phytochemicals and Milk Proteins. Food Chemistry. 2015, 171, 370–378. DOI: https://doi.org/10.1016/j.foodchem.2014.08.107.
- Lyly, M.; Salmenkallio-Marttila, M.; Suortti, T.; Autio, K.; Poutanen, K.; Lähteenmäki, L. The Sensory Characteristics and Rheological Properties of Soups Containing Oat and Barley β-glucan before and after Freezing. LWT-Food Sci. Technol. 2004, 37(7), 749–761. DOI: https://doi.org/10.1016/j.lwt.2004.02.009.
- Costa, M. P.; Monteiro, M. L. G.; Frasao, B. S.; Silva, V. L. M.; Rodrigues, B. L.; Chiappini, C. C. J.; Conte-Junior, C. A. Consumer Perception, Health Information, and Instrumental Parameters of Cupuassu (Theobroma Grandiflorum) Goat Milk Yogurts. J. Dairy Sci. 2017, 100(1), 157–168. DOI: https://doi.org/10.3168/jds.2016-11315.
- Zhang, T.; Mccarthy, J.; Wang, G.; Liu, Y.; Guo, M. Physiochemical Properties, Microstructure, and Probiotic Survivability of Nonfat Goats’ Milk Yogurt Using Heat-treated Whey Protein Concentrate as Fat Replacer. J. Food Sci. 2015, 80(4), M788–M794. DOI: https://doi.org/10.1111/1750-3841.12834.
- Domagała, J.;. Instrumental Texture, Syneresis, and Microstructure of Yoghurts Prepared from Goat, Cow and Sheep Milk. Int. J. Food Prop. 2009, 12(3), 605–615. DOI: https://doi.org/10.1080/10942910801992934.
- Kazmierski, M.; Wicker, L.; Corredig, M. Interactions of β-lactoglobulin and High-methoxyl Pectins in Acidified Systems. J. Food Sci. 2003(46), 1673–1679. https://onlinelibrary.wiley.com/doi/epdf/10.1111/j.1365-2621.2003.tb12312.x.
- Shah, N. P.;. Effect of Milk-derived Bioactives: An Overview. Br. J. Nutr. 2000, 84(Suppl. S1), 3–10. DOI: https://doi.org/10.1017/S000711450000218X.
- Amirdivani, S.; Baba, A. S. Changes in Yogurt Fermentation Characteristics, and Antioxidant Potential and in Vitro Inhibition of Angiotensin-1 Converting Enzyme upon the Inclusion of Peppermint, Dill and Basil. LWT-Food Sci. Technol. 2011, 44(6), 1458–1464. DOI: https://doi.org/10.1016/j.lwt.2011.01.019.
- Saura-Calixto, F.; Serrano, J.; Goñi, I. Intake and Bioaccessibility of Total Polyphenols in a Whole Diet. Food Chem. 2007, 101(2), 492–501. DOI: https://doi.org/10.1016/j.foodchem.2006.02.006.
- Mrduljaš, N.; Krešić, G.; Bilušić, T. Polyphenols: food sources and health benefits. Functional Food-Improve Health through Adequate Food (Ed: Maria Chavarri Hueda), IntechOpen: London, United Kingdom, 2017, 23-41. DOI:https://doi.org/10.5772/intechopen.68862.
- Gong, E. S.; Gao, N.; Li, T.; Chen, H.; Wang, Y.; Si, X.; Tian, J.; Shu, C.; Luo, S.; Zhang, J.; et al. Effect of in Vitro Digestion on Phytochemical Profiles and Cellular Antioxidant Activity of Whole Grains. Journal of Agricultural and Food Chemistry. 2019, 67(25), 7016–7024. DOI: https://doi.org/10.1021/acs.jafc.9b02245.
- Papadimitriou, C. G.; Mastrojiannaki, A. V.; Silva, A. V.; Gomes, A. M.; Malcata, F. X.; Alichanidis, E. Identification of Peptides in Traditional and Probiotic Sheep Milk Yoghurt with Angiotensin I-converting Enzyme (Ace)-inhibitory Activity. Food Chem. 2007, 105(2), 647–656. DOI: https://doi.org/10.1016/j.foodchem.2007.04.028.
- Blum, U.;. Effects of Microbial Utilization of Phenolic Acids and Their Phenolic Acid Breakdown Products on Allelpathic Interactions. J. Chem. Ecol. 1998, 24(4), 685–708. DOI: https://doi.org/10.1023/A:1022394203540.
- Yildiz, O.; Eyduran, S. P. Functional Components of Berry Fruits and Their Usage in Food Technologies. Afr. J. Agr. Res. 2009, 4, 422–426.
- Yuksel, Z.; Avci, E.; Erdem, Y. K. Characterization of Binding Interactions between Green Tea Flavanoids and Milk Proteins. Food Chem. 2010, 121(2), 450e456. DOI: https://doi.org/10.1016/j.foodchem.2009.12.064.
- Baublis, A.; Decker, E. A.; Clydesdale, F. M. Antioxidant Effect of Aqueous Extracts from Wheat-based Ready-to-eat Breakfast Cereals. Food Chem. 2000, 68(1), 1–6. DOI: https://doi.org/10.1016/S0308-8146(99)00142-9.
- Feng, C.; Wang, B.; Zhao, A.; Wei, L.; Shao, Y.; Wang, Y.; Cao, B.; Zhang, F. Quality Characteristics and Antioxidant Activities of Goat Milk Yogurt with Added Jujube Pulp. Food Chem. 2019, 277, 238–245. DOI: https://doi.org/10.1016/j.foodchem.2018.10.104.
- Joseph, A. O.; Olugbuyiro, J. E. Physicochemical and Sensory Evaluation of Market Yoghurt in Nigeria. Pak. J. Nutr. 2011, 10(10), 914–918. DOI: https://doi.org/10.3923/pjn.2011.914.918.