
 ?Mathematical formulae have been encoded as MathML and are displayed in this HTML version using MathJax in order to improve their display. Uncheck the box to turn MathJax off. This feature requires Javascript. Click on a formula to zoom.
ABSTRACT
The objective of the present research work was to explore the nutritional composition of different infant formulas and determine the safety status of these products. For this purpose, different infant formula brands were procured from the local market of Faisalabad, Pakistan. After the collection of these different brands, nutritional composition, i.e. fat, protein, ash, moisture and fiber was determined whilst the microbial analysis, such as Salmonella, Yeasts and Molds Count, and Total Bacteria Count, was carried out through their methods. In addition, the amino acid profile was assessed through paper chromatography. Furthermore, an appropriate statistical design was carried out to determine the level of significance. Mean values for amino acids, i.e. lysine, valine and cysteine varied from 3.06 g/100 g to 6.63 g/100 g, 4.90 g/100 g to 6.51 g/100 g, and 2.32 g/100 g to 3.04 g/100 g, respectively, in different brands of infant formula. Moreover, moisture content, crude proteins, crude fat, crude fiber, ash content, and nitrogen-free extract (NFE) varied from 1.6% to 3.83%, 10.55% to 14.67%, 9.82% to 26.63%, 1.00% to 4.13%, 1.87% to 4.20%, and 51.03% to 69.17%, respectively. It is evident from the microbiological analyses that Salmonella was not present in any brand of infant formula. Whereas yeast and mold counts were ≤2 cfu/g to ≤10 cfu/g in different brands. Moreover, total bacteria count was exhibited in the range of 1.5 × 10³cfu/g to 6.3 × 10³ cfu/g among different brands. Local infant formulas contained high amounts of heavy metals, i.e. 0.99 pp, of lead content followed by cadmium and aluminum as 0.28–0.98 ppm and 1.48–2.05 ppm, respectively. Conclusively, it is evident from whole research that local brands contained higher contents of heavy metal as compared to branded.
Introduction
Nutrition gains much attention for its vital role in maintaining physical health and curing several serious diseases. A poor nutritional state can cause stress regarding health and the economy.[1] Pakistan has been reported to have one of the highest levels of prevalence of child malnutrition compared to other developing countries. According to the national survey, one-third of the children are suffering from malnutrition in Pakistan, with stunned growth of 30–40% and 14% children being underweight.[Citation1,Citation2]
Milk is considered as a fundamental food for infants to overcome the risk of malnutrition as it contains all macronutrients.[Citation3] WHO declared that the first six months of life children should exclusively rely on breastfeeding.[Citation4] However, not more than 35% of the world’s infants are breast fed at this age.[Citation5] Thus, the need for energy from complementary foods increases by 200 kCal/day for 6–8 months to 500 kCal/day for 12–23 months, respectively.[Citation6,Citation7]
Infant formulas are the fastest growing food category. It is considered to become an adequate solution for infant feeding. Many industrial experts indicated that infant formulas production increases 8–9% per annum.[Citation8] The availability of sufficient nutrition during the first six months of a child's life is important. The issues of quality and safety are essential for infants’ and children’s health.[Citation9] Safety issues due to microbial contamination are not limited to commercial baby food but microorganisms and aflatoxins can also cause crucial contamination to breast milk and complementary foods.[Citation10]
Specific powdered infant formula (PIF) microbes are commonly tested for Staphylococcus aureus, Salmonella, Clostridium perfringens, Bacillus cereus, and Enterobacteriaceae (or coliforms).[Citation11] Common features of outbursts of Salmonella infection in the PIF was low to negligible presence. Such levels are very difficult to detect and may be minimized by currently used conventional methodologies or conventional sampling techniques. Production-level measures are necessary to minimize the risk of PIF’s intrinsic contamination with Salmonella.[Citation12]
Enterobacter sakazakii is commonly detected in commercially produced artificial milk powder.[Citation13] The Food and Agriculture Organization in collaboration with WHO,[Citation14] described E. sakazakii as one of the two most pathogenic organisms.
Infant foods are the main source of heavy metal intake of this population, mainly due to the contamination of the raw materials used.[Citation15] Some heavy metals in different brands of artificial milk have been reported in the US, UK, and other countries.[Citation16] It is well known that Pb, Cd, As, Al, Sn, Hg are toxic and children tend to be more sensitive to these metals.[Citation17] Although the benefits of infant formulas were diverse as their main source of food for infants, on the other side the presence of contaminants can cause severe health risks in children.[Citation18] Thus, the chemical composition and elemental composition of commercial milk formulas are vital. The major objective/aim of the current research work was to explore the nutritional composition as well as safety assessment of infant formula available in local market of Pakistan.
Materials and methods
Procurement of raw material
Ten different infant formulas (branded and local) were procured from the market. The collated samples were coded as NN1, NL2, SN3, PA4, NC5, MT6, MB7, BM8, AA9, and SI10 (). The required chemicals were obtained from the scientific store.
Table 1. Infant formulas samples description
Chemical analysis
The infant formula was analyzed for proximate composition, i.e., moisture, ash content, crude fiber, crude protein, crude fat, and nitrogen-free extract (NFE).[Citation19]
Moisture and ash content
The moisture percentage was calculated by following (AACC)[Citation20] method No. 44-I5A. Ash content was calculated by means of following method No. 08–01 as in (AACC).[Citation20]
Crude fat, fiber and protein
The crude fat content in infant formula samples was determined by using Soxhlet apparatus according to method no. 30–25 described in (AACC).[Citation20] Crude fiber was analyzed by some modification of method no. 32–10 mentioned in (AACC).[Citation20] The nitrogen content of infant formula samples was calculated by using Kjeldahl’s method according to method No 46–10 of AACC (2000). The percentage of nitrogen was determined with the following expression:
Nitrogen (%) = (Amount of 0.1 N H2SO4 used × 0.0014 × 250 Wt. of the sample) ×100
The percentage of protein was estimated by multiplying % nitrogen with a factor of 6.25.
Nitrogen-free extract (NFE)
NFE was calculated according to the following expression:
Microbiological analysis
Milk powder was tested for Salmonella and yeasts and molds count by the method as described by Yousef and Carlstrom[Citation21] and total bacteria count by using method.[Citation22]
Salmonella detection
1:10 dilution was prepared by dissolving 1 g of dry milk in sterile dilution blank. One milliliter of solution transferred from dilution to a Petri dish and then 10–12 mL of prepared agar was added in Petri dish. Contents were mixed without splashing media on to the cover or on the edges of petri dishes. Contents were allowed to solidify. Petri dishes were placed in inverted position in incubators at 37°C for 72 h. Parallel to that control plates were also prepared using similar medium to cheek its sterility. After incubation, colonies were identified, counted and reported as cfu/g.
Yeasts and molds count
Yeasts and molds count were enumerated according to the method of IDF (International Dairy Federation).[Citation23] One gram of dry milk powder sample was taken in a dilution bottle. Nine mL of Ringer solution was added for 1st dilution in the dilution bottle. One milliliter of the sample was added to the pre-poured plates. The sample was spread over the entire plate with a sterile bent glass rod. Plates were incubated in dark, upright at 22–25°C for 5 days. The plates were checked after 3 days to be assured they were not over growth. After incubation, colonies were identified, counted and reported as cfu/g.
Total bacteria count
Total bacteria counts were enumerated according to method of International Dairy Federation. Plates were prepared and ml of 102 and 103 dilutions of each pre-prepared test samples were transferred into well-labeled sterile petri-plates in duplicates and then overlaid with sterile warm (45°C) 15 ml of respective nutrient media. The plates were carefully swirled for uniform mixing and inoculums distribution. The mixture was allowed to solidify, then inverted and incubated aerobically at 37°C for 72 h. Parallel to that control plates were also prepared using similar medium to cheek its sterility. After incubation, plates having more than 30 and/or fewer than 300 colonies were selected and counted using colony counter. The total bacteria count (TBC) was obtained by multiplying the number of colonies with dilution factor. After incubation, colonies were identified, counted and reported as cfu/g.
Amino acid profile
Sample (i.e. 0.1 g) infant formula (of various brands) sample diluted with 1 ml water was taken and amino acid profile was determined as described by Carroll et al.[Citation24]
Minerals and heavy metals
Metals included in the current study were Pb, Cd, Fe, Zn and Ni. Heavy metals in all infant formulas were determined by wet digestion method as reported by Weldegebriel et al.[Citation25] While the limits of detection (LOD) for various elements were calculated according to the method of Ismail et al.[Citation26]
Statistical analysis
The obtained data were subjected to complete randomized design (CRD) using statistical package (Costat-2003, Co-Hort, v 6.1.). Level of significance was determined by one-factor factorial CRD following the principles outlined by Steel et al.[Citation27]
Results and discussion
Chemical analysis
Statistical results regarding moisture content in infant formula brands of different companies have been depicted in given . Results showed that moisture content was observed to be highly significant among different infant formula. Mean values regarding moisture content are shown in . It was observed that the maximum moisture content was found in SN3 (3.83 ± 1.19%) but the lowest was obtained in NN1 (1.6 ± 0.4%). The findings of the present study are identically correlated with the findings of Gasmalla et al.,[Citation28] who observed moisture content (1.96%) in infant formula milk. The findings of the present study are also in line with the finding of Olu-Owolabi et al.,[Citation29] who investigated the moisture content of NAN (1.62 g/100 g), and Lactogen (4.50 g/100 g).
Table 2. Proximate composition of different infant formulas
Mean values regarding ash content have been presented in . It was observed that ash content ranged 1.87 ± 0.21% to 4.20 ± 0.10%. The highest value for ash content was observed in SI10 (4.20 ± 0.10%) and the lowest was found in BM8 (1.87 ± 0.21%). Gasmalla et al.[Citation28] reported the similar findings regarding ash content in infant formulas.
The crude protein was highly significant among infant formula brands of different companies. It was observed that maximum crude protein was found in SI10 (14.67 ± 0.70%) followed by NC5 (14.24 ± 0.89%) and the lowest was obtained in NL2 (10.55 ± 0.5%), respectively. In accordance to the findings of Gasmalla et al.,[Citation28] the current study possessed the same results regarding protein content in infant formulas.
Mean values of crude fat are shown in . It was observed that maximum crude fat was found in NL2 (26.63 ± 0.40%) while the lowest was obtained in NC5 (9.82 ± 1.05%). In line with previously reported data, Gasmalla et al.’s[Citation28] current findings revealed similar results. The crude fiber content was missed in many collected branded samples. The highest value for crude fiber was exhibited in NI-1 (4.13 ± 0.15%) and the lowest was obtained in SI10 (2.83 ± 0.21%), whereas in NL2, PA4, NN1, MT6, AA9, MB7 and BM8 the crude fiber was not detected. Ikese et al.[Citation30] demonstrated the crude fiber content in infant formula (2.27 ± 0.57) in NC5 brand. The main objective of using dietary fiber in infant formula is to develop micro dietary fiber and prebiotics in infant formulas flora that positively influences baby health. Thus, unrefined fiber is not compulsory for the nourishment of babies under six months. So, fiber is not as a rule added to baby formula.[Citation29] The data acquired for proximate composition of different infant formulas is in agreement with the standards maintained by FAO/WHO.[Citation31]
Mean values regarding NFE are shown in . It was observed that NFE ranges 51.03 ± 1.77% to 69.17 ± 1.39%. The highest value for NFE was exhibited in NC5 (69.17%) while the lowest was estimated in SI10 (51.03%), respectively. The data of the present study is very close to the findings of Olu-Owolabi et al.,[Citation29] which estimated the CHO content in NAN, Lactogen and NAN1 was 55.59%, 73.26%, and 55.91%, respectively.[Citation32]
Microbial analysis
Infant formulas are the basic source of nutrition for the infants. It could be considered as the higher risk food owing to high susceptibility of infections in infants than adults. The occurrence of microbes in the infant formulas is depicted in . Salmonella was not detected in branded and non-branded samples. According to USDEC (U.S. Dairy Export Council)[Citation31] International standards of Salmonella, in 25 g of infant formula Salmonella should not be present, our results are similar to the international standards defined by USDEC. However, CDC (Centers for Disease Control and Prevention)[Citation33] reported the presence of Salmonella powdered milk infant formulas.
Table 3. Salmonella detection of different IF brands
Yeasts and molds count
Yeast and mold count in NN1, NL2, NI-1, PA4, NC5, MT6, MB7, BM8, AA9 and SI10 was ≤2, 3, 7, 10, ≤5, ≤8, ≤2,8 ≤ 4, and ≤3, respectively. Maximum yeast and mold count were exhibited by PA4 (10) while the lowest was observed in NN1 and MB7 (≤2). Current findings are indicated toward the poor hygienic conditions during the manufacturing of infant formulas at local level. Another study by Rajput et al.[Citation34] reported the presence of yeast and mold in infant formula. The present study revealed that excessive presence of yeast and mold in infant formulas which may pose a threat to health by producing an irritant or allergic response to human health.
Table 4. Yeasts and molds count of different IF brands
Total bacteria count
The results regarding the bacteria count are shown in . MT6 had the highest total bacteria count (6.2 × 10³ log CFU) while NI1 had the lowest total bacteria count (1.5 × 10³ log CFU). Total bacteria count was within the range of (1.5 × 10³ cfu/g) to (6.2 × 10³ cfu/g).
Table 5. Total bacteria count of different IF brands
Amino acids profile
Proteins present in human milk and infant formulas are a good source of essential and non-essential amino acids that require for growth and immunity in the early years of life. During infancy, growth rates are higher and metabolic pathways are unable to form amino acids with the speed, which actually required for the optimal growth. Results regarding the amino acids in infant formulas are shown in –3.
Figure 1. Lysine, valine, and cysteine of different IF brands
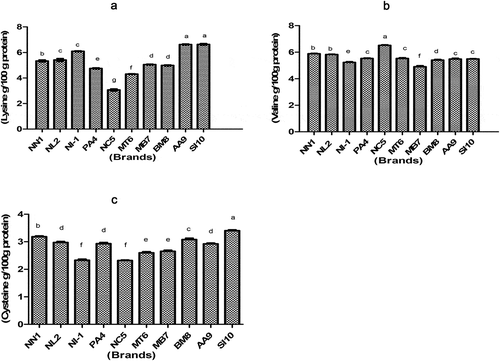
Lysine: Lysine content in infant formulas was ranged from 3.06 ± 0.08 g/100 g to 6.63 ± 0.06 g/100 g. The highest value for lysine was exhibited in SI10(6.63 ± 0.06 g/100 g) while the lowest was obtained in NC5 (3.06 ± 0.06 g/100 g). In another study Agostoni et al.[Citation35] reported that the lysine ranged from 5.7 to 27.4 µm/L in whole-powdered infant formulas.
Valine: Valine content of NN1, NL2, NI-1, PA4, NC5, MT6, MB7, BM8, AA9, and SI10 was 5.88 ± 0.03, 5.82 ± 0.03, 5.23 ± 0.05, 5.52 ± 0.04, 6.51 ± 0.04, 5.52 ± 0.06, 4.90 ± 0.08, 5.40 ± 0.05, 5.48 ± 0.06, and 5.49 ± 0.02 g/100 g, respectively. It was observed that valine was found to be in the range of 4.90 ± 0.08 g/100 g to 6.51 g/100 g, respectively. The highest value for valine was observed in NC5 (6.51 ± 0.04 g/100 g) while the lowest was found in MB7 (4.90 ± 0.08 g/100 g). Current results are in line with Viadel et al.,[Citation36] who found mean value of valine (4.79 ± 1.98 g/100 g protein) in the powder infant formula.
Cysteine: It was observed that cysteine was found to be in the range of 2.32 ± 0.04 g/100 g to 3.40 ± 0.03 g/100 g, respectively. The highest value for cysteine was exhibited in SI10 (3.40 ± 0.03 g/100 g) while the lowest was obtained in NC5 (2.32 ± 0.04 g/100 g).
Mineral content
Minerals play an essential role in growth as well as take part in vital biological processes in the body. Deficiency and excess of minerals in the body may impose adverse effects on body parts particularly in children. At the time of birth, newborn contain sufficient amounts of iron. However, demand of tissues for iron begins from 4 to 5 months of age; therefore, formulas are supplemented with iron. Iron content was found to be in the range of 5.23 ± 0.35 mg to 7.53 ± 0.15 mg. The highest value for iron content was exhibited in NC5 (7.53 ± 0.15 mg) but the lowest was obtained in NN1 and NL2 (5.23 ± 0.35 mg).
The results of the present study are closely related to the early findings of Falegan and Oluwaniyi,[Citation37] who determined the iron content (7.53 ± 0.15 mg/100 g) in NC5. Akhtar et al.[Citation38] investigated the iron content (45.40–97.10 mg/kg) in various infant formula brands. Results of current findings are in line with the standards maintained by FAO/WHO.[Citation31] Zinc plays a pivotal role in the formation of proteins and metabolism of nucleic acids. However, excess of zinc gives rise to neutropenia and competes with iron resulted in iron deficiency. In mother’s milk the concentration of zinc reduced by 20% from the initial concentration. In our study, zinc content was found to be in the range of 3.20 mg to 5.37 mg. The highest value for Zn content was observed in NN1 (5.37 mg) while the lowest was detected in NC5 and MT6 (3.20 mg). Gunbaej et al.[Citation39] demonstrated the mean value (3.83 ± 0.25) of zinc content in infant formula brands.
During the manufacturing of infant formulas Cu content is added through the trace element premix. Cu content of NN1, NL2, NI-1, PA4, NC5, MT6, MB7, BM8, AA9, and SI10 was 400.33, 400.67, 348.67, 434.33, 304.67, 324.00, 321.67, 363.33, 487.00, and 369.67 µg, respectively. The highest value for copper content was noted in AA9 (487.00 µg) while the lowest was obtained in NC5 (304.67 µg). Sadeghi et al.[Citation40] indicated that the copper concentration in infant formula milk was 4.03 ± 1.33 mg/kg as described in this study too. Gunbaej et al.[Citation39] investigated the whole infant formula and observed that copper mean value was 8.2832 ± 0.30082.
Table 6. Iron, zinc, and copper content of different IF brands
Heavy metals
Infants are more vulnerable to toxicity caused by heavy metals as the developing system of infants particularly nervous system is affected by lead.[Citation41] Heavy metals start accumulation in the vital organs. Lead and cadmium have a great contribution in behavioral impairments, cancers, and kidney dysfunctioning. Heavy metal content in different infant formulas is depicted in .
Table 7. Lead, cadmium, and aluminum of different IF brands
Table 8. Lysine, valine, and cysteine of different IF brands
Lead content was found to be in the range of 0.29–1.05 ppm. The highest value for Pb content was detected in PA4 (1.05 ppm) while the lowest was observed in SI10 (0.29 ppm) which is comparable to the results of Abdelkhalek et al.[Citation42] Lutfullah et al.[Citation43] investigated that lead content ranged from 0.01 to 0.03 ppm in infant formula of different brands. It was observed that cadmium content was found to be in the range of 0.28 to 0.98 ppm, respectively. The highest value for cadmium content was exhibited in PA4 (0.98 ppm) but the lowest was obtained in NC5 (0.28 ppm).
Abdelkhalek et al.[Citation42] detected mean value of cadmium in IF brands (0.04 mg/kg). Lutfullah et al.[Citation43] determined that cadmium content ranged from 0.04 to 1.20 ppm in infant formula of different brands. From the data, higher aluminum values were observed in NI-1 (2.05 ppm) and PA4 (2.04 ppm), respectively. The values of aluminum content in the remaining brands were highest for SI10 (2.05 ppm) and the lowest was obtained in NC5 (1.48 ppm). Ahmed et al.[Citation44] illustrated the aluminum content ranged from lower value was (0.001 mg/L), the higher value was (0.902 mg/L), and the mean value was (0.145 mg/L).
Conclusion
Infant formula of different brands was found to be a rich source of nutrients and bioactive moieties. However, it has been observed that the nutritional facts given on the labels of different formula milk are not as per their nutritional values. Most of the local infant formula mentioned the nutrional information according to the international standards but their actual values do not comply with given values. Safety assessment revealed that different brands of infant formula contained many contaminants such as heavy metals, i.e. Pb, Cd and Al, and microorganisms, i.e., yeast, molds, and bacteria. Local brands contain high amounts of heavy metals as compare to branded and the toxicological risk derived from the consumption of these brands. The results indicated that local infant formulas were more contaminated as compared to branded.
Acknowledgments
We are thankful to the Department of Food Sciences Government College University Faisalabad, Pakistan, for providing labs to conduct different experiments related to this research.
References
- Lim, S. L.; Ong, K. C.; Chan, Y. H. Malnutrition and Its Impact on Cost of Hospitalization, Length of Stay, Readmission and 3-year Mortality. Clin. Nutr. 2012, 31, 345–350. DOI: https://doi.org/10.1016/j.clnu.2011.11.001.
- Asim, M.; Nawaz, Y. Child Malnutrition in Pakistan: Evidence from Literature. Children. 2018, 5(5), 60. DOI: https://doi.org/10.3390/children5050060.
- Buldini, P. L.; Cavalli, S.; Sharma, J. L. Matrix Removal for the Ion Chromatographic Determination of Some Trace Elements in Milk. Microchem. J. 2002, 72, 277–284. DOI: https://doi.org/10.1016/S0026-265X(02)00039-5.
- Eidelman, A. I.; Schanler, R. J.; Johnston, M.; Landers, S.; Noble, L.; Szucs, K.; Viehmann, L. Breastfeeding and the Use of Human Milk. Pediatrics. 2012, 129, 827–841.
- WHO. Infant and Young Child Feeding. Model Chapter for Textbooks for Medical Students and Allied Health Professionals; WHO Press, World Health Organization: Geneva, Switzerland, 2009.
- Dewey, K. G. Nutrition, Growth and Complementary Feeding of Breastfed Infant. Pediatr. Clin. North. Am. 2001, 48(1), 87–104. DOI: https://doi.org/10.1016/S0031-3955(05)70287-X.
- WHO. Guiding Principles for Complementary Feeding of the Breastfed Child; WHO: Geneva, 2001.
- Renfrew, E.; 7% Growth for $50 Billion Global Infant Nutrition Market, 2014. Online: https://www.zenithglobal.com/news/7-growth-for-50-billion-global-infant-nutrition-market-1
- Zlotkin, S.; Siekmann, J.; Lartey, A.; Yang, Z. The Role of the Codex Alimentarius Process in Support of New Products to Enhance the Nutritional Health of Infants and Young Children. Food Nutr. Bull. 2010, 31, 128–133. DOI: https://doi.org/10.1177/15648265100312S205.
- Weistaub, G.; Uauy, R. Non-breast Milk Feeding in Developing Countries, Challenge from Microbial and Chemical Contaminants. Ann. Nutr. Metab. 2012, 60, 215–219. DOI: https://doi.org/10.1159/000338203.
- Iversen, C.; Forsythe, S. J. Isolation of Enterobacter Sakazakii and Other Enterobacteriaceae from Powdered Infant Formula Milk and Related Products. Food. Micro. Biol. 2004, 21, 771–776. DOI: https://doi.org/10.1016/j.fm.2004.01.009.
- Ingram, L. A.; Fullerton, K. E.; Marcus, R. A Case-control Study of Salmonella Infection in Infants. Food. Net. 2006, 118(6): 2380-2387.
- Jung, M. K.; Park, J. H. Prevalence and Thermal Stability of Enterobacter Sakazakii from Unprocessed Ready-to-eat Agricultural Products and Powdered Infant Formulas. Food Sci. Biotechnol. 2006, 15, 152–157.
- FAO/WHO. Evaluation of Certain Food Additives and Contaminants, Sixty-seventh Report of the Joint FAO/WHO Expert Committee on Food Additives. WHO technical report series (940); Rome, Italy, 2004; pp 45–48.
- Zand, N.; Chowdhry, B. Z.; Wray, D. S.; Pollen, F. S.; Snowden, M. J. Elemental Content of Commercial ‘Ready to-feed’ Poultry and Fish Based Infant Foods in the UK. Food Chem. 2012, 135, 2796. DOI: https://doi.org/10.1016/j.foodchem.2012.07.034.
- Ikem, A.; Nwankwoala, A.; Odueyungbo, S.; Nyavor, K.; Egiebor, N. Levels of 26 Elements in Infant Formula from USA, UK, and Nigeria by Microwave Digestion and ICPOES. Food Chem. 2002, 77, 439–447. DOI: https://doi.org/10.1016/S0308-8146(01)00378-8.
- Bermejo, P.; Pena, E.; Dominguez, R.; Bermejo, A.; Fraga, J. M.; Cocho, J. A. Speciation of Iron in Breast Milk and Infant Formulas Whey by Size Exclusion Chromatography-high Performance Liquid Chromatography and Electrothermal Atomic Absorption Spetrometry. Talanta. 2000, 50, 1211–1222. DOI: https://doi.org/10.1016/S0039-9140(99)00233-7.
- Souad, C.; Farida, Z.; Nadra, L.; FrancOis, B.; Bougle, D.; Azeddine, S. Trace Element Level in Infant Hair and Diet, and in the Local Environment of the Moroccan City of Marrakech. Sci. Total Environ. 2006, 370, 337–342. DOI: https://doi.org/10.1016/j.scitotenv.2006.06.020.
- AOAC. Official Methods of Analysis. 17th Edition, The Association of Official Analytical Chemists, Gaithersburg, MD, USA, 2000.
- AACC. Approved Methods of American Association of Cereal Chemists, 10th ed.; American Association Cereal Chemists, Inc: St. Paul, Minnesota, USA, 2000.
- Yousef, A. E.; Carlstrom, C. Food Microbiology: A Laboratory Manual; USA: John Wiley and Sons., 2003; Vol. 106, pp 48–49.
- Olutiola, P. O.; Famurewa, O.; Sonntag, H. G. An Introduction to Microbiology. A Practical Approach; Tertiary Textbook Series, 2000.
- Standard, I.D.F. Standard 117–1983: Yogurt Enumeration of Characteristic Microorganisms-Colony Count Technique at 37°C. China Dairy Ind. 1990, 4.
- Carroll, B.; Nelson, G.; Rabanal-Ruiz, Y.; Kucheryavenko, O.; Dunhill-Turner, N. A.; Chesterman, C. C.; Zahari, Q.; Zhang, T.; Conduit, S. E.; Mitchell, C. A.; et al. Persistent mTORC1 Signaling in Cell Senescence Results from Defects in Amino Acid and Growth Factor Sensing. J. Cell Biol. 2017, 216(7), 1949–1957. DOI: https://doi.org/10.1083/jcb.201610113.
- Weldegebriel, Y.; Chandravanshi, B. S.; Wondimu, T. Concentration Levels of Metals in Vegetables Grown in Soils Irrigated with River Water in Addis Ababa, Ethiopia. Ecotoxicol. Environ. Saf. 2012, 77, 57–63. DOI: https://doi.org/10.1016/j.ecoenv.2011.10.011.
- Ismail, A.; Riaz, M.; Akhtar, S.; Ismail, T.; Ahmad, Z.; Hashmi, M. S. Estimated Daily Intake and Health Risk of Heavy Metals by Consumption of Milk. Food Addit. Contam. B. 2015, 8, 260–265.
- Steel, R. G. D.; Torrie, J. H.; Dickey, D. Principles and Procedures of Statistics: A Biometrical Approach, 3rd ed.; McGraw Hill Book Co. Inc.: New York, 1997.
- Gasmalla, M. A.; Khadir, K. E.; Musa, A.; Aboshora, W.; Zhao, W. Evaluation of Some Physicochemical Parameters of Three Commercial Milk Products. Pak. J. Food Sci. 2013, 23(2), 62–65.
- Olu-Owolabi, B. I.; Fakayode, S. O.; Adebowale, K. O.; Onianwa, P. C. Proximate and Elemental Composition and Their Estimated Daily Intake in Infant Formulae from Developed and Developing Countries: A Comparative Analysis. J. Food Agr. Environ. 2007, 5, 40–44.
- Ikese, O.; Ubwa, S.; Adoga, S.; Lenka, J.; Inalegwu, J.; Ocheje, M.; Inegedu, A. Proximate Composition, Antinutrients and Some Functional Properties of a Potential Infant Food Made from Wheat and Groundnut. Int. J. Food Sci. Nutr. 2016, 1(5), 59–63.
- FAO/WHO. Codex Alimentarius: Guidelines on Formulated Supplementary Foods for Older Infants and Young Children, 1991; Vol. 4, pp 144. WHO Joint Publications, USA.
- Onweluzo, J. C.; Nwabugwu, C. C. Development and Evaluation of Weaning Foods from Pigeon Pea and Millet. Pak. J. Nutr. 2009, 8(6), 725–730. DOI: https://doi.org/10.3923/pjn.2009.725.730.
- CDC (Centers for Disease Control and Prevention). Salmonella Tennessee in Powdered Milk Products and Infant Formula - Canada and the United States. Mortal. Wkly. Rep. 2003, 42, 516–517.
- Rajput, I. R.; Khaskheli, M.; Rao, S.; Fazlani, S. A.; Shah, Q. A.; Khaskheli, G. B. Microbial Quality of Formulated Infant Milk Powders. Pak. J. Nutr. 2009, 8(10), 1665–1670. DOI: https://doi.org/10.3923/pjn.2009.1665.1670.
- Agostoni, C.; Carratu, B.; Boniglia, C.; Riva, E.; Sanzini, E. Free Amino Acid Content in Standard Infant Formulas: Comparison with Human Milk. J. Am. College. Nutr. 2000, 19(4), 434–438. DOI: https://doi.org/10.1080/07315724.2000.10718943.
- Viadel, A.; Alegriá, R.; Farré, P.; Abellán, F.; Romero, B. Amino Acid Profile of Milk-based Infant Formulas. Int. J. Food Sci. Nutr. 2000, 51(5), 367–372. DOI: https://doi.org/10.1080/096374800426957.
- Falegan, C. R.; Oluwaniyi, T. T. Microbial Composition, Antibiotic Sensitivity and Proximate Composition of Popular Imported Powdered Infant Milk Formulas Sold in Ado Ekiti, Nigeria. Inter. J. Micro. Genet. Mono. Biol. Res. 2015, 1(1), 10–24.
- Akhtar, S.; Shahzad, M. A.; Yoo, S. H.; Ismail, A.; Hameed, A.; Ismail, T.; Riaz, M. Determination of Aflatoxin M1 and Heavy Metals in Infant Formula Milk Brands Available in Pakistani Markets. Korean. J. Food Sci. Anim. Resour. 2017, 37(1), 79. DOI: https://doi.org/10.5851/kosfa.2017.37.1.79.
- Gunbaej, E. E. M.; Abd-Elghany, S. M.; Almrhag, O. M. Copper, Zinc and Iron Residues in Milk Powder and Infant Formulas Sold in Libyan and Egyptian Markets. 1st food security and safety conference, 2016. Misrata, Libya.
- Sadeghi, N.; Behzad, M.; Homay Razavi, S.; Jannat, B.; Oveisi, M. R.; Hajimahmoodi, M. Measurement of Zinc, Copper, Lead, and Cadmium in the Variety of Packaging Milk and Raw Milk in Tehran Markets by Anodic Striping Voltammetry. J. Chem. Health Risks. 2020, 10(3), 175–183.
- Mason, L. H.; Harp, J. P.; Han, D. Y. Pb Neurotoxicity: Neuropsychological Effects of Lead Toxicity. Biomed Res. Int. 2014, 2014, 1–8. DOI: https://doi.org/10.1155/2014/840547.
- Abdelkhalek, A.; Elsherbini, M.; Gunbaej, E. E. Assessment of Heavy Metals Residues in Milk Powder and Infant Milk Formula Sold in Mansoura City. Egypt. Alexan. J. Vet. Sci. 2015, 47(1), 71–77.
- Lutfullah, G.; Khan, A. A.; Amjad, A. Y.; Perveen, S. Comparative Study of Heavy Metals in Dried and Fluid Milk in Peshawar by Atomic Absorption Spectrophotometry. Sci. World. J. 2014, 5, 1-5.
- Ahmed, A. A. H.; Mohammed, E. E. P.; Amin, M. M.; Abdel-Raheem, D. A. N. Aluminum Level in Infants’ Powdered Milk Based Formulae. J. Adv. Vet. Res. 2016, 6(4), 104–107.