
 ?Mathematical formulae have been encoded as MathML and are displayed in this HTML version using MathJax in order to improve their display. Uncheck the box to turn MathJax off. This feature requires Javascript. Click on a formula to zoom.
ABSTRACT
Vitamin C degradation of broccoli at different moisture and temperature was measured as a function of storage time and modeled by first-order reaction kinetics. The variation of rate constant was analyzed based on the activation energy, glass transition, BET-monolayer, micro-region state diagram, and empirical correlations. Three domains of chemical reactions were observed as a function of temperature. In the case of broccoli with freezable water (i.e. moist), the first critical temperature (i.e. Tc) was observed at −20°C (Tc/Tg′′′: 0.829), which was close to the Tg′′′ (i.e. experimental ultimate maximal-freeze-concentration glass transition) (−32.2°C); while second critical temperature (i.e. Ts) was observed at 60.0°C (i.e. Ts/Tg′′′: 1.383). The activation energy values were 13.6, 75.0, and 43.6 kJ/mole for the phase 1 (moist-glassy), phase 2 (moist-glassy-rubbery) and phase 3 (moist-rubbery-flow), respectively. In the case of frozen-broccoli with un-freezable water, the first critical temperature (i.e. Tc) was observed at 5°C (Tc/Tgi: 1.021), which was close to the Tgi (onset glass transition) (−0.8°C); while the second critical temperature (i.e. Ts) was observed at 70.0°C (i.e. Ts/Tgi: 1.260). The second critical temperature was close to the mechanical glass transition temperature. The activation energy values were 13.1, 69.6, and 72.4 kJ/mole for phase 1, phase 2 and phase 3, respectively. Each experimental rate constant was located in the micro-regions of the state diagram. Principal component analysis showed that reaction rates can be grouped into different micro-regions, except one data point in the micro-region 12. This could be due to the wider domain of this region and further sub-micro-regions could be defined. Finally, empirical correlations were developed as dimensionless moisture, temperature, and rate constant, and explored the possibility of developing a generic universal equation.
Introduction
In food science, the concept of water activity was first pointed out by Scott[Citation1] and the concept of glass transition was first highlighted by White and Cakebread.[Citation2] The significant applications of the glass transition concept, in the 1980s, emerged when Levine and Slade[Citation3] and Slade and Levine[Citation4] identified its major merits in determining food stability. Water activity is a solvent property and glass transition is a structural property, and they are strongly dependent on water content, thus related.[Citation5] Therefore, both water activity and glass transition are needed for a better understanding of the complexity of food stability.[Citation6] Later, this was also supported by Chirife and Buera.[Citation7] It was emphasized that a combination of these two concepts could be a powerful tool and could lead to an in-depth knowledge in determining food stability.[Citation8]
Karel et al.[Citation9] related water activity and glass transition by plotting equilibrium water content (y-axis 1) and glass transition (y-axis 2) as a function of water activity. Sablani et al.[Citation10] investigated the stability criteria of different foods considering the concepts of water activity and glass transition concepts to explore their connections. They observed a considerable discrepancy in the critical limits of temperature and moisture for stability when these two concepts were used separately. Such plots just show the relationships of water activity and glass transition, but do not provide any information on the combined effects of food stability. Levine and Slade[Citation3] proposed the food stability by developing a state diagram (i.e. boundaries of different phases or states) using a glass line, freezing curve, and intersection of these lines. This stability map showed four macro-regions for determining food stability.[Citation3] Initially, Rahman[Citation8] combined the two concepts (i.e. water activity and glass transition) in the state diagram by plotting the BET-monolayer as a function of temperature.[Citation8] Later, Rahman[Citation11] hypothesized 13 micro-regions with the highest (i.e. micro-region 1, below glass and BET-monolayer lines) to the lowest stability (i.e. micro-region 13, above freezing curve) based on their locations relative to glass and BET-monolayer lines. Complete details of the micro-region concept are reviewed by Rahman.[Citation12,Citation13] Rahman and Al-Saidi[Citation14] tested the validity of the micro-region concept by measuring browning in the micro-regions 1, 2, 4, 7, 8, 10, 11, and 12 considering raw and freeze-dried bananas. They also observed that the reaction increased (i.e. stability decreased) as the number of micro-region increased. Zhang et al.[Citation15] used the vitamin C stability data of Zhang et al.[Citation16] in the frozen mango stored as a function of storage temperature (0 to −65°C, i.e. micro-regions: 3, 4, 5, 6, and 9) and observed the validity of the micro-region hypothesis. These evidences indicated the initial validity of the proposed hypothesis. However, further works need to be targeted to test this micro-region hypothesis. Foods could be transformed into glassy state by two ways: one by reducing moisture and transforming to glassy state (i.e. dry-glass); and another is by cooling to a lower temperature at a constant moisture (i.e. temperature-glass). McKenna[Citation17] compared the temperature-glass and dry-glass of polymeric materials by enthalpy relaxation. To date, minimal research is reported comparing the characteristics of dry-glass and temperature-glass for foods.
In a plot of rate constant versus T/Tg, a change in the slope of rate constant is expected at T/Tg equal to 1, if the concept of glass transition is valid. Similarly, a change in slope is also expected at Xw/Xb is equal to 1, when rate constant is plotted as a function of Xw/Xb, if the concept of water activity is valid. Attempts were made to determine the critical limits (i.e. critical temperature and moisture content) based on these plots. In the case of bananas containing un-freezable moisture, the critical temperature was observed above 33.3°C of the glass transition temperature. However, in the case of banana containing freezable water, the critical temperature was at the ultimate maximal-freeze-concentration glass transition (i.e. Tg′′′). After compiling literature data, Rahman[Citation12] observed that the values of Tc/Tg varied from 0.78 to 1.5 depending on the types of reactions and the matrices.
Stability (i.e. reaction rate constant) of foods are also empirically related to the glass transition and BET-monolayer values. Rahman and Al-Saidi[Citation14] measured browning of bananas as a function of water content and storage temperature. They plotted rate constants as a function of Xw/Xb and T/Tg or T/Tg′′′ and developed an empirical correlation based on these dimensionless functions.
Vitamin C degradation was analyzed by first-order reaction kinetics for cherry juice within temperature of 75–95°C.[Citation18] Phillips et al.[Citation19] studied the loss of vitamin C in different processed products: (i) homogenized (i.e., under liquid nitrogen homogenization and stored under residual nitrogen) raw broccoli, potatoes, spinach, strawberries, oranges, and tomatoes, (ii) baked potatoes; (iii) steamed broccoli and spinach; and (iv) pasteurized orange juice stored for 1, 3, and 7 days in refrigerator (i.e. 4°C), and freezer (−17°C) and in ultra-low freezer (−68°C). The highest loss was observed in the case of raw spinach and broccoli (i.e. 94% and 68%, respectively, after 7 days), under refrigeration conditions. In the case of cantaloupe, collard greens, and raw potato, long-term storage at ultra-low temperature showed a decrease within 0.96 year and then remained nearly constant, while in the other cases, stability remained the same until 4.1 years. In the case of fresh cherry and romaine storage at 0.7 ± 0.6, 3.5 ± 2.8 and 4.7 ± 1.4°C during 7 days storage, it was observed that vitamin C decreased the least at the storage temperature 3.5 ± 2.8°C (i.e. higher fluctuation of in storage temperature).[Citation20] Valsikova et al.[Citation21] studied the storage stability of vitamin C in the cases of dried (1 month) and frozen (3 months) celery and parsley. They observed a decrease of 35.6% and 38.9% in the cases of dried celery and parsley, compared to a decrease of 14.5% and 17.9% in the case of frozen celery and parsley, respectively. Masamba and Mndalira[Citation22] studied the vitamin C stability in pineapple, guava, and baobab juices stored at room (22.4°C), chilling (−1.2°C) and freezing (−17.3°C) temperatures with and without 0.05% sodium benzoate and 0.005% sodium metabisulfite. They observed that vitamin C stability in the three types of juices was influenced by storage temperature, and storage time, and levels and types of preservatives used. Vitamin C was found to be more stable in frozen storage conditions with the combined use of preservatives.
The degradation of vitamin C is commonly modeled by first-order reaction kinetics. Munyaka et al.[Citation23] studied the ascorbic acid oxidase degradation of broccoli with first-order kinetics within the temperature 55–65°C. Degradation rate constants have been reported at different temperatures in a number of foods: cherry juice at 75°C and 95°C, [Citation18] orange juice at 10°C, [Citation24] fresh marula, guava, and mango pulp at 100°C, [Citation25] and pumpkin leaves 60–90°C.[Citation26] Herbig and Renard[Citation27] studied the kinetics of vitamin C stability at 40–60°C and 60–80°C, and pH values 3.5, 5.5, and 7.5. To date, limited studies have been presented on the rate constant data of vitamin C within a wide range of moisture (i.e. moist with freezable water and dried with un-freezable water) and temperature (i.e. −80 to 120°C).
Therefore, the main objective of this study was to determine the stability of a nutrient as a function of moisture (i.e. low and high moisture) and temperature (i.e. −80 to 120°C) considering broccoli as a reaction matrix and vitamin C as a reactant. Two sets of experiments were designed so that a comparison between dry-glass and temperature-glass could be compared. The degradation of vitamin C was analyzed by first-order reaction kinetics, and rate constant was analyzed by Arrhenius equation. The stability was further analyzed based on the micro-region concept in the state diagram as well as by developing empirical correlations of dimensionless rate constant as a function of dimensionless moisture content and storage temperature. The dimensionless moisture was developed based on the BET-monolayer and dimensionless temperature based on a reference glass transition (i.e. Tgi or Tg′′′) at each moisture content. In addition, a possibility of developing generic universal correlation was explored.
Materials and methods
Experimental procedure
Fresh broccoli (Brassica oleracea, variety: Calabrese) grown in Oman was purchased from local supermarket and stored at refrigeration temperature (4°C). Florets were cut from the bunch and frozen at −40°C for 18 h. Then, Edwards K4 Freeze Dryer (Corawky, Crawley, England) freeze dryer was used to freeze-dry the frozen florets. Drying was carried out at 20°C (i.e. from −40°C and ended to 20°C, starting from surface to the center), under 200 Pa vacuum for 4 days. Freeze-dried florets were then ground into powder using a KMF grinder (KIKA Werke, Wilmington, USA).
Dynamic mechanical thermal analysis (DMTA)
Dynamic mechanical thermalanalysis was carried out using Dynamic Mechanical Thermal Analyzer (DMTA) (Discovery Hybrid Rheometer, HR1, TA Instruments, US). Broccoli tablets were produced by compressing broccoli powder (≈0.6 g) in a manual hydraulic press (Atlas Manual Hydraulic Press, GS25011, Specac, UK) with a 10 tons force for 5 min. The diameter and height of the tablets were around 14 mm and 4.25 mm, respectively. Frequency sweep at a 0.25% compression with a frequency range of 0.1–100 Hz was carried out to determine the linear viscoelastic region. The storage modulus (G′), loss modulus (G″), and tan δ were determined from the temperature ramp. Broccoli tablet was first cooled to −50°C at a 5°C/min and held for 5 min. It was then heated at a rate of 5°C/min from −30 to 150°C at a frequency of 0.1 Hz. A shift (i.e. sharp shift) in G′and G′′was considered as the characteristic glass transition of freeze-dried broccoli.
Micro-regions state diagram
The state diagram of broccoli developed earlier by measuring the moisture adsorption isotherm and thermal analysis by Differential Scanning Calorimetry[Citation28] was used in this study. It included freezing curve, glass transition line, solids-melting line, maximal-freeze-concentration condition and BET-monolayer line. Suresh et al.[Citation28] did not include BET-monolayer line in the state diagram; however, they had presented the BET-monolayer data as a function of temperature. In the current paper, their data on BET-monolayer was used to develop the current state diagram. In addition, a reference point was determined from the intersection of the glass line and BET-monolayer line as proposed by Rahman and Al-Saidi.[Citation14] The micro-regions state diagram (i.e. 13 micro-regions) developed by Rahman[Citation11] was used in this study to determine the stability of vitamin C in broccoli. The stability kinetics was measured in the selected micro-regions as proposed by Rahman.[Citation11] The validity of the grouping of rate constants within the micro-region was evaluated by applying Principal Component Analysis (PCA). All factors or variables were standardized to bring all variables in the similar scale range, and the equation used for the standardization is written as
where y is the standardized data for variable or factor, x is the measured variable or factor, xa is the average value measured across the different variables or factors, σ is the standard deviation of the data for variable x. In addition, the glass transition of freeze-dried broccoli was measured by DMTA to determine the mechanical glass transition in addition to thermal glass transition so that the relationships of mechanical glass with reaction can be explored.
Chemical reaction kinetics
The kinetics data for fresh broccoli samples stored at 20°C, 45°C, 60°C, 70°C, 80°C, 110, and 120°C from Al-Habsi et al.[Citation29] were used in the current study. In their experiments, samples (around 200 g) were placed in glass beakers placed in air-tight aluminum cells and stored at different temperatures 5°C, 20°C, 45°C, 60°C, 70°C, 80°C, 110°C, and 120°C. A sample of 4 g was taken from each aluminum cell at different storage time and analyzed for vitamin C.
In this study, 10 g of fresh broccoli florets in small glass bottles with caps were placed in aluminum cells and these were stored at −80°C, −60°C, −40°C, −20°C, respectively. At different time intervals (i.e. depending the storage temperature), each bottle was taken out for the vitamin C analysis. Each sample was placed separately in small bottles to avoid the sticking of all samples in the aluminum jars stored at low temperature and to avoid the thawing and re-freezing process of all samples at a time. The same procedures were applied for freeze-dried powdered stored at all temperatures as mentioned earlier. However, 2 g sample was used to determine the vitamin C analysis for the freeze-dried powder. The vitamin C concentration was measured by titration method as described in Al-Habsi et al.[Citation29] according to the AOAC method.[Citation30] The vitamin C concentration is expressed as mg/100 g broccoli.
The degradation of vitamin C is commonly modeled by the first-order reaction kinetics and it is expressed as[Citation29]
where, Co and C are the vitamin C concentration (mg/100 g sample) at the beginning of storage and at different intervals of storage, respectively; t is the storage time (s), a is the intercept, and k is the first order rate constant (s−1). The rate constant was determined from the slope of a linear plot ln (C/Co) versus t by excluding the initial lag period to reach isothermal temperature.[Citation29] Activation energy of first-order kinetics was estimated using the Arrhenius equation as
where R is the universal gas constant (8.314 J/mole K), Ea is the activation energy (J/mole), T is the temperature (K), and b is the pre-exponent factor. The activation energy was estimated from the slope of the linear plot of ln k versus 1/T.
Empirical approach to combine water activity and glass transition concepts
Empirical correlations of rate constant were developed as a function of dimensionless moisture (i.e. Xw/Xb) and temperature (T/Tx) as proposed by Rahman and Al-Saidi.[Citation14] They optimized the functional forms of the variables. In addition, a more generic form of dimensionless rate constant was defined by dividing rate constant by another reference rate constant. The reference rate constant (kr) was determined for each moisture content at its glass transition (i.e. Tgi for dry-glass with no freezable water or Tg′′′ for moist-glass with freezable water).
Statistical analysis
The rate constant and activation energy were determined using a regression procedure in MS-Excel.[Citation31] PCA was performed using PAST software.[Citation32] The non-linear regression was developed using NLREG software.[Citation33]
Results and discussion
Mechanical glass transition
In order to explore the relationship of vitamin C stability with the mechanical glass transition, DMTA analysis was measured. shows the DMTA frequency sweep to determine the frequency dependence of the linear viscoelastic region. Considering the viscoelastic region, a frequency of 0.1 Hz was used for the temperature ramp from −30°C to 150°C. shows the changes in storage modulus (G′) and loss modulus (G′′) as a function of temperature. The sharp change in G′ and G′′ at 61.4°C indicated the onset of mechanical glass transition and below this temperature sample was at glassy state. A relatively sharper decrease was observed at 137.8°C without any horizontal change of the modulus (). Onset of the DSC glass transition of freeze-dried broccoli at the same moisture (i.e. 6.7 g/100 g sample) was observed earlier at −0.8°C .[Citation28] The rheological glass transition has been commonly reported to be higher than the thermal glass transition.[Citation34,Citation35]
Figure 1. A typical graph of DMTA frequency sweep of freeze-dried broccoli powder at 0.25% compression
Figure 2. Storage and loss modulus of freeze-dried broccoli powder as a function of DMTA temperature ramp (frequency: 0.1 Hz, temperature: −30°C to 150°C and heating rate: 5°C/min)
Reaction kinetics
The initial vitamin C contents of fresh and freeze-dried broccoli were varied from 70.3 to 75.5 and 416.7–642.8 mg/100 g sample, respectively. shows typical graphs of vitamin C degradation and plots of first-order kinetics of freeze-dried samples at −80°C ( and b) and 60°C ( and d). The initial increase of vitamin C in could be due to the release of bound vitamin C. As reported earlier by Al-Habsi et al.,[Citation29] degradation of vitamin C was followed as a first-order reaction. shows the rate constant of vitamin C degradation as a function of moisture content and storage temperatures. The regression coefficients at −40°C and lower temperature showed low regression coefficient as compared to the higher temperature (). The data of were also fitted to the zero- and second-order reaction kinetics and the regression coefficients were observed as 0.729 and 0.741, respectively. These values were close to the regression coefficient of 0.699 of first-order reaction kinetics. Therefore, all temperatures were considered as first-order reaction. The rate constant increased with the increasing storage temperature and moisture content. The rate constants of fresh broccoli (i.e. moist) varied from 1.110 × 10⁻⁸ to 5.650 × 10⁻³ (−80°C to 120°C), respectively. Phillips et al.[Citation36] measured the degradation kinetics of vitamin C in collard bean and potato after being homogenized in liquid nitrogen and stored at −60°C in a glass bottle. They observed rate constants as 5.311 × 10⁻¹¹ and 2.328 × 10⁻¹⁰ s−1, respectively. These data are much lower values than those observed in the current study. Such differences could be due to a low level of residual oxygen,[Citation37] difference in pH,[Citation38] and forms of vitamin C[Citation39] in the products. Nath et al.[Citation40] studied the vitamin C degradation of fresh broccoli at 15°C and 4°C during 6 days of storage in micro-perforated film bags. They reported higher degradation rate in the samples stored at 15°C as compared to those at 4°C. In the case of cherry juice, it was observed as 3.117 × 10⁻⁴ to 1.017 × 10⁻³ s−1 at 75°C and 95°C, respectively .[Citation18] The degradation rate constant of vitamin C in orange juice stored at 10°C was observed as 4.63 × 10⁻⁷ s−1, [Citation24] which is similar to the value (i.e. 5.030 × 10⁻⁷ s−1 at 5°C) observed in the current study. At 100°C, the initial rate constants of fresh marula, guava, and mango pulp were observed as 1.2 × 10⁻⁴, 2.0 × 10⁻³, and 2.2 × 10⁻³ s−1, respectively.[Citation25] The variations of the stability could be due to the presence of protective components in the food matrix. For example, a protective role of anthocyanin on ascorbic acid stability was observed in lemon–berry blends.[Citation41] Ariahu et al.[Citation26] studied the degradation kinetics of vitamin C for pumpkin leaves from 60°C to 90°C while varying pH from 5.0 to 6.5. At pH 5.5, the rate constants were 3.72 × 10⁻⁴ and 1.15 × 10⁻³ s−1 for 60°C and 90°C, respectively. However, the rate constants increased at pH 6.5 to 8.10 × 10⁻⁴ and 8.19 × 10⁻² s−1 for 60°C and 90°C, respectively. In guava, the rate constants of vitamin C degradation changed from as 1.33 × 10⁻² and 1.15 × 10⁻² s−1 with heating at 75°C and 95°C, respectively.[Citation42]
Table 1. Rate constant for vitamin C degradation as a function of temperature and moisture content
Figure 3. Typical graphs showing (a) The change in vitamin C concentration over time in Freeze-dried sample stored at −80°C, (b) Plot of ln (C/Co) versus time for freeze-dried sample stored at −80°C, (c) The change in vitamin C concentration over time in fresh sample stored at 60°C, and (d): Plot of ln (C/Co) versus time for fresh sample
In the case of fresh broccoli, rate constant was plotted as a function of temperature (). The figure shows three domains: Phase 1 (moist-glassy), Phase 2 (moist-glassy-rubbery) and Phase 3 (moist-flow). The first critical temperature (Tc) between Phase 1 and Phase 2 was at −20°C, while ultimate maximal-freeze-concentration glass transition (Tg′′′) was at −32.2°C (i.e. Tm′ at −30.0°C, Tc/Tg′′′: 0.829). The second critical temperature (Ts) between Phase 2 (moist-glassy-rubbery) and Phase 3 (moist-flow) was observed at 60°C (i.e. Ts/Tg′′′: 1.383). The values of Tc/Tg varied from 0.78 to 1.5 depending on the types of reactions and the matrices.[Citation12] shows the Arrhenius plot for the fresh broccoli and activation energy values estimated for the three phases were 13.6, 75.0 and 43.6 kJ/mole, respectively (). The decrease of activation energy at higher temperature (i.e. in the Phase 3) could be due to the release of other antioxidants or protective compounds. The activation energy of the thermal degradation of vitamin C in cherry juice (soluble solids: 16.1%, pH: 5.89, temperature: 75–95°C) was observed as 69.4 kJ/mole.[Citation18] The activation energy values of the initial degradation of vitamin C (80–150°C) in marula, guava, and mango pulp were 29, 58, and 39 kJ/mole, respectively.[Citation25] The activation energy values decreased from 41.2 to 18.2 kJ/mole within 60–90°C for fresh pumpkin leaves.[Citation26] It was also shown to be 88.91 kJ/mole within 80–90°C for apple[Citation43] and 31.67 kJ/mole for guava within 75–95°C.[Citation42] Therefore, the activation energy (i.e. 75.0–43.6 kJ/mole) of fresh broccoli at medium to high temperature (i.e. −20°C to 120°C) as observed in the current study was similar to the reported literature values.
Table 2. The activation energy of the three temperature regions
Figure 4. (a) Plot of log k as a function of temperature for the fresh sample, (b) Arrhenius plot for the fresh sample, (c) Plot of log k as a function of temperature for the freeze-dried sample, (d) Arrhenius plot for the freeze-dried sample
The rate constants of freeze-dried broccoli ranged from 1.748 × 10⁻⁹ to 1.021 × 10⁻⁴ s−1 (−80°C to 120°C), respectively (). Zwart et al.[Citation44] observed that degradation rate constant of vitamin C in freeze-dried broccoli at 25°C as 2.382 × 10⁻⁹ s−1, while it was lower (i.e. 6.976 × 10⁻⁸ s−1) at 20°C in the current study. Sablani et al.[Citation10] measured the stability of vitamin C of commercial dried formulated foods at 20°C with varied moisture from 0.046 to 0.162 g/g sample and observed the rate constant as 3.056 × 10⁻⁶ and 1.356 × 10⁻⁵ s−1, respectively. This indicated that vitamin C in broccoli was more stable than in formulated food products.
Similar to fresh broccoli, three domains of reaction were observed in the case of freeze-dried broccoli. For the sample with un-freezable water (), slope changed at critical temperatures of 5°C (i.e. first critical temperature, Tc) and 70.0°C (i.e. second critical temperature, Ts) (i.e. Tc/Tgi: 1.021 and Ts/Tgi: 1.260). Interestingly, the first critical temperature was close to the onset thermal glass transition (i.e. −0.8°C) and the second critical temperature was close to the mechanical glass transition (i.e. 61.4°C). The first critical temperature was related to the molecular relaxation (i.e. thermal glass transition) and second critical temperature was related to the matrix relaxation (i.e. mechanical glass transition).[Citation8] Therefore, both thermal and mechanical glass transition played a role in determining different critical temperatures for the degradation of vitamin C in broccoli. The activation energy of the Phase 1 (i.e. dry-glassy), Phase 2 (i.e. dry-glassy-rubbery), and Phase 3 (i.e. dry-softening) were 13.1, 69.6, and 72.4 kJ/mole, respectively (, ). It is interesting to see that activation energy of Phase 1 (i.e. glassy state) for both moist and dried glass shows similar activation energy (i.e. 13.6 kJ/mole versus 13.1 kJ/mole). This indicated that the reaction activation energy remained similar as long as the moist and dry materials were in the glassy state. However, Phase 3 (i.e. higher temperature) of moist-flow showed opposite as compared to Phase 3 of dry-soften sample.
Dry-glass (or concentration-glass) showed more stability (i.e. lower rate constants) than temperature-glass (). For example, the rate constant for temperature-glass was 4.410 × 10⁻⁸ s−1 at −40°C, while dry-glass was 2.567 × 10⁻⁹ s−1. This indicated that dry-glass is more stable than temperature-glass (i.e. one order of difference). McKenna[Citation17] compared the temperature-glass and the dry-glass, and they observed that dry-glass was more stable than temperature-glass. Dry-glass showed a higher excess volume than the temperature-glass, and both responses did not merge at any point; hence, the dry-glass was not the same as a temperature-quenched glass. Similarly, in the case of broccoli, at all specific temperatures, the rate constants were one order lower in the case of dry-glass as compared to temperature-glass.
State diagram
shows the state diagram of broccoli with 13 micro-regions (data source[Citation28]). Explaining the thermal maximal-freeze-concentration conditions is complex and different researchers used it in different locations.[Citation45,Citation46] Thus, each temperature was defined clearly with the complete explanation for clarity and these were used in deterring vitamin C stability. In the graph (), abc is the freezing curve, egf is the glass transition line, irh is the BET-monolayer, and kj is the solids melting-decomposition line as measured by DSC endothermic peak at higher temperature.
Figure 5. State diagram of broccoli (abc: freezing curve, egf glass transition line, irh: BET-monolayer, kj: solids melting-decomposition line, u: Tm′, experimental ultimate maximal-freeze-concentration melting temperature, v: Tg′′′, experimental ultimate maximal-freeze-concentration glass transition temperature, b: Xs′, conceptual maximal-freeze-concentration solids, d: Tg′, conceptual maximal-freeze-concentration glass transition temperature, m: Xs′′′, conceptual maximal-freeze-concentration solids, g: Tg′′, hypothetical maximal-freeze-concentration glass transition temperature, and 1–13: indicates the micro-regions 1–13)
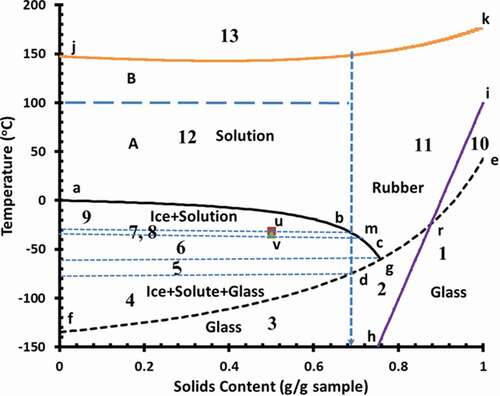
The experimental maximal-freeze-concentration temperatures are as follows: ultimate maximal-freeze-concentration melting temperature, Tm′ (i.e. point u, when maximal frozen water is formed) and ultimate maximal-freeze-concentration glass transition temperature, Tg′′′ (i.e. point v, glass transition before ice melting). These temperatures are measured experimentally using DSC with a defined protocol.[Citation47,Citation48] The experimental maximal-freeze-concentration solids (Xs′′′, point m) are determined from the horizontal line passing through Tg′′′ and intersecting the extended freezing curve by maintaining similar curvature of the freezing curve. The conceptual maximal-freeze-concentration solids (Xs′) was determined as point b, horizontal line passing through Tm′ and intersecting the extended freezing curve by maintaining similar curvature of the freezing curve. The conceptual maximal-freeze-concentration glass transition temperature is Tg′ (i.e. point d, vertical line crossing through Tm′ to dry glass line, egf). These points are conceptualized from the state diagram. Other hypothetical maximal-freeze-concentration temperature Tg′′ is defined as the hypothetical maximal-freeze-concentration glass transition temperature (i.e. point g, intersection of the freezing curve to the solids glass transition line, egd and solids at this point is considered as Xs′′). The numerical numbers indicate different micro-regions in the state diagram.
Principal component analysis (PCA) for micro-region grouping
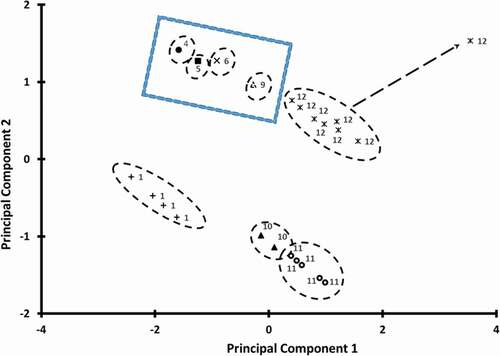
PCA was performed to determine whether reaction rates could be grouped based on the micro-regions of the state diagram. The variance explained by the PC1, PC2, and PC3 are 50.1%, 28.0%, and 19.7%. shows the bi-plot of the PCA considering vitamin C degradation rate constant, moisture content, storage temperature, and micro-regions of the state diagram. It showed that all data could be grouped into micro-regions of the state diagram except one point in the micro-region 12. This point was 120°C of the fresh broccoli. This could be due to the wider area (i.e. wide temperature and moisture) of the micro-region 12 () and this micro-region could be further divided into two (i.e. micro-regions 12A and 12B based on the boiling or evaporation point of water in the broccoli (i.e. broccoli containing freezable water) as shown in . In addition, micro-regions 4, 5, 6, 9 are the closest neighbors as also postulated in the micro-region state diagram (). Similarly, micro-regions 1, 10, and 11 are also closest neighbors (). Zhang et al.[Citation15] also tested the concept of micro-region by measuring vitamin C stability in micro-regions 3, 4, 5, 6, and 9. They observed that stability decreased as the micro-region numbers increased, thus supporting the micro-region hypothesis. However, in the micro-region 9, fluctuating storage temperature had more effects than the effect of storage temperature as compared to the other tested micro-regions.
Figure 6. Bi-plot of the PCA showing different cluster of micro-regions
Empirical correlations
In order to combine reaction kinetics, the rate constant was empirically correlated as a function of Xw/Xb and T/Tx as proposed by Rahman and Al-Saidi.[Citation14] A highly significant correlation (P <0 .00001) with good regression coefficient (r2 = 0.951).
where Tx is the Tgi for dry-glass (i.e. containing un-freezable water) and Tg′′′ for moist-glass (i.e. containing freezable water), respectively. In the case of sucrose hydrolysis, Tombari et al.[Citation49] observed linear relationships between ln k as function of T or 1/T from thermodynamic point. Davey[Citation50] combined the effect of temperature and water activity on the growth rate of bacteria with a multiple regression between ln k as a function of 1/T, 1/T2, aw and aw2. Similarly, the browning reaction rate constant data[Citation14] of banana as a function of dimensionless moisture and temperature was correlated as
The regression coefficient was 0.598 and P < 0.00001. In order to make more generic correlation, reaction rate constants of vitamin C degradation broccoli at each moisture content and temperature was transformed to dimensionless as k/kr. The reference rate constant, kr (s−1) at the glass transition for each experimental moisture. In the case of dry sample, the reference rate constant was considered at its glass transition temperature (i.e. Tgi); and for the moist sample, it was considered as the experimental ultimate maximal-freeze-concentration glass transition (i.e. Tg′′′). In order to determine the effects of moisture and temperature individually, ln (k/kr) was linearly correlated with Xw/Xb and T/Tx separately. In the case of Xw/Xb, correlation coefficient was observed as 0.494 with P < 0.0001, while correlation coefficient was observed as 0.200 with P < 0.05 for T/Tx. Therefore, multiple linear correlation was developed as a function of Xw/Xb and T/Tx as
The correlation coefficient was 0.951 and P < 0.00001. The improvement of the regression coefficient and P-value as compared to the 0.494 and P < 0.0001 or 0.200 and P < 0.05 indicated that both functions are important to predict the reaction rate constant. The browning reaction data of banana as published earlier by Rahman and Al-Saidi[Citation14] was also used to develop similar correlation as
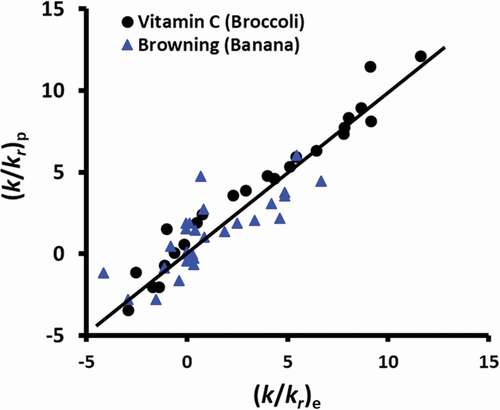
The correlation coefficient was 0.675 and P < 0.00001. The major deviations were in the coefficient of the dimensionless moisture contents (i.e. 0.0123 for vitamin C in broccoli and 0.3628 for browning in banana). The variations of the coefficient were due to the types of reaction (vitamin C and browning), and the matrix of the reactions (i.e. broccoli and ripe banana). However, temperature showed similar effects in the case of vitamin C degradation and browning. shows the plot of the predicted and experimental dimensionless rate constant and best line for the prediction. This position of the data points close to the best prediction line for over the entire range indicates the validity of the predictions. This indicates that this approach could be used to develop universal generic correlation to predict the reaction as a function of dimensionless rate constant, moisture, and temperature. Further studies are needed to be performed to develop a generic form of food stability model equation.
Figure 7. (k/kr)p predicted from EquationEquations 3(3)
(3) and Equation4
(4)
(4) as a function of (k/kr)e and best prediction line
Conclusion
In this study, stability of a vitamin in a model food was studied considering reactant as vitamin C and reaction matrix as fresh and freeze-dried dried broccoli. The reaction rate was modeled by first-order reaction kinetics and it was observed that both moisture and temperature need to be considered for the prediction of vitamin C degradation. The dimensionless rate constants were correlated as a function of dimensionless moisture and storage temperature. In the case of fresh broccoli, the activation energy of the three phases were 13.6, 75.0, and 43.6 kJ/mole, respectively, for moist-glassy, moist-glassy-rubbery, and moist-rubbery-flow. The lower activation energy at higher temperature indicated that release of other interfering components, thus reduced the reaction rate. Similarly, in the case of freeze-dried broccoli, the activation energy of the three phases were 13.1, 69.6, and 72.4 kJ/mole, respectively, for the dry-glassy, dry-glassy-rubbery, and dry-rubbery-flow. These critical phases could be determined from the thermal and mechanical glass transitions. This indicated that required reaction activations were similar at the dry-glass and moist-glass as well as dry-rubbery-flow and moist-rubbery-flow, whereas the main differences were observed in the glassy-rubbery phases (i.e. 1.66 time higher at the dry state). The rate constants were analyzed within the 13 micro-region in the state diagram and it was observed that rate constants increased as the micro-region increased. Rate constant was transformed to dimensionless variable considering a reference point (i.e. at glass line for sample containing un-freezable water at each moisture or maximal-freeze-concentration condition, i.e. ultimate Tg′′′ for sample containing freezable water), and dimensionless moisture based on BET-monolayer and glass transition temperature considering a reference point as mentioned above. Finally, empirical correlations of the dimensionless rate constants were developed as a function of dimensional moisture and storage temperature. It is clear that transforming variables to dimensionless scaling could have high potential for developing a generic universal correlation.
Acknowledgments
Authors would like to acknowledge the support of the Sultan Qaboos University toward this research in the area of foods and biomaterials stability.
References
- Scott, W. J. Water Relations of Staphylococcus aureus at 30°C. Austral. J. Biol. Sci. 1953, 6, 549–564. DOI: https://doi.org/10.1071/BI9530549.
- White, G. W.; Cakebread, S. H. The Glassy State in Certain Sugar-containing Food Products. J. Food Technol. 1966, 1, 73–82. DOI: https://doi.org/10.1111/j.1365-2621.1966.tb01031.x.
- Levine, H.; Slade, L. A Polymer Physico-chemical Approach to the Study of Commercial Starch Hydrolysis Products (Shps). Carbohydr. Polym. 1986, 6, 213–244. DOI: https://doi.org/10.1016/0144-8617(86)90021-4.
- Slade, L.; Levine, H. Non-equilibrium Behavior of Small Carbohydrate-water Systems. Pure Appl. Chem. 1988, 60, 1841–1864. DOI: https://doi.org/10.1351/pac198860121841.
- Chirife, J.; Buera, M. P.; Gonzalez, H. H. L. The Mobility and Mold Growth in Glassy/rubbery Substances. In Water Management in the Design and Distribution of Quality Foods; Roos, Y. H., Leslie, R. B., Eds.; Lancaster, Technomic Publishing: Lancaster, USA, 1999, 283-298.
- Van Den Berg, C. Food-water Relations: Progress and Integration, Comments and Thoughts. In Water Relationships in Foods; Levine, H., Slade, L., Eds.; Plenum Press: New York, 1991, 21-28.
- Chirife, J.; Buera, M. D. P.; Labuza, T. P. Water Activity, Water Glass Dynamics, and the Control of Microbiological Growth in Foods. Crit. Rev. Food Sci. Nutr. 1996, 36(5), 465–513. DOI: https://doi.org/10.1080/10408399609527736.
- Rahman, M. S. State Diagram of Foods: Its Potential Use in Food Processing and Product Stability. Trends Food Sci. Technol. 2006, 17, 129–141. DOI: https://doi.org/10.1016/j.tifs.2005.09.009.
- Karel, M.; Anglea, S.; Buera, P.; Karmas, R.; Levi, G.; Roos, Y. Stability-related Transitions of Amorphous Foods. Thermochim. Acta. 1994, 246, 249–269. DOI: https://doi.org/10.1016/0040-6031(94)80094-4.
- Sablani, S. S.; Kasapis, S.; Rahman, M. S. Evaluating Water Activity and Glass Transition Concepts for Food Stability. J. Food Eng. 2007, 78, 266–271. DOI: https://doi.org/10.1016/j.jfoodeng.2005.09.025.
- Rahman, M. S. Food Stability beyond Water Activity and Glass Transition: Macro-micro Region Concept in the State Diagram. Int. J. Food Prop. 2009, 12(4), 726–740. DOI: https://doi.org/10.1080/10942910802628107.
- Rahman, M. S. Food Stability Determination by Macro-micro Region Concept in the State Diagram and by Defining a Critical Temperature. J. Food Eng. 2010, 99(4), 402–416. DOI: https://doi.org/10.1016/j.jfoodeng.2009.07.011.
- Rahman, M. S. Applications of Macro-micro Region Concept in the State Diagram and Critical Temperature Concepts in Determining the Food Stability. Food Chem. 2012, 132(4), 1679–1685. DOI: https://doi.org/10.1016/j.foodchem.2011.09.092.
- Rahman, M. S.; Al-Saidi, G. S. Exploring Validity of the Macro-micro Region Concept in the State Diagram: Browning of Raw and Freeze-dried Banana Slices as a Function of Moisture Content and Storage Temperature. J. Food Eng. 2017, 203, 32–40. DOI: https://doi.org/10.1016/j.jfoodeng.2017.01.017.
- Zhang, Y.; Zhao, J.; Ding, Y.; Xiao, H.; Sablani, S. S.; Nie, Y.; Wu, S.; Tang, X. Changes in the Vitamin C Content of Mango with Water State and Ice Crystals under State/phase Transitions during Frozen Storage. J. Food Eng. 2018, 222, 49–53. DOI: https://doi.org/10.1016/j.jfoodeng.2017.11.003.
- Zhang, Y.; Zhao, J.; Ding, Y.; Nie, Y.; Xiao, H.; Zhu, Z.; Tang, X. Effects of State/phase Transitions on the Quality Attributes of Mango (Mangifera Indica L.) During Frozen Storage. Int. J. Food Sci. Technol. 2017, 52, 239–246. DOI: https://doi.org/10.1111/ijfs.13275.
- McKenna, G. B. Glassy States: Concentration Glasses and Temperature Glasses Compared. J. Non-Cryst. Solids. 2007, 353, 3820–3828. DOI: https://doi.org/10.1016/j.jnoncrysol.2007.02.067.
- Jirasatida, S.; Noipant, P. 2015. Thermal Degradation Kinetics of Vitamin C in Jamaican Cherry (Muntingia Calabura L.) Juice. Proceedings of the Burapha University International Conference 2015, Bangsaen, Chonburi, Thailand, p. 540–546.
- Phillips, K. M.; Council-Troche, M.; McGinty, R. C.; Rasor, A. S.; Tarrago-Trani, M. T. Stability of Vitamin C in Fruit and Vegetable Homogenates Stored at Different Temperatures. J. Food Compost. Anal. 2016, 45, 147–162. DOI: https://doi.org/10.1016/j.jfca.2015.09.008.
- Park, H. J.; Lee, M. J.; Lee, H. R. Vitamin C and Antioxidant Capacity Stability in Cherry and Romaine during Storage at Different Temperatures. J. Nutr. Health 2016, 49(1), 51–58. DOI: https://doi.org/10.4163/jnh.2016.49.1.51.
- Valsikova, M.; Mezeyova, I.; Rehus, M.; Slosar, M. Changes of Vitamin C Content in Celery and Parsley Herb after Processing. Sci. J. Food Industry 2016, 10(1), 637–642.
- Masamba, K. G.; Mndalira, K. Vitamin C Stability in Pineapple, Guava and Baobab Juices under Different Storage Conditions Using Different Levels of Sodium Benzoate and Metabisulphite. Afr. J. Biotechnol. 2013, 12(2), 186–191. DOI: https://doi.org/10.5897/AJB10.501.
- Munyaka, A.; Edwardmakule, E.; Oey, I.; Van Loey, A.; Hendrickx, A. Thermal Stability of L-ascorbic Acid and Ascorbic Acid Oxidase in Broccoli (Brassica Oleracea Var. Italica). J. Food Sci. 2010, 75(4), C336–C340. DOI: https://doi.org/10.1111/j.1750-3841.2010.01573.x.
- Calligaris, S.; Manzocco, L.; Lagazio, C. Modeling Shelf Life Using Chemical, Physical, and Sensory Indicators. In Shelf-Life Prediction of Food; Nicoli, M. C., Ed.; CRC Press, Boca Raton: Boca Raton, 2012; pp 75–126.
- Hal, P. H.; Bosschaart, C.; van Twisk, C.; Verkerk, R.; Dekker, M. Kinetics of Thermal Degradation of Vitamin C in Marula Fruit (Sclerocarya Birrea Subsp. Caffra) as Compared to Other Selected Tropical Fruits. Food Sci. Technol. 2012, 49, 188–191.
- Ariahu, C. C.; Abashi, D. K.; Chinma, C. E. Kinetics of Ascorbic Acid Loss during Hot Water Blanching of Fluted Pumpkin (Telfairia Occidentalis) Leaves. J. Food Sci. Technol. 2011, 48(4), 454–459. DOI: https://doi.org/10.1007/s13197-010-0123-0.
- Herbig, A.; Renard, C. M. G. C. Factors that Impact the Stability of Vitamin C at Intermediate Temperatures in a Food Matrix. Food Chem. 2017, 220, 444–451. DOI: https://doi.org/10.1016/j.foodchem.2016.10.012.
- Suresh, S.; Al-Habsi, G. N.; Rahman, M. S.; Rahman, M. S. Thermal Characteristics and State Diagram of Freeze-dried Broccoli: Freezing Curve, Maximal-freeze-concentration Condition, Glass Line and Solids-melting. Thermochim. Acta. 2017, 655, 129–136. DOI: https://doi.org/10.1016/j.tca.2017.06.015.
- Al-Habsi, N.; Suresh, S.; Al-Yhmedi, A.; Al-Shoryani, M.; Waly, M. I.; Rahman, M. S. Stability of Vitamin C in Broccoli at Different Storage Conditions. Int. J. Food Stud. 2019, 8(1), 58–67.
- AOAC. Official Methods of Analysis of the AOAC; Association of Official Analytical Chemists: Arlington, 1990.
- MS-Excel; Microsoft Office: Washington, US, 2016.
- Ryan, P. D.; Harper, D. A. T.; Whalley, J. S. PALSTAT, PAST 3.1 Statistics for Palaeontologists; Chapman and Hall: New York, 1995.
- Sherrod, P. H. NLREG: Nonlinear Regression Analysis Program, 9207 Brushboro Drive, Brentwood, TN 37027, US; 1991. http://www.nlreg.com
- Rahman, M. S.; Al-Marhubi, I. M.; Al-Mahrouqi, A. Measurement of Glass Transition Temperature by Mechanical (DMTA), Thermal (DSC and MDSC), Water Diffusion and Density Methods: A Comparison Study. Chem. Phys. Lett. 2007, 440, 372–377. DOI: https://doi.org/10.1016/j.cplett.2007.04.067.
- Rahman, M. S.; Al-Rawahi, A. Glass Transition of Pomegranate Skin, as Analyzed by Thermal, Mechanical, and Nuclear Magnetic Resonance Methods. Int. J. Food Prop. 2017, 20(2), 423–435. DOI: https://doi.org/10.1080/10942912.2016.1163724.
- Phillips, K. M.; Tarrago-Trani, M. T.; Gebhardt, S. E.; Exler, J.; Patterson, K. Y.; Haytowitz, D. B.; Pehrsson, P. R.; Holden, J. M. Stability of Vitamin C in Frozen Raw Fruit and Vegetable Homogenates. J. Food Compost. Anal. 2010, 23, 253–259. DOI: https://doi.org/10.1016/j.jfca.2009.08.018.
- Penicaud, C.; Broyart, B.; Peyron, S.; Gontard, N.; Guillard, V. Mechanistic Model to Couple Oxygen Transfer with Ascorbic Acid Oxidation Kinetics in Model Solid Food. J. Food Eng. 2011, 104(1), 96–104. DOI: https://doi.org/10.1016/j.jfoodeng.2010.11.033.
- Lipasek, R. A.; Taylor, L. S.; Mauer, L. J. Effects of Anticaking Agents and Relative Humidity on the Physical and Chemical Stability of Powdered Vitamin C. J. Food Sci. 2011, 76(7), C1062–C1074. DOI: https://doi.org/10.1111/j.1750-3841.2011.02333.x.
- Hiatt, A. N.; Taylor, L. S.; Mauer, L. J. Influence of Simultaneous Variations in Temperature and Relative Humidity on Chemical Stability of Two Vitamin C Forms and Implications for Shelf Life Models. J. Agric. Food Chem. 2010, 58, 3532–3540. DOI: https://doi.org/10.1021/jf903342f.
- Nath, A.; Bagchi, B.; Misra, L. K.; Deka, B. C. Changes in Post-harvest Phytochemical Qualities of Broccoli Florets during Ambient and Refrigerated Storage. Food Chem. 2011, 127, 1510–1514. DOI: https://doi.org/10.1016/j.foodchem.2011.02.007.
- Gonzalez-Molina, E.; Girones-Vilaplana, A.; Mena, P.; Moreno, D. A.; Garcia-Viguera, C. New Beverages of Lemon Juice with Elderberry and Grape Concentrates as a Source of Bioactive Compounds. J. Food Sci. 2012, 77(6), C728–733. DOI: https://doi.org/10.1111/j.1750-3841.2012.02715.x.
- Ordonez-Santos, L. E.; Portilla, M. A. O.; Rodriguez, D. X. R. Thermal Degradation Kinetics of Vitamin C in Guava Fruits (Psidium Guajava L.). Revista Lasallista de Investig. 2013, 10(2), 44–51.
- Courtois, F.; Vedrenne, L.; George, S. Mathematical Modelling of Some Nutrient Losses during Heat Treatment of Stewed Apples. Czech. J. Food Sci. 2009, 27, S23–S26. DOI: https://doi.org/10.17221/966-CJFS.
- Zwart, S. R.; Kloeris, V. L.; Perchonok, M. H.; Braby, L.; Smith, S. M. Assessment of Nutrient Stability in Foods from the Space Food System after Long-duration Spaceflight on the ISS. J. Food Sci. 2009, 74(7), H209–H217. DOI: https://doi.org/10.1111/j.1750-3841.2009.01265.x.
- Neri, L.; Pittia, P.; Bertolo, G.; Torreggiani, D.; Sacchetti, G. Influence of Water Activity and Molecular Mobility on Peroxidase Activity in Salt and Sorbitol–maltodextrin Systems. J. Food Eng. 2010, 101(3), 289–295. DOI: https://doi.org/10.1016/j.jfoodeng.2010.07.010.
- Torreggiani, D.; Forni, E.; Guercilena, I.; Maestrelli, A.; Bertolo, G.; Archer, G. P.; Kennedy, C. J.; Bone, S.; Blond, G.; Contreras-Lopez, E.; et al. Modification of Glass Transition Temperature through Carbohydrates Additions: Effect upon Colour and Anthocyanin Pigment Stability in Frozen Strawberry Juices. Food Res. Int. 1999, 32, 441–446. DOI: https://doi.org/10.1016/S0963-9969(99)00106-4.
- Rahman, M. S.; Al-Saidi, G.; Guizani, N.; Abdullah, A. Development of State Diagram of Bovine Gelatin by Measuring Thermal Characteristics Using Differential Scanning Calorimetry (DSC) and Cooling Curve Method. Thermochim. Acta. 2010, 509, 111–119. DOI: https://doi.org/10.1016/j.tca.2010.06.011.
- Al-Farsi, K. A.; Al-Habsi, N. A.; Rahman, M. S. State Diagram of Crystallized Date-syrup: Freezing Curve, Glass Transition, Crystals-melting and Maximal-freeze-concentration Condition. Thermochim. Acta. 2018, 666, 166–173. DOI: https://doi.org/10.1016/j.tca.2018.06.003.
- Tombari, E.; Salvetti, G.; Ferrari, C.; Johari, G. P. Kinetics and Thermodynamics of Sucrose Hydrolysis from Real-Time Enthalpy and Heat Capacity Measurements. J. Phys. Chem. B. 2007, 111, 496–501. DOI: https://doi.org/10.1021/jp067061p.
- Davey, K. R. Applicability of the Davey (Linear Arrhenius) Predictive Model to the Lag Phase of Microbial Growth. J. Appl. Bacteriol. 1991, 70, 253–257. DOI: https://doi.org/10.1111/j.1365-2672.1991.tb02933.x.